Abstract
Purpose
To simultaneously detect iron-labeled cancer cells and brain tumors in vivo in one scan, the balanced steady-state free precession (b-SSFP) imaging sequence was optimized at 1.5 T on mice developing brain metastases subsequent to the injection of micron-sized iron oxide particle-labeled human breast cancer cells.
Materials and Methods
b-SSFP sequence parameters (repetition time, flip angle, and receiver bandwidth) were varied and the signal-to-noise ratio, contrast between the brain and tumors, and the number of detected iron-labeled cells were evaluated.
Results
Optimal b-SSFP images were acquired with a 26 msec repetition time, 35° flip angle, and bandwidth of ±21 kHz. b-SSFP images were compared with T2-weighted 2D fast spin echo (FSE) and 3D spoiled gradient recalled echo (SPGR) images. The mean tumor-brain contrast-to-noise ratio and the ability to detect iron-labeled cells were the highest in the b-SSFP images.
Conclusion
A single b-SSFP scan can be used to visualize both iron-labeled cells and brain metastases.
Keywords: MRI, b-SSFP, iron, cancer, metastasis, brain
THE INCIDENCE OF BREAST CANCER patients with brain metastases is increasing (1,2). This is due in part to the pharmaceutical focus on development of therapeutic agents that successfully treat systemic, but not brain metastases. Still, the median survival time with aggressive treatment is extended by only 4–12 months.
To study the mechanisms of breast cancer metastasis to the brain, mouse models have been developed using human breast cancer cell lines (3,4). Histology, immunohistochemistry, and microscopy are typically used to estimate the numbers and the cross-sectional area of metastases, and for analysis of cellular markers (5–7). The limitations of these methods are the need to sacrifice the animal, allowing only an endpoint analysis, and the small subset of tissue volume assessed.
Microimaging technologies, including high-resolution magnetic resonance imaging (MRI), micro-computed tomography, and positron emission tomography have shown great utility for characterizing small-animal models of disease. MRI is particularly well suited for studies of brain metastasis because it is noninvasive, three-dimensional, has excellent soft-tissue contrast, and no limitation in depth of penetration at clinical magnetic field strengths.
Cellular MRI combines the use of high-resolution MRI with cell labels to track cells of interest. The most commonly used labels are iron-based nanoparticles including superparamagnetic, ultrasmall, and micron-sized iron oxide particles (MPIO). Stem cells (8), macrophages (9), dendritic cells (10), cancer cells (11), and lymphocytes (12) have been tracked in vivo with MRI using this approach. The presence of the label causes a distortion in the magnetic field and leads to abnormal signal hypointensities in iron-sensitive images.
Most studies have employed T2-weighted (T2w) spin echo, and T2*-weighted gradient echo sequences to detect iron-labeled cells. The balanced steady-state free precession (b-SSFP) imaging sequence has been used to detect single iron-labeled macrophages and cancer cells in vivo as signal voids in the mouse brain (11,13). The major advantage of the b-SSFP sequence is its high signal-to-noise ratio (SNR) efficiency, allowing for imaging at high spatial resolution in reasonable scan times (14). Another important feature of b-SSFP is its high sensitivity to magnetic field inhomogeneities (15,16).
Miraux et al (17) also investigated the b-SSFP sequence on mouse brains at 4.7 and 9.4 T. They compared b-SSFP images of implanted gliomas with T2w SE images, the most commonly employed contrast for the visualization of brain tumors in mice. At 4.7 T the SNR and brain-to-tumor contrast-to-noise ratio (CNR) were comparable in b-SSFP and T2w images, but the scan time was ≈4 times shorter with b-SSFP. At 9.4 T, the CNR was attenuated and tumors were barely visible.
Bernas et al (18) developed a b-SSFP protocol at 3 T to optimally visualize iron-loaded glioma in the mouse brain. This protocol consists of a set of two b-SSFP image acquisitions with complementary contrasts, allowing delineation of tumors, which appear as regions of signal hyperintensity due to longer T2 of tumor tissue compared to brain parenchyma, and providing high sensitivity to iron-labeled cells, which are detected as regions of signal void.
The purpose of this study was to optimize b-SSFP at 1.5 T with the goal of generating image contrast for the simultaneous detection of single iron-labeled cancer cells and brain tumors in vivo in one scan. A single scan would reduce the acquisition time and allow for monitoring of both nonproliferative cancer cells and developing metastases. For this purpose, MPIO-labeled cancer cells were injected into the left ventricle of the heart in nude mice. After intracardiac injection, cells become trapped in the brain microvasculature. With time, some cancer cells proliferate into metastases that appear as regions of signal hyperintensity in b-SSFP images, primarily due to increased T2 relaxation, while other cells remain dormant (nonproliferative) and are detected as persistent signal voids (11).
MATERIALS AND METHODS
Cancer Cell Labeling
Brain-metastatic clones of human breast cancer cells (MDA-MB-231BR) expressing constitutively enhanced green fluorescent protein (3) were cultured in DMEM (Dulbecco’s Modified Eagle’s Medium) containing 10% FBS (fetal bovine serum) at 37°C and 5% CO2 as previously described (11).
Briefly, 105 cells were plated in 75 cm2 flasks and allowed to adhere for 24 hours. Then 10 μL/mL of MPIO (5 ×10⁸ beads; 0.9 μm, 63% magnetite, labeled with Flash Red; Bangs Laboratory, Fishers, IN) were added to the culturing media for 24 hours. Cells were washed with phosphate-buffered saline (PBS) to remove unincorporated MPIO, spun down at 1000 rpm/5 minutes, and resuspended in DMEM in order to get 175,000 cells per 100μL. Perl’s Prussian Blue (PPB) staining was used to visualize iron within cells. The labeling efficiency was determined from the PPB-stained cytospin slides by calculating the ratio between the number of PPB-positive cells and the total number of cells counted in three random fields of view (FOVs) at 20× magnification using a Zeiss AXIO Imager A1 Microscope.
Viability Tests
The Trypan blue exclusion assay was performed to determine the viability of MPIO-labeled and unlabeled cells. The amount of apoptotic and necrotic cells was also determined by staining cells with 7-amino-actinomycin (7-AAD; Becton Dickinson, ON, Canada) and Annexin V (Becton Dickinson) and using flow cytometry, as described previously (19).
Animal Preparation
Female nu/nu mice (N = 16, 6–7 weeks old; Charles River Laboratories, Wilmington, MA) were anesthetized with isoflurane. A 1-mL syringe was inserted perpendicular to the sternum. A 100-μL suspension of MPIO-labeled MDA-MB-231BR cells (175,000 cells) was then slowly injected into the left ventricle of the heart. Mice were imaged 29 days after injection.
MRI
MRI examinations were performed on a 1.5 T GE CV/I whole-body clinical MR scanner using a custom-built, high-performance insertable gradient coil (inner diameter = 17.5 cm, maximum gradient strength = 500 mT/m, peak slew rate = 3000 T/m/s). The mouse head was placed within a custom-built solenoidal mouse head radiofrequency (RF) coil (inner diameter = 1.5 cm). Mice were anesthetized with isoflurane (2% in 100% oxygen) and body temperature was maintained during the imaging session using warm water bags.
Images were acquired using the 3D b-SSFP sequence with the following constant parameters: FOV = 15 × 15 mm, slice thickness = 200 μm, matrix = 150 × 150, resolution = 100 × 100 × 200 μm, 4 RF phase cycles. Other parameters were varied: repetition time (6, 16, and 26 msec), flip angle (FA) (10°, 35 °, and 50°) and receiver bandwidth (rBW; ±6, ±21, and ±41 kHz). Only one parameter was changed at a time. TR and TE were linked: TE = TR/2. The number of signal averages (NEX) was varied to keep scan time at 40 minutes (Table 1).
Table 1.
b-SSFP Parameters Used to Optimize the Simultaneous Detection of Iron-Labeled Cells and Brain Metastases
| TR(ms) | FA(°) | rBW(6kHz) | NEX |
|---|---|---|---|
| 6 | 35 | 21 | 8 |
| 16 | 35 | 21 | 3 |
| 26 | 35 | 21 | 2 |
| 26 | 10 | 21 | 2 |
| 26 | 35 | 21 | 2 |
| 26 | 50 | 21 | 2 |
| 26 | 35 | 6 | 2 |
| 26 | 35 | 21 | 2 |
| 26 | 35 | 41 | 2 |
For each sets of experiments, only one parameter was changed: repetition time (TR), or flip angle (FA), or reception bandwidth (rBW). Furthermore, for the first set of experiments, as TR was modified the number of averages (NEX) was decreased in order to maintain an acquisition time of 40 minutes.
b-SSFP images were compared with T2w 2D fast spin echo (FSE) and 3D spoiled gradient recalled echo (SPGR) images. FSE parameters were: TR/TE = 3000/120 msec, rBW = ±21 kHz; resolution = 100 × 100 × 300 μm; 34 NEX, scan time = 40 minutes 54 seconds. SPGR parameters were: TR/TE = 25/2.3 msec; FA = 30°; rBW = ±31 kHz; resolution = 100 × 100 × 200 μm; 8 NEX, scan time = 40 minutes 1 second. The SPGR sequence was optimized for void detection, keeping TR = 26 msec as in the b-SSFP sequence (not shown). Gadolinium-based contrast agent was not administered, as commonly used in the clinical setting, since this would require faster acquisition times to capture the enhancement, decreasing resolution and limiting the detection of signal voids.
Analysis
The SNR of brain tissue and the CNR between tumors and the surrounding brain were measured. CNR was measured for four tumors per slice for each sequence. The region of interest for healthy brain was drawn in the caudate putamen. The contrast generated by the iron-labeled cells was measured as the fractional signal loss (FSL): FSL = (Sb-Sv)/Sb, where Sb is the mean signal intensity of background brain tissue and Sv is the signal from the central voxel in the region of signal loss. The number of voids was counted in three image slices, in the frontal, mid-, and posterior brain. Identical slices were evaluated when comparing different parameters. Comparisons between the measurements for different images were made using paired Student’s t-test.
RESULTS
Cell Labeling
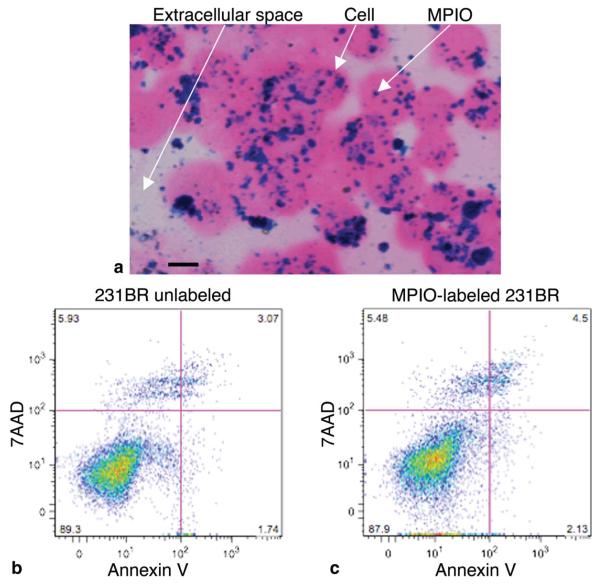
PPB staining showed iron particles within 231BR cells (Fig. 1A). The labeling efficiency was 98%. The Trypan blue exclusion assay demonstrated that 94.2% of the injected labeled cells were viable (data not shown). Representative Annexin/7AAD flow cytometry dot plots (Fig. 1B,C) show that 89.3% of unlabeled cells and 87.9% of MPIO-labeled cells were viable (7AAD−/Annexin−). The percentage of necrotic cells (7AAD+/Annexin−) was 5.9% for unlabeled cells and 5.5% for MPIO-labeled cells. The percentage of early apoptotic cells (7AAD−/Annexin+) was 1.7% for unlabeled cells and 2.1% for MPIO-labeled cells. Finally, 3.1% of unlabeled cells and 4.5% of MPIO-labeled cells were characterized as being in the late apoptotic stage or dead (7AAD+/Annexin+).
Figure 1.
Overnight labeling with MPIO particles does not affect cell viability. A: Cells stained with PPB and counterstained with eosin to detect the presence of iron. Intracellular iron (arrow) was detected in the cytoplasm of MPIO-labeled cells. Magnification = 40 ×; scale bar = 10 μm. B,C: Representative flow cytometry dot plots depicting 7AAD/Annexin staining of either unlabeled (B) or MPIO-labeled (C) cells. There were no differences in the percentage of cells in early apoptosis (Annexin+), necrosis (7AAD+), or late apoptosis/dead (7AAD+Annexin+) for MPIO-labeled versus unlabeled cells.
Effect of TR on Void Detection and Tumor Contrast
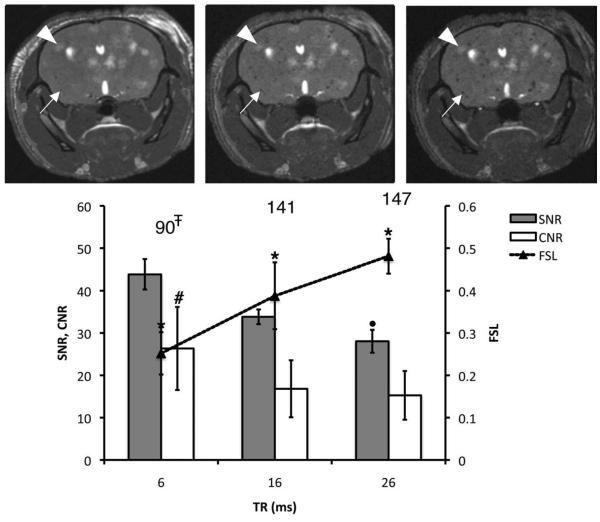
Figure 2 shows the effect of increasing TR on void (solid arrows) and metastasis (arrowheads) detection in vivo (FA and rBW were fixed at 35° and ±21 kHz). The average FSL of the voids increased from 0.25 to 0.48, when increasing TR between 6 and 26 msec. Furthermore, the number of voids counted was significantly higher for TR = 26 msec compared with TR = 6 msec (147 vs. 90 voids). The SNR decreased with increasing TR. The CNR was significantly higher for the shortest TR value compared to TR = 16 or 26 msec but not different for these two higher values of TR. The optimal TR was chosen as 26 msec because the ability to detect signal voids was maximal without compromising the ability to visualize tumors. Although the SNR was significantly lower at the highest TR value, higher SNR at TR = 16 msec did not lead to the detection of more voids or additional tumor contrast.
Figure 2.
Effect of increasing TR on void detection and tumor contrast. Brain SNR, CNR, and FSL are plotted for three different values of TR. The total number of detected voids is shown for each condition. The corresponding mouse brain 3D b-SSFP axial images acquired with TR = 6, 16, and 26 msec are shown from left to right. All of the images were acquired using BW = ±21 kHz and FA = 35°. The arrows are pointing to a representative void, which FSL increased with TR. Arrowheads point to a representative tumor. *Significantly different from other FSL values (P < 0.05). #Significantly greater than CNR values at 16 or 26 msec (P < 0.05). ∓Significantly lower than values at 26 msec (P < 0.05). •Significantly lower than SNR measured at 6 or 16 msec (P < 0.05).
Effect of FA on Void Detection and Tumor Contrast
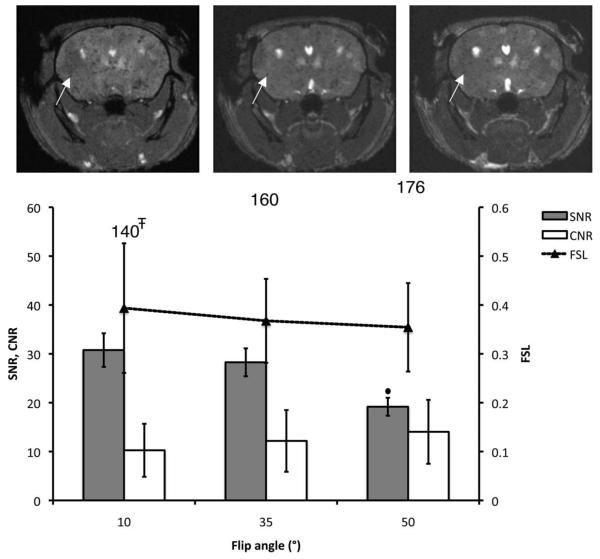
Figure 3 shows the effect of the FA on void and metastasis detection in vivo (TR and rBW were fixed at 26 msec and ±21 kHz). There were no significant differences in FSL or in the ability to visualize tumors (CNR) for the various FA values. However, the SNR was significantly lower at FA = 50° compared to FA = 35°. In addition, the number of detected voids was statistically lower at FA = 10° compared to FA = 35°. The optimal FA was therefore chosen as 35°.
Figure 3.
Effect of the FA on void detection and tumor contrast. Brain SNR, CNR, and FSL are plotted for three different values of FA. The total number of detected voids is shown for each condition. The corresponding mouse brain 3D b-SSFP axial images acquired with FA = 10, 35, and 50° are shown from left to right. All of the images were acquired using BW = ±21 kHz and TR = 26 msec. The arrows point to a representative void, for which FSL remains the same with FA. ∓Significantly lower than values obtained with FA of 35° (P < 0.01). •Significantly lower than SNR measured at FA = 35° (P < 0.05).
Effect of SNR on Void Detection and Tumor Contrast
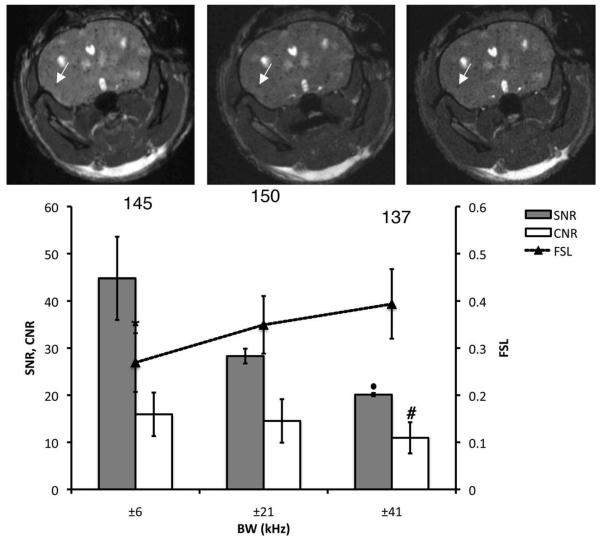
Figure 4 shows the effect of the SNR on void and tumor detection in vivo, using different rBWs (TR and FA were fixed at 26 msec and 35°). As predicted, increasing the rBW resulted in lower SNR and CNR. However, the FSL increased as the SNR decreased. The mean FSL is significantly higher for rBW of ±21 or ±41 kHz, compared to ±6 kHz. The number of signal voids counted for the three rBWs was not significantly different. For the simultaneous detection of both hyperintense brain metastases and signal voids due to iron-labeled cells in b-SSFP images, the following parameters were chosen: TR = 26 msec, FA = 35°, and rBW = ±21 kHz.
Figure 4.
Effect of the SNR on void detection and tumor contrast. Brain SNR, CNR, and FSL are plotted for three different values of rBW. The total number of detected voids is shown for each condition. In addition, the corresponding 3D b-SSFP axial images of the same mouse brain as in previous figures, acquired with rBW = ±6 kHz, ±21 kHz, and ±41 kHz, are shown from left to right. All of the images were acquired using FA = 35° and TR = 26 msec. increased The arrows point to a representative voids, which FSL with rBW. *Significantly lower FSL compared to rBW of ±21 or ±41 kHz (P < 0.05). #Significantly lower than CNR values at ±6 kHz (P < 0.01). •Significantly lower than SNR measured with rBW of ±6 or ±21 kHz (P < 0.05).
Sequence Comparison
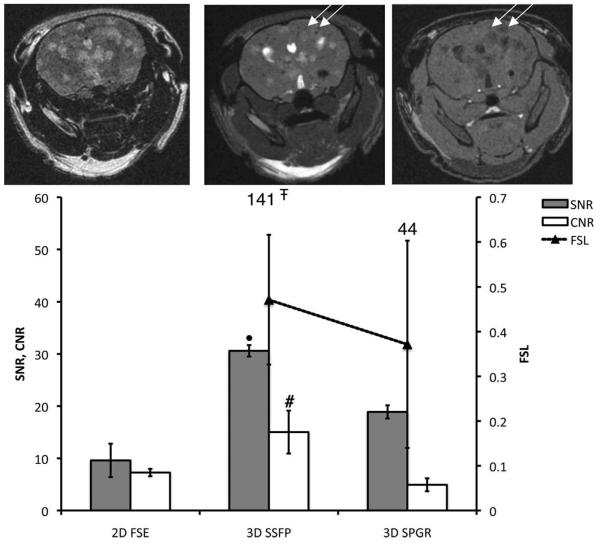
The b-SSFP images were compared with T2w 2D FSE images and T1w 3D SPGR images (Fig. 5). Tumors appeared as areas of hyperintensity in both b-SSFP and T2w FSE images. Both tumors and iron-labeled cells appear with low signal intensity in T1w SPGR images. In a comparison of three b-SSFP and SPGR image slices, 32 tumors were detected in b-SSFP images while only 18 of these tumors could be seen in SPGR images. The mean CNR and SNR were the highest in the b-SSFP images.
Figure 5.
Comparison between FSE/b-SSFP/SPGR sequences for tumor contrast and void detection. Brain SNR and CNR are plotted for three different sequences. The total number of detected voids is also shown for each sequence. 2D FSE, 3D b-SSFP, and 3D SPGR axial images of the same mouse brain are shown from left to right. The b-SSFP image was acquired using BW = ±21 kHz, FA = 35°, and TR = 26 msec. The FSE image was acquired with TE/TR = 120/3000 msec, BW = ±21 kHz. The SPGR image was acquired with TE/TR = 2.3/25 msec, FA = 30°, and BW = ±31 kHz. The arrows point two representative voids to that were detected on both b-SSFP and SPGR. #Significantly higher CNR than that obtained using FSE or SPGR sequences (P < 0.05). ∓Significantly higher than numbers counted on SPGR images (P < 0.05). •Significantly higher SNR compared to FSE or SPGR image (P < 0.05).
Although this was not a strict comparison of sequences (timing parameters, resolution, rBW were not equivalent), the number of voids and the FSL were measured. In the FSE images, signal voids were very difficult to detect and could not be counted. The number of voids counted in b-SSFP images was much greater than for SPGR (141 vs. 44 voids). When voids that were detected in both b-SSFP and SPGR are evaluated, the mean FSL was significantly higher for b-SSFP (0.47) vs. SPGR (0.37). Signal voids that were only detected on b-SSFP images had a mean FSL of 0.22. This suggests that cells with lower iron content can be detected in b-SSFP images but not in SPGR images.
DISCUSSION
In this study the b-SSFP parameters were varied to maximize the contrast of both the persistent signal voids and the metastases, while maintaining sufficient SNR and artifact-free images. In this b-SSFP sequence the TR and TE are linked and have a ratio of 2:1. Therefore, physically changing TR also changes TE. As TR was increased, the FSL and the number of voids counted increased. The longer TR values allow for the detection of cells that contain lesser amounts of iron. The level of hypointensity in a b-SSFP image results from the extent of susceptibility-induced dephasing within a voxel (14) that occurs between excitation pulses (ie, within TR). This means that the longer the TR, the greater the amount of dephasing taking place and therefore the darker the void gets. Similarly, increasing TE also improves the detection of iron-labeled cells by increasing dephasing (20,21). In this study TR/TE was maintained at 26/13 msec to keep the highest capacity of void detection.
Tissue contrast for the b-SSFP sequence depends primarily on the FA and on the T2/T1 ratio. As the FA was increased, the SNR decreased. On the other hand, the number of voids counted was significantly lower at FA = 10° compared to FA = 35° or 50°. A compromise between void detection and SNR led to the choice of an intermediate value for FA.
When the rBW was increased, a decrease in the SNR was measured. This is predictable, as higher rBW results in increasing noise. However, FSL increased with higher rBW (and lower SNR). This might be explained by the effect of the rBW on the point spread function, which affects image quality and spatial resolution (22). As the rBW is reduced, the readout time is longer, and there will be more signal decaying toward the edge of k-space and more blur. As you blur the image, the fractional signal loss will decrease. Overall, the rBW = ±21 kHz was the best compromise for the detection of both voids and metastases in the brain.
For our mouse studies, we implemented a custombuilt high-performance gradient insert on a clinical 1.5 T system. Although this imaging approach was implemented for preclinical imaging, it is worth considering the issues related to the application of these methods to human studies. The b-SSFP sequence itself is available and runs on most scanners. While the maximum strength of the insertable gradient coil used in this study is 500 mT/m, we operated below this. For example, with rBW of 21 kHz, and FOV of 1 cm (gamma is 4257 Hz/g), the strength of the readout gradient is ≈10 g/cm = 100 mT/m [G(readout) = 2*rBW/(gamma* FOV)]. The gradient strength used to excite the slab is also far below this maximum strength since a thick slab is used that encompasses the whole brain. Clinical gradients of 50 mT/m and higher are now available on whole body scanners; therefore, b-SSFP protocols similar to that used in this study are not out of the question for modern-day clinical gradients. A more fundamental problem will be achieving the same resolution in humans as for mice, which is currently impractical. Advances in gradient and RF coil technology should eventually allow for this imaging approach to be applied in a similar fashion for human studies. However, at present the use of lower gradient strengths and resolutions will mean that the cell and iron detection limits in humans will be different compared to mice.
In conclusion, this study shows that with optimized imaging parameters, the fate of both nonproliferative, iron-loaded cancer cells, and proliferating brain metastases can be tracked simultaneously in vivo in b-SSFP images. In the preclinical setting, this technology will be important for monitoring the fate of ironlabeled cells and the development of tumors, and responses of cell populations to treatments.
Acknowledgments
Contract grant sponsor: US Department of Defense Breast Cancer Research Program; Contract grant number: W81XWH-06-2-0033 (to P.S.S., A.F.C., P.J.F.); Contract grant sponsors: Translational Breast Cancer Fellowship from the London Regional Cancer Program (to E.J.R.); Canada Research Chairs Program (Canada Research Chair in Oncology to A.F.C.); Intramural Program of the National Cancer Institute (to P.S.S.).
REFERENCES
- 1.Miller K, Weathers T, Hanley L, et al. Occult central nervous system involvement in patients with metastatic breast cancer: prevalence, predictive factors and impact on overall survival. Ann Oncol. 2003;14:1072–1077. doi: 10.1093/annonc/mdg300. [DOI] [PubMed] [Google Scholar]
- 2.Weil RJ, Palmieri DC, Bronder JL, Stark AM, Steeg PS. Breast cancer metastasis to the central nervous system. Am J Pathol. 2005;167:913–920. doi: 10.1016/S0002-9440(10)61180-7. [DOI] [PMC free article] [PubMed] [Google Scholar]
- 3.Yoneda T, Williams PJ, Hiraga T, Niewolna M, Nishimura R. A boneseeking clone exhibits different biological properties from the MDA-MB-231 parental human breast cancer cells and a brain-seeking clone in vivo and in vitro. J Bone Miner Res. 2001;16:1486–1495. doi: 10.1359/jbmr.2001.16.8.1486. [DOI] [PubMed] [Google Scholar]
- 4.Rye PD, Norum L, Olsen DR, Garman-Vik S, Kaul S, Fodstad O. Brain metastasis model in athymic nude mice using a novel muc1-secreting human breast cancer cell line. Int J Cancer. 1996;68:682–687. doi: 10.1002/(SICI)1097-0215(19961127)68:5<682::AID-IJC20>3.0.CO;2-2. [DOI] [PubMed] [Google Scholar]
- 5.Thomas FC, Taskar K, Rudraraju V, et al. Uptake of ANG1005, a novel paclitaxel derivative, through the blood-brain barrier into brain and experimental brain metastases of breast cancer. Pharm Res. 2009;26:2486–2494. doi: 10.1007/s11095-009-9964-5. [DOI] [PMC free article] [PubMed] [Google Scholar]
- 6.Palmieri D, Bronder JL, Herring JM, et al. Her-2 overexpression increases the metastatic outgrowth of breast cancer cells in the brain. Cancer Res. 2007;67:4190–4198. doi: 10.1158/0008-5472.CAN-06-3316. [DOI] [PubMed] [Google Scholar]
- 7.Fitzgerald DP, Palmieri D, Hua E, et al. Reactive glia are recruited by highly proliferative brain metastases of breast cancer and promote tumor cell colonization. Clin Exp Metastasis. 2008;25:799–810. doi: 10.1007/s10585-008-9193-z. [DOI] [PMC free article] [PubMed] [Google Scholar]
- 8.Sykova E, Jendelova P. In vivo tracking of stem cells in brain and spinal cord injury. Prog Brain Res. 2007;161:367–383. doi: 10.1016/S0079-6123(06)61026-1. [DOI] [PubMed] [Google Scholar]
- 9.Foley LM, Hitchens TK, Ho C, et al. Magnetic resonance imaging assessment of macrophage accumulation in mouse brain after experimental traumatic brain injury. J Neurotrauma. 2009;26:1509–1519. doi: 10.1089/neu.2008.0747. [DOI] [PMC free article] [PubMed] [Google Scholar]
- 10.Dekaban GA, Snir J, Shrum B, et al. Semiquantitation of mouse dendritic cell migration in vivo using cellular MRI. J Immunother. 2009;32:240–251. doi: 10.1097/CJI.0b013e318197b2a0. [DOI] [PubMed] [Google Scholar]
- 11.Heyn C, Ronald JA, Ramadan SS, et al. In vivo MRI of cancer cell fate at the single cell level in a mouse model of breast cancer metastasis to the brain. Magn Reson Med. 2006;56:1001–1010. doi: 10.1002/mrm.21029. [DOI] [PubMed] [Google Scholar]
- 12.Shapiro EM, Medford-Davis LN, Fahmy TM, Dunbar CE, Koretsky AP. Antibody-mediated cell labeling of peripheral T cells with micron-sized iron oxide particles (MPIOs) allows single cell detection by MRI. Contrast Media Mol Imaging. 2007;2:147–153. doi: 10.1002/cmmi.134. [DOI] [PMC free article] [PubMed] [Google Scholar]
- 13.Heyn C, Ronald JA, Mackenzie LT, et al. In vivo magnetic resonance imaging of single cells in mouse brain with optical validation. Magn Reson Med. 2006;55:23–29. doi: 10.1002/mrm.20747. [DOI] [PubMed] [Google Scholar]
- 14.Scheffler K, Lehnhardt S. Principles and applications of balanced SSFP techniques. Eur Radiol. 2003;13:2409–2418. doi: 10.1007/s00330-003-1957-x. [DOI] [PubMed] [Google Scholar]
- 15.Bangerter NK, Hargreaves BA, Vasanawala SS, Pauly JM, Gold GE, Nishimura DG. Analysis of multiple-acquisition SSFP. Magn Reson Med. 2004;51:1038–1047. doi: 10.1002/mrm.20052. [DOI] [PubMed] [Google Scholar]
- 16.Ramadan SS, Heyn C, Mackenzie LT, Chambers AF, Rutt BK, Foster PJ. Ex-vivo cellular MRI with b-SSFP: quantitative benefits of 3T over 1.5T. MAGMA. 2008;21:251–259. doi: 10.1007/s10334-008-0118-2. [DOI] [PubMed] [Google Scholar]
- 17.Miraux S, Massot P, Ribot EJ, Franconi JM, Thiaudiere E. 3D True-FISP imaging of mouse brain at 4.7T and 9.4T. J Magn Reson Imaging. 2008;28:497–503. doi: 10.1002/jmri.21449. [DOI] [PubMed] [Google Scholar]
- 18.Bernas LM, Foster PJ, Rutt BK. Imaging iron loaded mouse glioma tumors with bSSFP at 3T. Magn Reson Med. 2010;64:23–31. doi: 10.1002/mrm.22210. [DOI] [PubMed] [Google Scholar]
- 19.Gonzalez-Lara LE, Xu X, Hofstetrova K, et al. The use of cellular magnetic resonance imaging to track the fate of iron-labeled multipotent stromal cells after direct transplantation in a mouse model of spinal cord injury. Mol Imaging Biol. 2010 doi: 10.1007/s11307-010-0393-y. [Epub ahead of print] [DOI] [PubMed] [Google Scholar]
- 20.Dodd SJ, Williams M, Suhan JP, et al. Detection of single mammalian cells by high resolution magnetic resonance imaging. Biophys J. 1999;76:103–109. doi: 10.1016/S0006-3495(99)77182-1. [DOI] [PMC free article] [PubMed] [Google Scholar]
- 21.Shapiro EM, Skrtic S, Koretsky AP. Sizing it up: MRI using micron-sized iron particles. Magn Reson Med. 2005;53:329–338. doi: 10.1002/mrm.20342. [DOI] [PubMed] [Google Scholar]
- 22.Goodwill PW, Conolly SM. The X-space formulation of the magnetic particle imaging process: 1-D signal, resolution, bandwidth, SNR, SAR, and magnetostimulation. IEEE Trans Med Imaging. 2010;29:1851–1859. doi: 10.1109/TMI.2010.2052284. [DOI] [PubMed] [Google Scholar]


