Abstract
The goal of this work was to demonstrate the feasibility of using a plastic scintillation detector (PSD) incorporated into a prostate immobilization device to verify doses in vivo delivered during intensity-modulated radiation therapy (IMRT) and volumetric modulated-arc therapy (VMAT) for prostate cancer. The treatment plans for both modalities had been developed for a patient undergoing prostate radiation therapy. First, a study was performed to test the dependence, if any, of PSD accuracy on the number and type of calibration conditions. This study included PSD measurements of each treatment plan being delivered under quality assurance (QA) conditions using a rigid QA phantom. PSD results obtained under these conditions were compared to ionization chamber measurements. After an optimal set of calibration factors had been found, the PSD was combined with a commercial endorectal balloon used for rectal distension and prostate immobilization during external beam radiotherapy. This PSD-enhanced endorectal balloon was placed inside of a deformable anthropomorphic phantom designed to simulate male pelvic anatomy. PSD results obtained under these so-called “simulated treatment conditions” were compared to doses calculated by the treatment planning system (TPS). With the PSD still inserted in the pelvic phantom, each plan was delivered once again after applying a shift of 1 cm anterior to the original isocenter to simulate a treatment setup error.
The mean total accumulated dose measured using the PSD differed the TPS-calculated doses by less than 1% for both treatment modalities simulated treatment conditions using the pelvic phantom. When the isocenter was shifted, the PSD results differed from the TPS calculations of mean dose by 1.2% (for IMRT) and 10.1% (for VMAT); in both cases, the doses were within the dose range calculated over the detector volume for these regions of steep dose gradient. Our results suggest that the system could benefit prostate cancer patient treatment by providing accurate in vivo dose reports during treatment and verify in real-time whether treatments are being delivered according to the prescribed plan.
Keywords: in vivo dosimetry, real-time monitoring, plastic scintillation dosimetry
1. Introduction
Intensity-modulated radiation therapy (IMRT) has become a widely used platform for the treatment of prostate cancer (Ling et al., 1996; Purdy and Michalski, 2001; Webb, 2005) and has been shown to produce better outcomes (e.g. lower toxicities) than three-dimensional conformal radiation therapy (Al-Mamgani et al., 2009; Zelefsky et al., 2001). Volumetric modulated-arc therapy (VMAT) is a recent technological progression of IMRT that provides dynamic delivery by continuously varying the multileaf collimation and dose rate during nonstop gantry rotation (Otto, 2008). Typically delivered in one or two arcs of 360° or less, VMAT holds certain advantages over step-and-shoot IMRT. For example, VMAT has been shown to produce dose distributions similar to (or better than) those in IMRT in appreciably shorter treatment times and with fewer monitor units (Palma et al., 2008; Wolff et al., 2009; Zhang et al., 2010). However, the higher achievable conformalities inherent in treatment modalities like IMRT and VMAT result in lower tolerances relative to conventional radiation therapy for delivery errors due to organ motion and/or patient misalignment, which can lead to significant differences between planned and actual delivery of radiation (Landoni et al., 2006). Real-time, in vivo monitoring of the actual dose delivered to an organ at risk could greatly enhance the practice of IMRT and VMAT for prostate treatment through direct verification of planned dose deliveries. A record of direct, real-time dose measurement over the course of one or a series of fractions could greatly improve treatment plan development and execution. Moreover, such a dosimetry system could also trigger safeguards if unexpected dose values are registered, e.g., because of patient movement or positioning errors.
In vivo radiation dosimetry can be implemented in conjunction with the use of an inflatable endorectal balloon. The balloon functions as a prostate immobilizer and also provides distension of the posterior wall of the radiosensitive rectum away from radiation treatment fields (D'Amico et al., 2001; Patel et al., 2003; Smeenk et al., 2009). An endorectal balloon fitted with one or multiple radiation detectors could allow for in vivo dosimetry of the rectal wall during a radiotherapy procedure without additional invasiveness and possibly with very little or no added setup time for the patient.
Over the last few decades, a wide variety of detector types have been investigated for in vivo dosimetry, including metal oxide semiconductor field-effect transistors (MOSFETs) (Briere et al., 2005; Halvorsen, 2005; Hardcastle et al., 2008; Hughes et al., 1988), diamond detectors (Lambert et al., 2007; Nam et al., 1987; Vatnitsky and Jarvinen, 1993), optically stimulated luminescence detectors (Andersen et al., 2009; Gaza et al., 2004; Klein et al., 2010; Magne et al., 2009), and plastic scintillators (Archambault et al., 2010; Beierholm et al., 2011). However, the incorporation of a real-time radiation dosimetry system into an endorectal balloon has only recently come under investigation. Hardcastle et al. reported promising results using an experimental dual MOSFET dosimeter that was embedded in an air-filled endorectal balloon and used to monitor the dose delivered using 3D-conformal radiotherapy and IMRT plans to a modified IMRT phantom (Hardcastle et al., 2010). Archambault et al. also performed preliminary testing on the combination of an array of five plastic scintillation detectors (PSDs) with endorectal balloons, and their results showed PSDs to be highly precise and highly accurate real-time, in vivo radiation detectors (Archambault et al., 2010). PSDs have several advantages over other types of detectors in that they are water-equivalent and their response to radiation is independent of temperature, dose, and dose rate and energy independent in the therapeutic range (Archambault et al., 2007; Beddar et al., 1992b, 1992c; Clift et al., 2000; Fontbonne et al., 2002).
The present work constitutes a continuation of the work of Archambault et al. (2010), which thoroughly characterized a PSD dosimetry system and assessed its performance under reference conditions and reported preliminary results of using the system under IMRT treatment conditions in a deformable prostate phantom. Here we report the findings of testing a single-PSD system with both IMRT and VMAT modalities under patient-specific quality assurance (QA) conditions and under treatment conditions using a deformable anthropomorphic prostate phantom. This work started with an examination of the effects of using various combinations of conditions to calibrate the PSD dosimetry system. The PSD system was used to measure scintillation signals delivered during standard patient QA procedures using clinical IMRT and VMAT plans, and the results were compared with those obtained under identical conditions using a standard ionization chamber. Finally, the PSD was combined with an endorectal balloon, inserted into an anthropomorphic pelvic phantom, and used to measure scintillation signals during simulated prostate radiotherapy treatment fractions. Additionally, a positioning error was introduced to test the PSD’s ability to accurately reflect such an error. Dose values obtained using the PSD in the prostate phantom were compared to dose calculations from the clinical treatment planning system (TPS) used to produce the treatment plan. These experiments were designed to provide further validation of a PSD dosimetry system for real-time use in a clinical setting.
2. Materials and methods
2.1. PSD dosimetry system
The scintillation dosimetry system used for this study comprises a single PSD featuring a BCF-60 green-emitting plastic scintillating fiber 1 mm in diameter and 2 mm in length (Saint-Gobain Crystals, Hiram, OH) attached to the distal end of an SH4001 ESKA fiber-optic cable 12 m in length with a core diameter of 1 mm (Mitsubishi Rayon Co., Ltd., Tokyo, Japan); an optical system containing one dichroic mirror (NT47-950; Edmund Optics Inc., Barrington, NJ) and three aluminized mirrors (cut from a single NT48-453 mirror; Edmund Optics Inc.); and a Luca-S electron-multiplying charge-coupled device camera (Andor Technology, Belfast, N. Ireland). For these measurements, electron multiplication was not applied because signal intensity was sufficient.
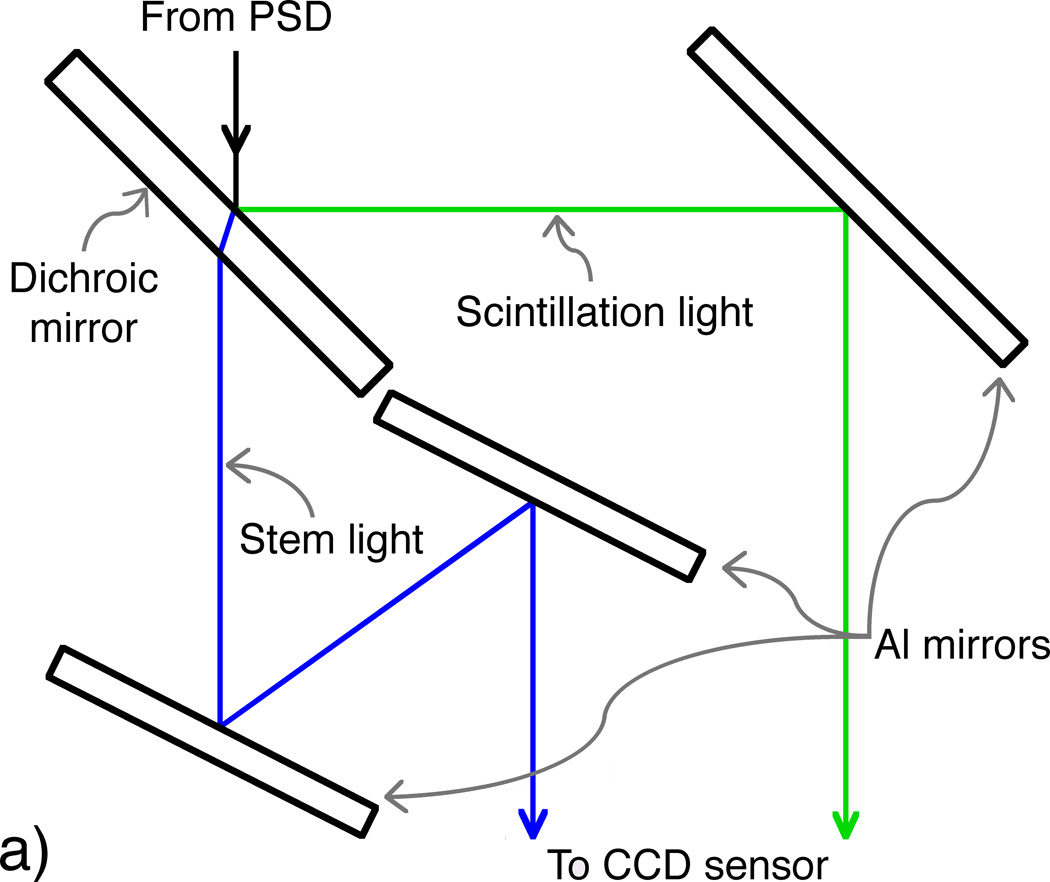
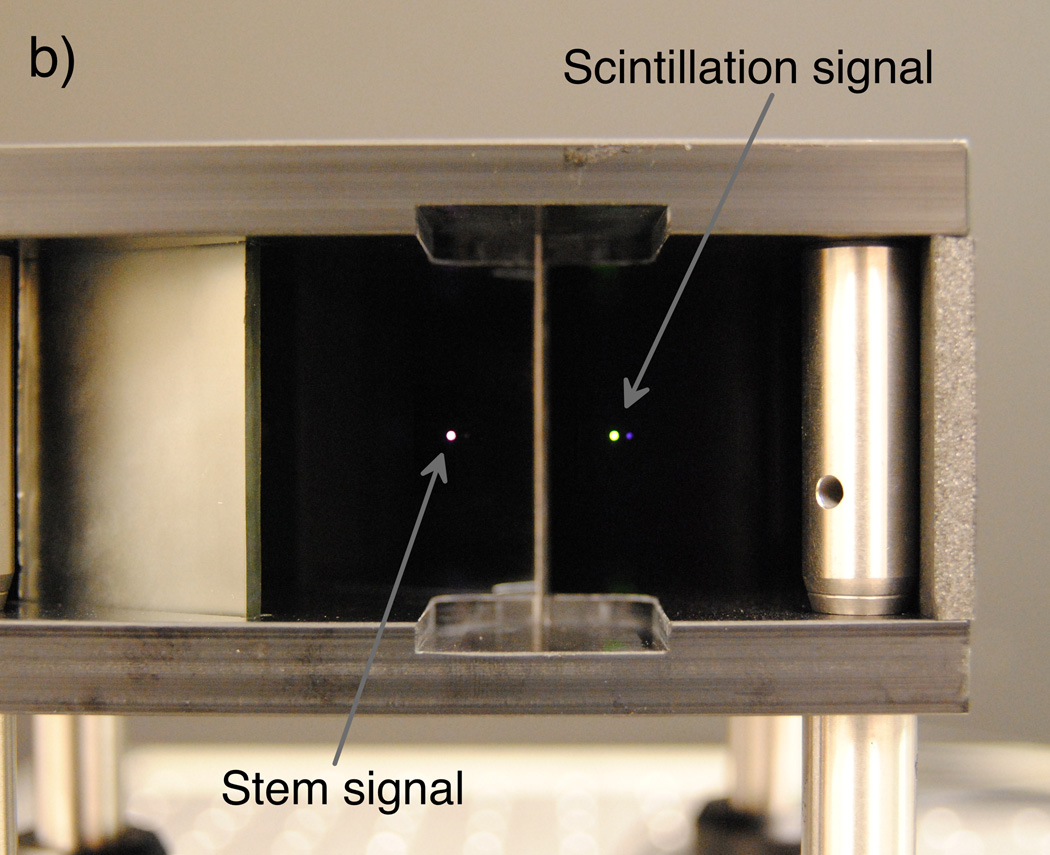
The optical system accepts the output of the proximal end of the PSD as input and produces a double image of the PSD output, which is captured by the camera. The system was designed and optimized specifically for the implementation of the chromatic removal technique (Archambault et al., 2006; Fontbonne et al., 2002; Frelin et al., 2005), which allows the subtraction of unwanted “stem” signal (primarily Cerenkov radiation (Beddar et al., 1992a)) produced in the BCF-60 and ESKA fiber-optic cable during irradiation to obtain the desired scintillation signal. The dichroic mirror was chosen so that the 510–570 nm wavelength band, which contains the majority of scintillation light, would be reflected while the rest of the light output would be transmitted. The reflected and transmitted bands would then be reflected via the aluminized mirrors onto the camera’s sensor. The orientations of the aluminized mirrors were calculated so that 1) the propagation path lengths of the two bands would be equal, ensuring equal focus through the objective lens; 2) the reflected and transmitted rays would have an appropriate spatial separation to eliminate signal cross-talk; and 3) the path lengths would be minimized to reduce light lost in proportion to the inverse square of the path length. Figure 1 shows a schematic diagram and photograph of the compact (12.5 × 10 × 6 cm3) mirror assembly.
Figure 1.
(Left) Diagram depicting an overhead view of the optical system, in which the incoming light from the PSD is split into beams of scintillation (reflected ray) and stem (refracted and transmitted ray) light by the dichroic mirror. The optimized design allows for minimal yet equal path lengths between the PSD output and the objective lens attached to the camera. (Right) A photograph of simulated PSD output (room light through a fiber-optic cable) taken through the mirror setup prior to installation of the camera and light tightening.
2.2. PSD calibration procedure
The chromatic removal technique requires that the PSD output be characterized under a minimum of two conditions which produce significantly different ratios of scintillation light to Cerenkov light (Fontbonne et al., 2002). Typically, these conditions are met by irradiating the PSD using two different field sizes: a small field centered on the scintillating element that excites only a small portion of the fiber-optic cable and a large field that delivers a similar dose to the scintillator but also impinges on much more of the fiber-optic cable than the smaller field. The PSD measurements resulting from these different conditions are then compared to measurements made under identical conditions using a calibrated detector—in our case, an ionization chamber—and calibration factors are obtained that allow Cerenkov light to be subtracted from the PSD signal. The following matrix equation describes the linear relation between PSD-measured signals and dose measurements:
| (1) |
Here, for 1 ≤ i ≤ N, SS,i represent the scintillation signals; SC,i are the stem signals, which contain mostly Cerenkov light; a and b are the sought-after calibration factors; and Di are the dose values measured using the ionization chamber under the same irradiation conditions as the PSD. Once a and b are determined, then any other measured values of SS and SC can be converted to a corresponding dose value D by solving Eq. (1) for N = 1. Clearly, Eq. (1) can be solved with N = 2 only. However, we solved for a and b using 2 ≤ N ≤ 8 conditions via a pseudo-inverse approach to investigate whether using more than two calibration conditions would improve the PSD’s dose accuracy.
All calibration measurements were performed using the 60Co source of a Theratron 780-C (MDS Nordion, Ontario, Canada). We verified the absorbed dose to water delivered by the 60Co beam using a TN30013 Farmer-type ionization chamber (PTW, Freiburg, Germany) and a Model 206 electrometer (CNMC Company, Inc., Nashville, TN) under reference conditions following the protocol developed by Task Group 51 (TG-51) of the American Association of Physicists in Medicine (Almond et al., 1999). PSD measurements were made under each of eight possible conditions corresponding to delivered doses of 10 and 50 cGy and field sizes of 5 × 5 cm2, 10 × 10 cm2, 20 × 20 cm2, and 30 × 30 cm2 at a depth of 2 cm in water in a Blue Phantom (Scanditronix-Wellhöfer, Uppsala, Sweden). The PSD was irradiated with the plastic scintillating fiber centered in the 60Co beam. Each measurement consisted of integrating the two signals from the PSD using camera exposure times long enough to encompass the entire irradiation period (i.e., integral dose measurement). Sixteen exposures were taken under each calibration condition: 8 signal exposures in immediate succession under constant irradiation and 8 dark exposures (with beam off) for background subtraction. After background subtraction, the signal images were run through a nearest-neighbor median filter to reduce any transient noise effects (Archambault et al., 2008). Signal-specific regions of interest that maximized the signal-to-noise ratio were determined via the region of interest size versus signal-to-noise ratio method described by Klein et al. (2011). The final, dose-proportional scintillation and stem values were defined as the mean of the eight signal integrations over these regions of interest.
With PSD measurements taken under eight different conditions, we had 247 combinations of two or more (up to all eight) of these conditions to use to solve for the calibration factors (a and b) using Eq. (1). In order to test the dependence, if any, of calibration accuracy on calibration conditions, all sets of calibration factors were applied to the PSD measurements obtained during the IMRT QA and VMAT QA delivery experiments and these results were compared to ionization chamber measurements. Because of the non-normal distribution of the calibration results, the calibration factors that produced the mean total accumulated dose that most closely matched the mean dose measured by the ionization chamber under IMRT QA conditions were chosen for calculating the doses from PSD measurements made using the pelvic phantom. Measurement uncertainties are given as the coefficient of variation represented by a percentage.
2.3. Treatment plans and delivery
The IMRT and VMAT plans used in this study were created using Pinnacle3 (Philips Medical Systems, Best, The Netherlands) and Eclipse (Varian Medical Systems, Palo Alto, CA) TPSs, respectively. Both plans were originally developed for the same patient undergoing radiotherapy of the prostate. Specific details related to the plans are given in Table 1. A Clinac iX linear accelerator (Varian Medical Systems) with RapidArc capability delivered all of the IMRT and VMAT fractions. An additional plan was created for each modality that used a beam isocenter that had been shifted 1 cm anterior to the original isocenter to simulate a patient positioning error that would result in incorrect dose delivery and an incorrect PSD reading.
Table 1.
Specific details of the IMRT and VMAT treatment plans for each 200-cGy fraction. (Beam energy is given in megavolts (MV) following the conventions of radiotherapy. For these experiments, one monitor unit represents the amount of beam needed to deliver an absorbed dose of 0.01 Gy to a point at the depth of dose maximum in muscle.)
| Modality | Delivery configuration |
Monitor units per fraction |
Approximate total treatment time (s) |
|---|---|---|---|
| IMRT | (beam angle : energy) | 694 | 300 |
| 225° : 6 MV | |||
| 260° : 18 MV | |||
| 295° : 6 MV | |||
| 330° : 6 MV | |||
| 30° : 6 MV | |||
| 65° : 6 MV | |||
| 100° : 18 MV | |||
| 135° : 6 MV | |||
| VMAT | (arc rotation : energy) | 180 | |
| 225° – 135° : 6 MV | 551 | ||
| 135° – 225° : 6 MV | 577 |
2.4. IMRT and VMAT QA measurements
The IMRT and VMAT QA measurements were performed using an I’mRT modular QA phantom (IBA Dosimetry, Bartlett, TN) made of water-equivalent RW3 material that included an insert with a hollow bore for precise placement of a model CC04 ionization chamber (Scanditronix-Wellhöfer). A custom insert was made of Solid Water (Gammex, Inc., Middleton, WI) with the same outer dimensions as the RW3 ionization chamber insert but with a hole bored along the central long axis to accommodate the PSD. The PSD and custom insert were positioned such that the geometric center of the sensitive volume coincided with the point of measurement of the ionization chamber. First, accumulated dose measurements in the QA phantom were made using the ionization chamber for each individual beam over the course of three deliveries of the IMRT treatment plan, and for each arc over the course of three deliveries of the VMAT treatment plan. Then, the ionization chamber was removed from the phantom and the solid water insert with the PSD was installed to continuously measure the scintillation signal at 1 Hz during administration of the three deliveries of both the IMRT and VMAT plans. All ionization chamber dose values are given as the mean (±1 standard deviation) of 3 cumulative measurements. With the exception of the PSD data given in Table 2 (see section 3.1 for details), all PSD dose values are given as the mean (±1 standard deviation) of a set of 30 data points comprising the last 10 data points from each of the 3 IMRT or VMAT deliveries.
Table 2.
Beam-by-beam and arc-by-arc dose measurement data obtained using the ionization chamber and PSD for the IMRT QA and VMAT QA experiments. Ionization chamber (IC) results are given are given as the mean measurement plus or minus one standard deviation (µ ± σ). PSD results are given as follows: minimum (min); mean plus or minus one standard deviation; median (µ1/2); and maximum (max). Total accumulated values are also given in bold.
| Modality | Beam/Arc | IC Dose (cGy) | PSD Dose (cGy) |
|||
|---|---|---|---|---|---|---|
| (µ ± σ) | (min) | (µ ± σ) | (µ1/2) | (max) | ||
| IMRT | 1 | 29.27 ± 0.13 | 26.0 | 29.2 ± 1.4 | 29.0 | 43.7 |
| 2 | 34.58 ± 0.13 | 20.3 | 33.3 ± 1.0 | 33.2 | 41.3 | |
| 3 | 18.61 ± 0.05 | 14.7 | 17.9 ± 0.6 | 17.9 | 25.7 | |
| 4 | 24.53 ± 0.08 | 21.0 | 23.7 ± 0.9 | 23.7 | 35.4 | |
| 5 | 26.90 ± 0.17 | 24.5 | 27.0 ± 1.1 | 26.8 | 40.8 | |
| 6 | 21.34 ± 0.05 | 18.3 | 21.4 ± 0.8 | 21.3 | 31.3 | |
| 7 | 42.48 ± 0.10 | 32.0 | 42.7 ± 1.3 | 42.6 | 58.4 | |
| 8 | 26.49 ± 0.05 | 23.6 | 26.4 ± 1.0 | 26.3 | 39.6 | |
| Total | 224.20 ± 0.64 | 180.4 | 221.5 ± 7.5 | 221.1 | 316.2 | |
| VMAT | 1 | 128.14 ± 0.27 | 120.9 | 131.8 ± 5.4 | 131.1 | 200.6 |
| 2 | 99.29 ± 0.17 | 72.2 | 90.2 ± 3.0 | 90.1 | 127.6 | |
| Total | 227.43 ± 0.17 | 193.1 | 222.0 ± 8.3 | 221.2 | 328.2 | |
2.5. Simulated IMRT and VMAT treatment measurements
A pelvic phantom (Computerized Imaging Reference Systems, Inc., Norfolk, VA) was chosen for the simulated treatment deliveries. This anthropomorphic phantom was designed to portray the organs of interest (including synthetic reproductions of the prostate, seminal vesicles, bladder, rectum, and bones) in a realistic fashion in computed tomography (CT) and ultrasonography images. As most of the internal material is designed to mimic soft tissue, the phantom is readily deformable and therefore susceptible to motion.
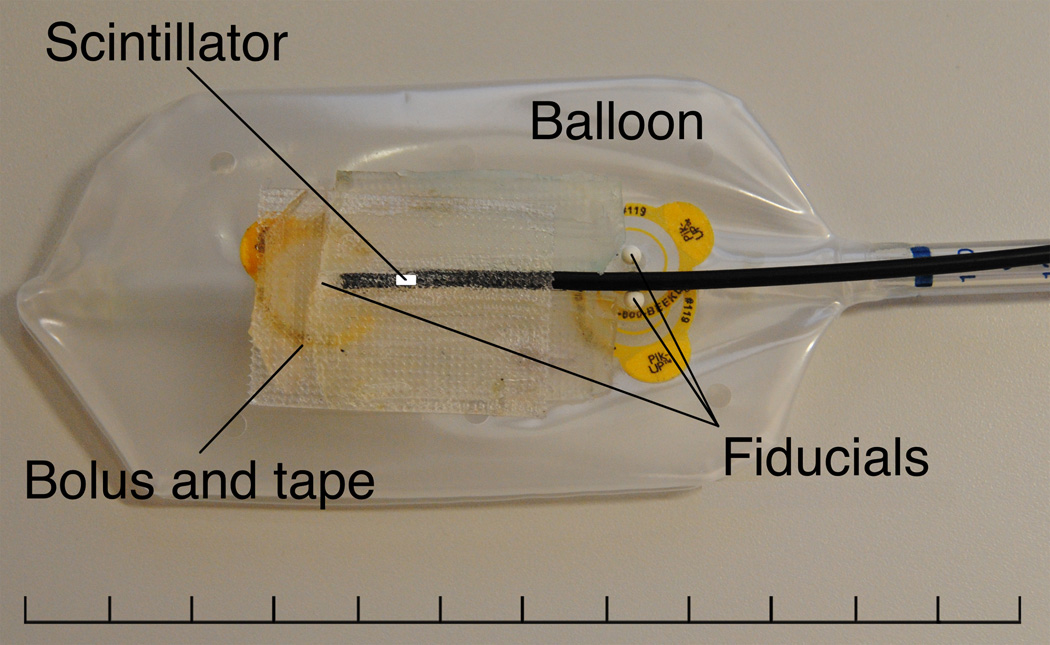
Figure 2 shows the commercial endorectal balloon (Radiadyne, LLC, Houston, TX) modified to accommodate the single PSD in the configuration used for our simulated treatment measurements. Three ceramic fiducial markers were added to the PSD-enhanced endorectal balloon (henceforth called the “detector balloon”) to allow the location of the water-equivalent scintillating fiber to be precisely located on CT scans. One fiducial marker was placed 1 cm superior to and in line with the scintillating fiber, with a spacer of fiber-optic cable placed between the fiducial marker and the tip of the PSD, and two fiducial markers were placed 3 cm inferior to the detector volume, on opposite sides of and adjacent to the fiber-optic cable. Because the simulated rectum in the phantom was unrealistically circular, small strips of buildup bolus material were placed adjacent to the PSD’s tip to minimize the presence of air pockets near the detector volume. These bolus strips would not be needed for a real patient.
Figure 2.
Partially inflated endorectal balloon with a single PSD attached. Three fiducial markers were placed on the balloon to aid in the proper positioning of the PSD during inflation after insertion and to provide landmarks by which the position of the water-equivalent scintillating fiber could be verified in CT images. A 1-cm length of fiber-optic cable was placed between the tip of the PSD and the superior-most fiducial marker to prevent dose perturbation effects on PSD measurement due to the fiducial marker. Additionally, small strips of bolus material were placed adjacent to the PSD tip in an effort to reduce the effects of air pockets near the detector volume.
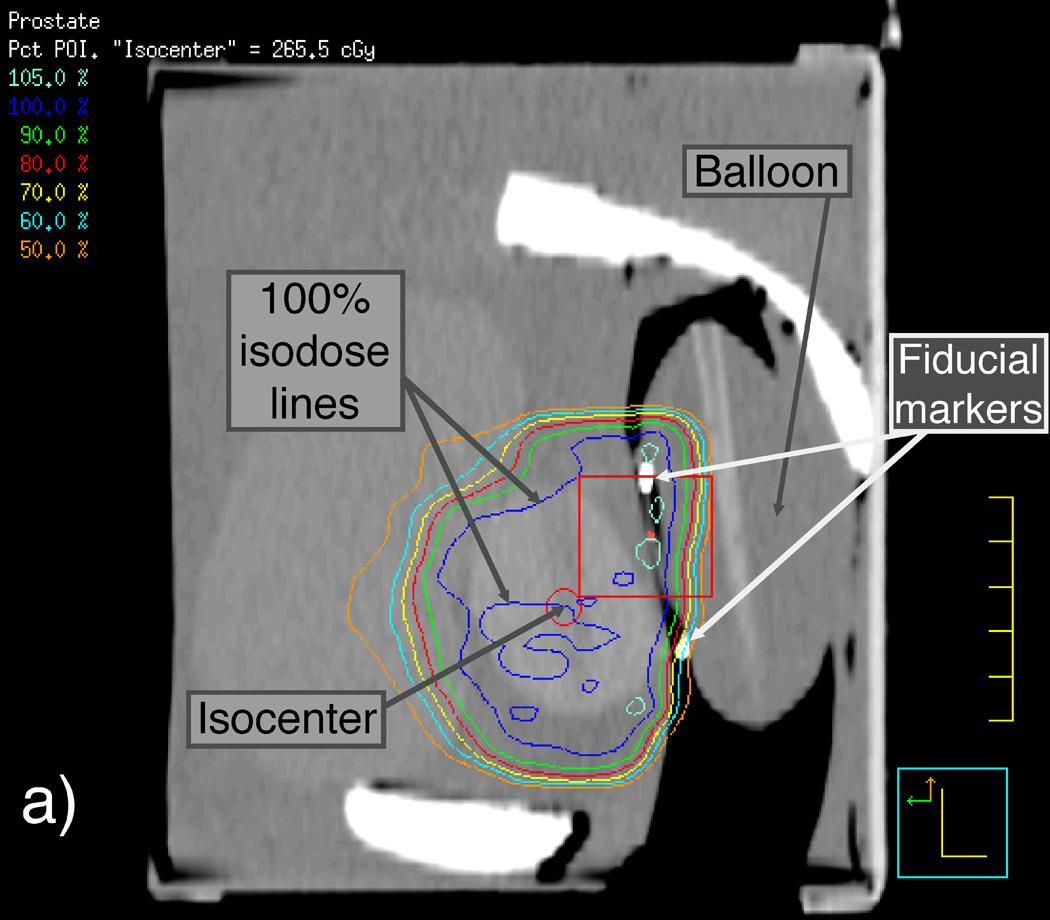
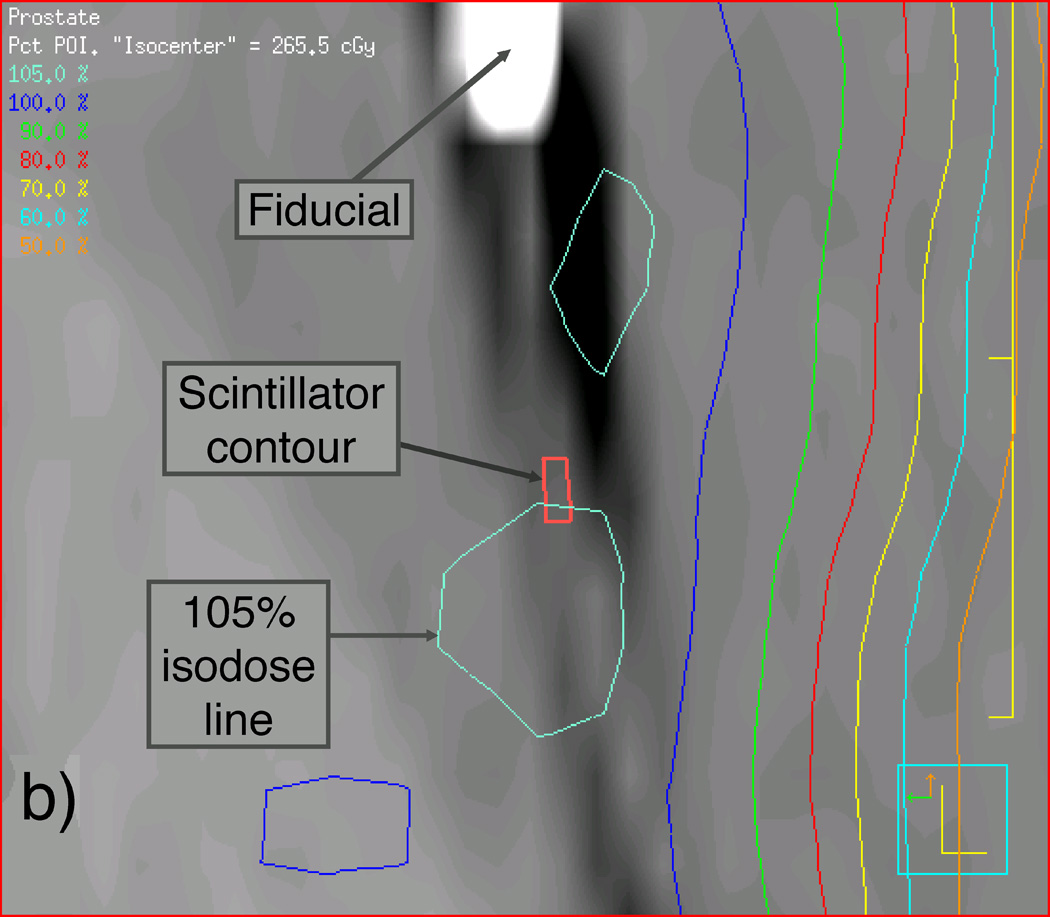
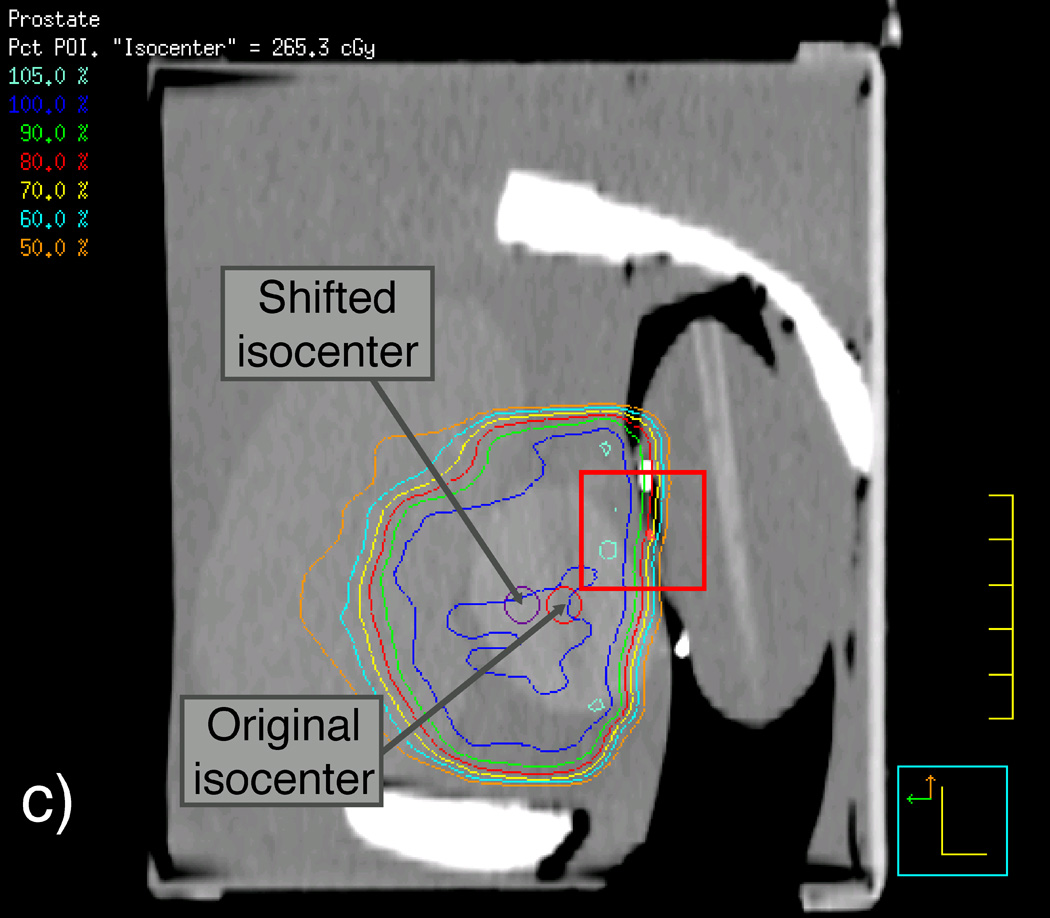
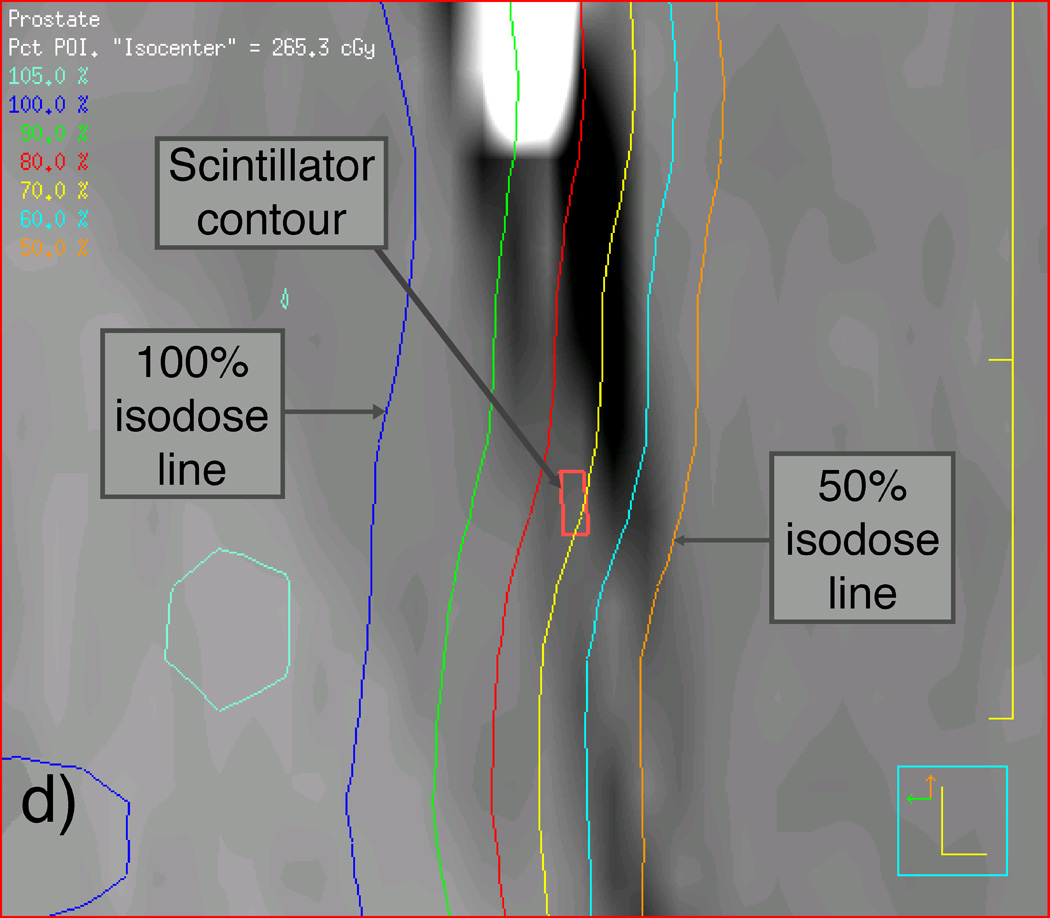
We first scanned the phantom and the detector balloon, as they would be assembled during the IMRT and VMAT measurements using CT, with the detector balloon inserted and filled with 100 ml of water. We then used this CT scan to apply the patient beam data to the prostate phantom such that the beam isocenter was placed at the center of the synthetic prostate. Another CT scan was performed on the phantom-detector balloon assembly immediately before the actual delivery of the IMRT and VMAT beams for later verification of the scintillating fiber’s position so that accurate dose calculations could be made using the TPS software. Figure 3 shows sagittal reconstructions of this second set of CT scans of the prostate phantom containing the detector balloon and isodose curves resulting from the Pinnacle3 TPS for both the original and shifted isocenters used for the IMRT deliveries. Magnified views of the contents outlined by rectangles in Figures 3(a) and 3(c) are shown in Figures 3(b) and 3(d) to better reveal the location of the scintillating fiber and its immediate surroundings.
Figure 3.
Labeled sagittal CT reconstructions of the deformable phantom with the water-filled detector balloon inserted. (a) View of the whole phantom showing isodose lines of the IMRT plan with the isocenter approximately centered in the synthetic prostate. (b) Zoomed-in view of CT reconstruction (including detector contour and isodose lines) contained within the rectangle shown near the center of (a). (c) View similar to that shown in (a), but with the IMRT plan focused on an isocenter shifted 1 cm anterior to the original isocenter. (d) Zoomed-in view of contents of the rectangle shown in (c), showing the detector contour lying within the dose gradient of the IMRT plan.
3. Results
3.1. Calibration and QA phantom results
The absorbed dose to water measured with the ionization chamber obtained by following the TG-51 protocol closely matched the hand-calculated 60Co dose with all results differing by less than 0.1%. The PSD calibration measurement uncertainty, given here as the coefficient of variation, ranged from 0.1% to 0.3% with a mean of 0.2% when 50-cGy doses were used and from 0.4% to 1.2% with a mean of 0.7% when 10-cGy doses were used. Per-beam and per-arc ionization chamber measurement uncertainty ranged from 0.2–0.6%, with a mean uncertainty of 0.3%. Similarly, uncertainty in the raw PSD measurements (i.e. measuring scintillation counts) of the IMRT and VMAT plans ranged from 0.2% to 1.0%, with a mean of 0.5%.
The mean total accumulated doses (± 1 standard deviation) measured by the ionization chamber over the three IMRT QA and VMAT QA deliveries were equal to 224.2 (± 0.6) cGy and 227.4 (± 0.2) cGy, respectively. The mean total accumulated doses for the PSD (after applying all of the 247 sets of calibration factors to the mean of the three measurements of both the IMRT and the VMAT plans) were 221.5 (± 7.5) cGy and 222.0 (± 8.3) cGy. The measured dose values for each intermediate beam/arc for both detectors are given in Table 2. It is important to note here that the mean and standard deviation values given for the ionization chamber are calculated from 3 repeated measurements, while the mean and standard deviation values given for the PSD are calculated from the 247 different dose values obtained by applying all sets of calibration factors to the mean of three measurements of IMRT QA or VMAT QA deliveries.
Figure 4 shows accumulated PSD dose curves measured over the course of the IMRT or VMAT plan delivery in relation to the mean accumulated doses measured by the ionization chamber after each subsequent beam or arc. The accumulating plots given in Figure 4[a] and Figure 4[c] represent the mean, median, minimum, and maximum of the 247 different dose curves generated from all of the sets of calibration factors. Figure 4[b] gives a magnified view of the last 15 seconds of IMRT QA data and includes the 10th and 90th percentiles of the calibration results. Also provided in Figure 4 are the calibrated dose curves that best matched the ionization chamber dose measurements of the two plans. As seen in Figure 4[b], the majority of calibrations under-responded with respect to the ionization chamber. However, even though the minimum and maximum calibration results differed by 21.7% and 34.0%, respectively, the mean result differed by only 1.2% and the median differed by 1.4%. The 10th percentile differed by 1.9% and the 90th percentile differed by 0.9%, showing that at least 80% of all of the calibration factor sets produced doses that were accurate to within 2% of the ionization chamber.
Figure 4.
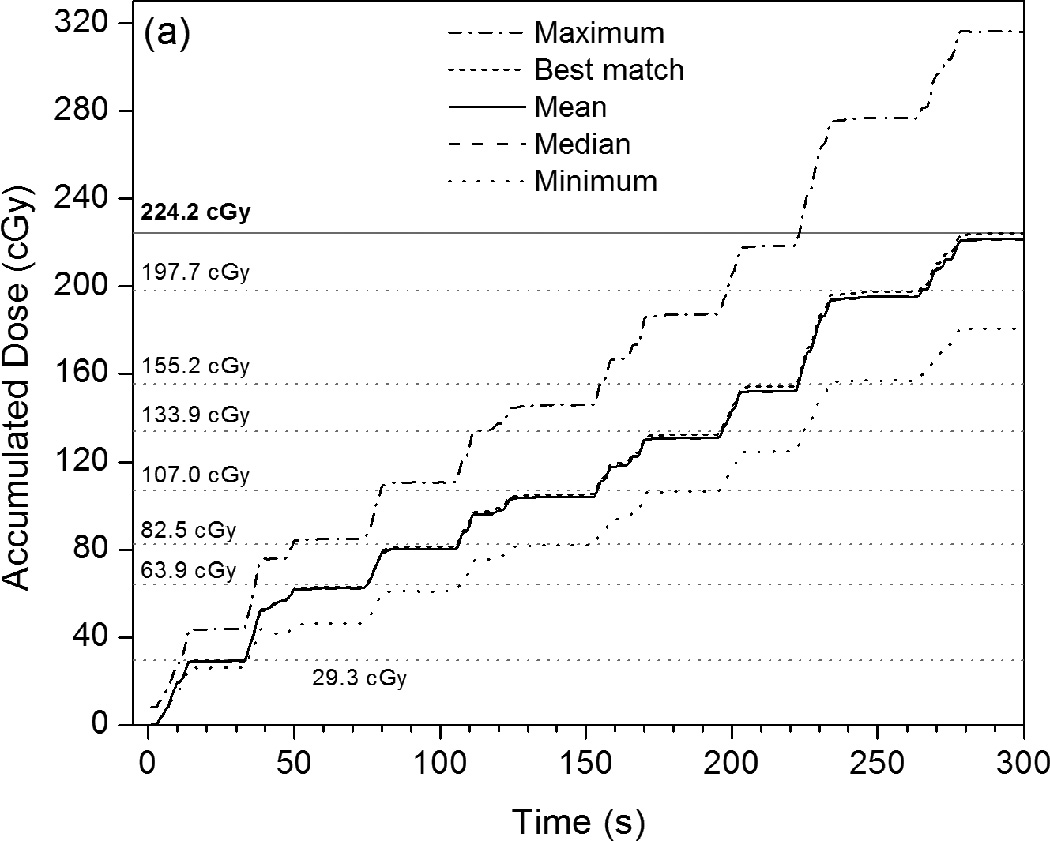
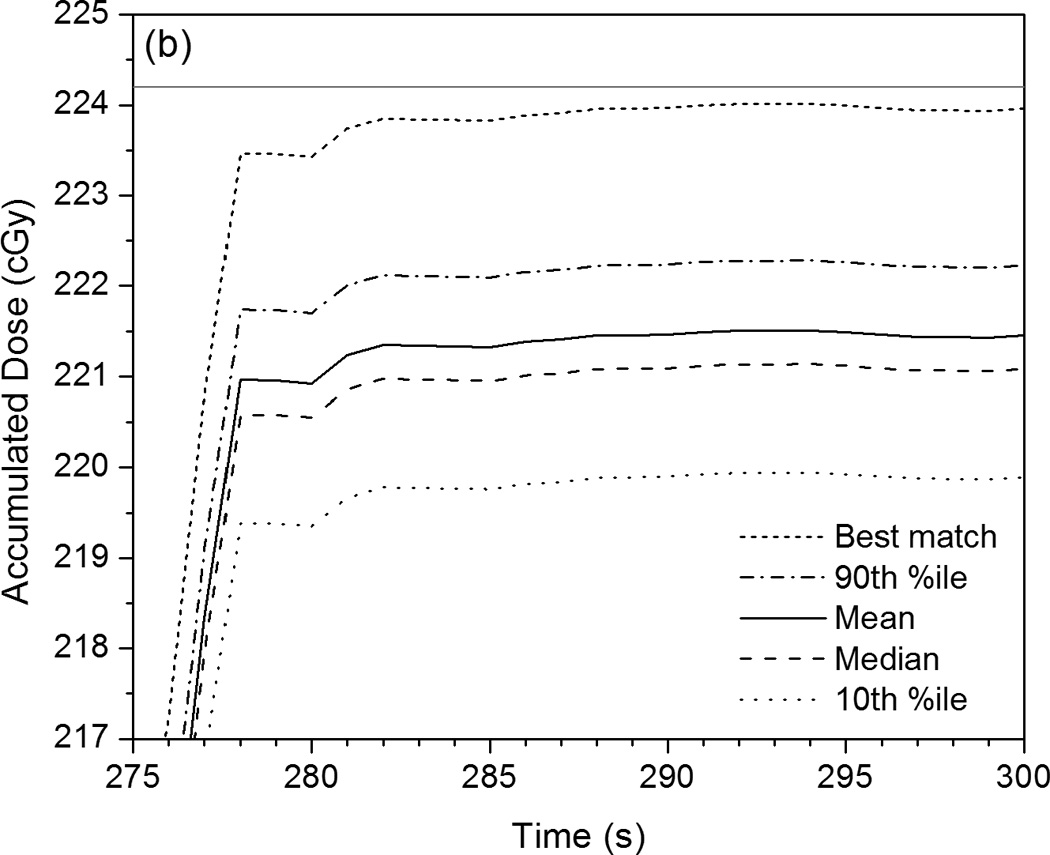
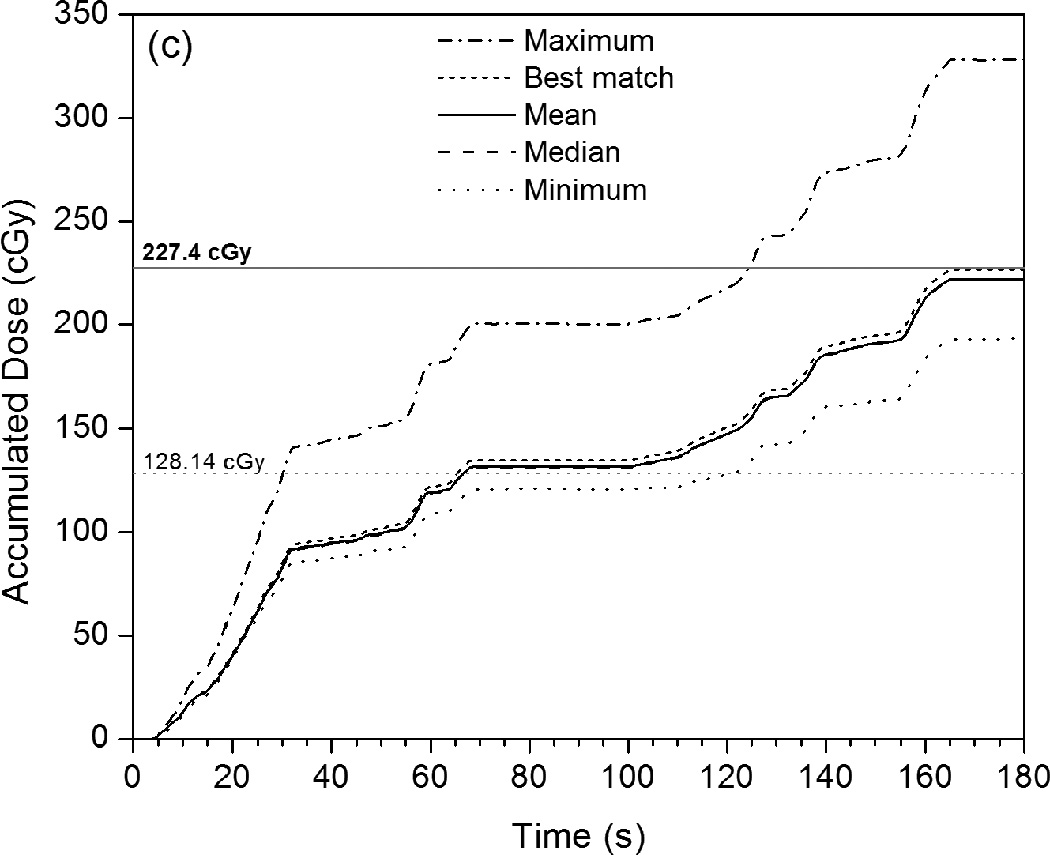
Plots of accumulated dose versus time as measured by the PSD system with various calibration factors applied. These are compared with the mean dose values measured by the ionization chamber for each intermediate beam or arc (given as horizontal gray dotted lines), as well as the mean total accumulated dose (horizontal gray solid lines). (a) This PSD data, taken under IMRT QA conditions, shows the maximum, mean, median, and minimum calibrated values, as well as the calibrated PSD dose curve that best matches the ionization chamber data. (b) Rescaling of (a) that shows the close proximity of the 10th and 90th percentiles to the mean, median, and best-matched PSD calibration and to the mean total accumulated dose as measured by the ionization chamber. (c) PSD data taken under VMAT QA conditions in identical fashion as that shown in (a).
The closest matching calibrated PSD value was 224.0 (± 0.6) cGy, or 0.1% different from the dose measured by the ionization chamber. This PSD value was calculated using a and b factors resulting from two calibration conditions: 20 × 20 cm2 and 30 × 30 cm2, both with 10-cGy doses. These values of a and b were therefore selected for all other calculations of PSD signal to dose (see discussion below). We note that a total of 5 sets of calibration conditions resulted in PSD doses that matched the ionization chamber dose equal to or less than 0.5% (see Table 3), and that 28 sets of conditions resulted in matches within 1.0%.
Table 3.
Calibration condition sets that produced PSD dose measurements that were ≤0.5% different than those measured using the ionization chamber under identical (IMRT QA) conditions. The calibration factors used to calculate PSD doses under treatment conditions using the pelvic phantom were produced using the calibration conditions highlighted by the gray box.
| Calibration factor set number |
Field sizes (cm2) |
Doses used per field size (cGy) |
Percent difference from IC dose |
|---|---|---|---|
| 2 | 5 | 10 | 0.3% |
| 10 | 10 | ||
| 24 | 20 | 10 | 0.1% |
| 30 | 10 | ||
| 29 | 5 | 10 | 0.3% |
| 5 | 50 | ||
| 10 | 10 | ||
| 71 | 10 | 10 | 0.5% |
| 20 | 10 | ||
| 30 | 50 | ||
| 148 | 10 | 10 | 0.5% |
| 20 | 10 | ||
| 30 | 10 | ||
| 30 | 50 | ||
3.2. IMRT and VMAT treatment delivery results obtained using the deformable phantom
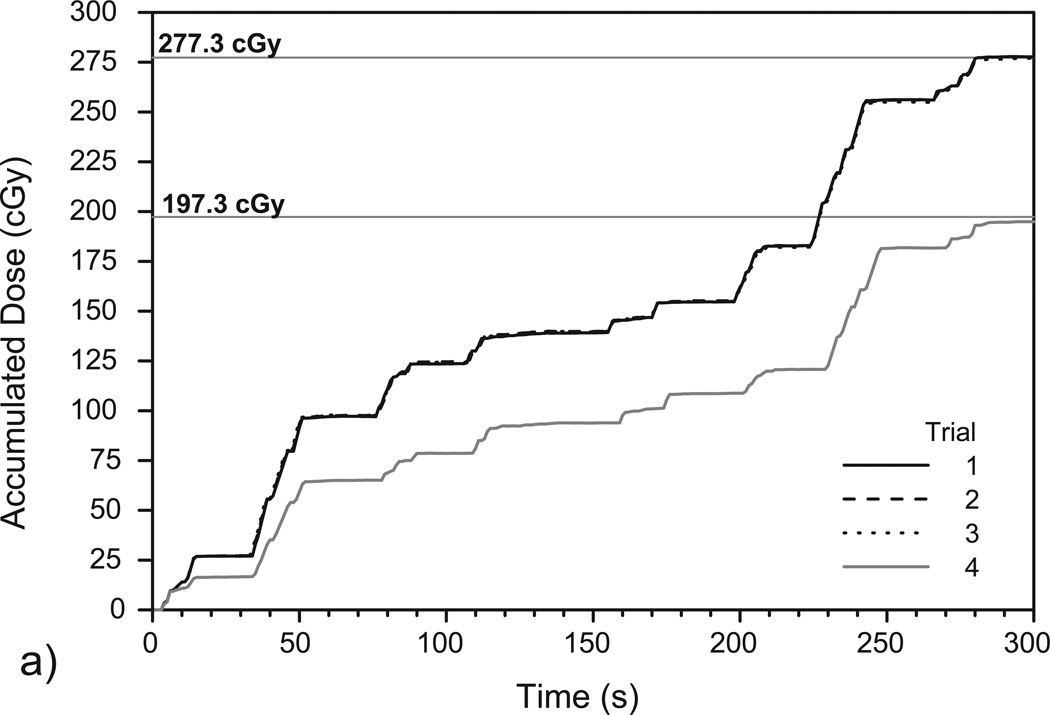
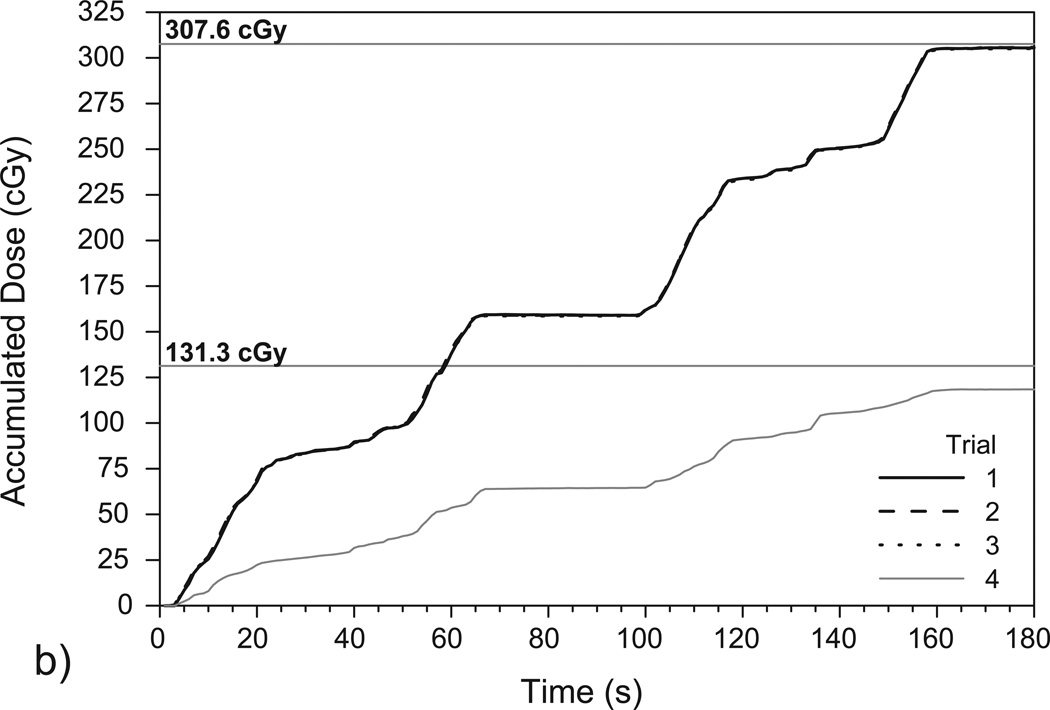
Figure 5 shows the accumulated dose as measured by the PSD in the prostate phantom and corresponding TPS calculations of the total dose delivered to the PSD. Again, the results show that the PSD system can measure dose accumulation over time in a very reproducible manner.
Figure 5.
Plots of accumulated dose as measured over time by the PSD system over (a) four IMRT deliveries and (b) four VMAT deliveries to the deformable phantom. Trials 1–3 were performed using the original isocenter (see Figures 3a and 3b) while trial 4 was performed using the shifted isocenter (see Figures 3c and 3d). The high reproducibility of the measurements in trials 1-3 resulted in plots that closely overlap. The mean doses delivered to the PSD for each isocenter position, as calculated using TPS software in (a) and (b), are denoted with horizontal lines.
The first three trials shown in Figure 5(a) are associated with the IMRT fractions set up to the original isocenter and gave a mean total accumulated dose of 277.5 ± 0.4 cGy. The corresponding TPS dose calculation yielded a minimum dose of 276.0 cGy, a maximum dose of 278.8 cGy, and a mean dose of 277.3 ± 1.0 cGy. The difference between the mean PSD-measured dose and the mean TPS-calculated dose was 0.1%. For the single measurement using the shifted isocenter (see Figure 3[c]), the PSD measured 195.0 cGy while the TPS calculated a minimum dose of 183.8 cGy, a maximum dose of 213.4 cGy, and a mean dose of 197.3 ± 11.4 cGy. The difference between the PSD–measured dose and the mean TPS-calculated dose with the shifted isocenter was 1.2%.
Figure 5(b) shows the results of the VMAT deliveries to the prostate phantom, and trials 1–3 gave a mean total accumulated dose of 305.5 ± 0.3 cGy. The corresponding TPS calculation yielded a minimum dose of 305.6 cGy, a maximum of 310.2 cGy, and a mean of 307.6 cGy. The difference in this case between the mean PSD-measured dose and the mean TPS-calculated dose was 0.7%. The PSD measured 118.7 cGy after the VMAT isocenter was shifted while the TPS calculated a minimum dose of 112.7 cGy, a maximum dose of 167.8 cGy, a mean dose of 131.3 ± 11.4 cGy. Here, the mean PSD-measured dose and mean TPS-calculated dose differed by 10.1%.
4. Discussion
Our measurement uncertainties under calibration conditions are similar to those obtained previously with a PSD system: in their examination of the effects of dose level on in vivo PSD measurement reproducibility, Archambault et al. (2010) were able to achieve uncertainties of 0.4%, 1.0%, and 2.3% using doses of 200 cGy, 20 cGy, and 2 cGy, respectively. Our observations suggest that the chromatic removal technique is fairly robust with respect to the choice of which calibration conditions to use. At least 80% of the 247 different condition sets that were used produced calibration factors that matched the PSD to an ionization chamber, in identical geometries, to within 2%. The results of the calibration experiments suggest that increasing the number of calibration conditions does not appear to significantly enhance the accuracy of the final calibration factors. Two of the five best-performing sets of calibration conditions (i.e., those that resulted in dose matches of 0.5% or less) consisted of just two conditions, two sets consisted of only three conditions, and one set consisted of four conditions. As is seen in Table 3, the most accurate calibration factors came from a two-condition calibration. Another point of interest is that the majority (11 of 14) of the conditions that produced the best-performing calibration factors used 10 cGy doses, which suffered from a higher measurement uncertainty than the 50 cGy doses. However, it is unclear at present as to whether the use of lower doses truly benefits the calibration. Other elements, such as the dependence of calibration factors on the Cerenkov radiation component (Guillot et al., 2011), surely play a significant role, and further investigation is needed into the determination of calibration conditions that produce the highest PSD measurement accuracy and lowest uncertainty.
We were also able to verify the accuracy of PSD dose measurements in a deformable prostate phantom under IMRT fields. Archambault et al. (2010) reported an overall agreement of 0.5% between PSD measurements and TPS calculations of the total accumulated doses given over an eight-beam IMRT fraction. In the present study, the PSD measured a mean total accumulated dose to a deformable prostate phantom that differed from the TPS mean dose calculation by only 0.1% when the PSD was located within the ≥100% dose region (Figs. 3[a] and 3[b]) and by only 1.2% (2.3 cGy) in the steep dose gradient region, where the TPS calculated a 29.6-cGy variation across the contoured detector volume (Figs. 3[c] and 3[d]).
Our PSD results compare favorably to in vivo MOSFET dosimetry results previously obtained using external radiotherapy beams. Using the MOSkin detector, Hardcastle et al. (2010) were able to achieve ±2.5% agreement with ionization chamber measurements under calibration conditions in the center of an IMRT QA phantom similar to the one used in our study. Hardcastle et al. (2010) also reported differences of 2.6% and 3.2% between the total accumulated doses measured with their MOSFET detector and the corresponding TPS-calculated doses for simulated 3D-conformal radiotherapy and IMRT treatments, respectively. While no 3D-conformal radiotherapy plans were used in our study, our IMRT plan measurements were all within 1.2% of the TPS-calculated dose, with the accuracy depending on the location of the treatment isocenter. It is important to note that Hardcastle et al. used an endorectal balloon inflated with air (as opposed to water, as in the present study), which they’ve found can lead to an over-prediction of dose by the TPS at the air-phantom interface (Hardcastle et al., 2009).
The PSD was able to produce IMRT dose values that closely matched ionization chamber measurements and TPS calculations. However, for VMAT fields, greater disparity was found between the PSD-measured doses and those obtained using the ionization chamber or TPS. The PSD showed relatively large differences for each VMAT arc under QA conditions, as seen in Figure 4(b) and Table 2, even though it ultimately measured very similar total accumulated doses. Likewise, for the VMAT fields with a shifted isocenter, the PSD measured (with high precision) a total accumulated dose that was ~10% lower than that calculated by the Eclipse TPS. Although several factors are likely to be at least partially responsible for these discrepancies, we believe that high dose gradients and the inherent differences between PSDs and ionization chambers play the most important roles, as discussed below.
VMAT dose distributions can feature much steeper dose gradients than those seen in IMRT. For example, the dose to the phantom decreases from 100% to 50% over the span of approximately 1 cm in Figure 3(d), whereas a similar dose gradient spans only a few millimeters in the VMAT plan. This makes the correct placement of the small PSD contour within the TPS geometry crucial. Any small shift in the contour’s position will greatly affect the calculated dose. Even with the 10% difference between the mean PSD dose and the mean TPS dose value seen in Figure 5(b), the PSD dose still lies well within the dose range calculated by the TPS (n .b. Sec. 3.2). Nevertheless, future implementation of the PSD system as a real-time, in vivo dosimetry system for use in patients would benefit greatly from pretreatment patient imaging (by conventional or cone beam CT) so that the position of the PSD(s) could be precisely contoured prior to fraction delivery.
The large differences between the PSD and ionization chamber measurements seen in the VMAT portion of Table 2 may be attributable to the difference between the detectors’ sensitive volumes, which influence their spatial resolution. The larger volume of the ionization chamber makes it more susceptible to volume averaging effects than the scintillating fiber (Laub and Wong, 2003). This, in combination with the high volumetric modulation of VMAT, could result in the ionization chamber measuring lower doses than the PSD over the delivery of the first arc. Additionally, the larger ionization chamber may have been exposed to portions of beam that completely missed the smaller PSD, which could account for the ionization chamber’s higher relative dose reading for the second arc.
5. Conclusions
This study has shown that a PSD detector can reproducibly and accurately measure the dose from repeated IMRT and VMAT deliveries under QA and treatment conditions. The small size and inert nature of PSDs make them well suited for unobtrusive in vivo measurement—particularly when used in combination with an endorectal balloon, which provides a convenient and useful platform for radiation dosimetry. The PSD system was tested as an alternative to a standard method for the QA of IMRT and VMAT treatment plans and was assessed for its ability to provide real-time measurement during the delivery of these two treatment modalities using a deformable prostate phantom. Our main findings show that the system can measure total accumulated doses that agree with standard ionization chamber measurements and TPS calculations within 1% except when the PSD is in very steep dose gradients; however, even there it can measure accumulated dose values well within the range of doses calculated over the contoured detector volume. The results presented here provide further evidence of the viability and utility of a PSD-based real-time, in vivo dosimetry system for prostate cancer patients undergoing external-beam radiotherapy.
> Plastic scintillating detector (PSD) tested using high dose gradient radiotherapy beams. > Measurements were made in real-time during beam delivery using rigid and deformable phantoms. > PSD-measured doses agreed well with ionization chamber results and treatment planning system. > Findings suggest PSDs are viable candidates for in vivo real-time dosimetry for radiotherapy.
Acknowledgments
The authors thank Pei-Fong Wong, Dr. Milos Vicic, and Michael Kantor for their assistance with the treatment planning systems used for this research. This work was supported in part by the National Cancer Institute through a T32 grant (CA119930-04) and an R01 grant (CA120198-01A2).
Footnotes
Publisher's Disclaimer: This is a PDF file of an unedited manuscript that has been accepted for publication. As a service to our customers we are providing this early version of the manuscript. The manuscript will undergo copyediting, typesetting, and review of the resulting proof before it is published in its final citable form. Please note that during the production process errors may be discovered which could affect the content, and all legal disclaimers that apply to the journal pertain.
References
- Al-Mamgani A, Heemsbergen WD, Peeters STH, Lebesque JV. Role of Intensity-Modulated Radiotherapy in Reducing Toxicity in Dose Escalation for Localized Prostate Cancer. Int J Radiat Oncol Biol Phys. 2009;73:685–691. doi: 10.1016/j.ijrobp.2008.04.063. [DOI] [PubMed] [Google Scholar]
- Almond PR, Biggs PJ, Coursey BM, Hanson WF, Huq MS, Nath R, Rogers DW. AAPM's TG-51 protocol for clinical reference dosimetry of high-energy photon and electron beams. Med Phys. 1999;26:1847–1870. doi: 10.1118/1.598691. [DOI] [PubMed] [Google Scholar]
- Andersen CE, Nielsen SK, Greilich S, Helt-Hansen J, Lindegaard JC, Tanderup K. Characterization of a fiber-coupled Al2O3:C luminescence dosimetry system for online in vivo dose verification during 192Ir brachytherapy. Med Phys. 2009;36:708–718. doi: 10.1118/1.3063006. [DOI] [PubMed] [Google Scholar]
- Archambault L, Beddar AS, Gingras L, Lacroix F, Roy R, Beaulieu L. Water-equivalent dosimeter array for small-field external beam radiotherapy. Med Phys. 2007;34:1583–1592. doi: 10.1118/1.2719363. [DOI] [PubMed] [Google Scholar]
- Archambault L, Beddar AS, Gingras L, Roy R, Beaulieu L. Measurement accuracy and Cerenkov removal for high performance, high spatial resolution scintillation dosimetry. Med Phys. 2006;33:128–135. doi: 10.1118/1.2138010. [DOI] [PubMed] [Google Scholar]
- Archambault L, Briere TM, Beddar S. Transient noise characterization and filtration in CCD cameras exposed to stray radiation from a medical linear accelerator. Med Phys. 2008;35:4342–4351. doi: 10.1118/1.2975147. [DOI] [PMC free article] [PubMed] [Google Scholar]
- Archambault L, Briere TM, Pönisch F, Beaulieu L, Kuban DA, Lee AK, Beddar AS. Toward a true real-time in-vivo dosimetry system using plastic scintillation detectors. Int J Radiat Oncol Biol Phys. 2010;78:280–287. doi: 10.1016/j.ijrobp.2009.11.025. [DOI] [PMC free article] [PubMed] [Google Scholar]
- Beddar AS, Mackie TR, Attix FH. Cerenkov Light Generated in Optical Fibers and Other Light Pipes Irradiated by Electron-Beams. Phys Med Biol. 1992a;37:925–935. [Google Scholar]
- Beddar AS, Mackie TR, Attix FH. Water-equivalent plastic scintillation detectors for high-energy beam dosimetry: I. Physical characteristics and theoretical consideration. Phys Med Biol. 1992b;37:1883–1900. doi: 10.1088/0031-9155/37/10/006. [DOI] [PubMed] [Google Scholar]
- Beddar AS, Mackie TR, Attix FH. Water-equivalent plastic scintillation detectors for high-energy beam dosimetry: II. Properties and measurements. Phys Med Biol. 1992c;37:1901–1913. doi: 10.1088/0031-9155/37/10/007. [DOI] [PubMed] [Google Scholar]
- Beierholm AR, Ottosson RO, Lindvold LR, Behrens CF, Andersen CE. Characterizing a pulse-resolved dosimetry system for complex radiotherapy beams using organic scintillators. Phys Med Biol. 2011;56:3033–3045. doi: 10.1088/0031-9155/56/10/009. [DOI] [PubMed] [Google Scholar]
- Briere TM, Beddar AS, Gillin MT. Evaluation of precalibrated implantable MOSFET radiation dosimeters for megavoltage photon beams. Med Phys. 2005;32:3346–3349. doi: 10.1118/1.2065447. [DOI] [PubMed] [Google Scholar]
- Clift MA, Sutton RA, Webb DV. Water equivalence of plastic organic scintillators in megavoltage radiotherapy bremsstrahlung beams. Phys Med Biol. 2000;45:1885–1895. doi: 10.1088/0031-9155/45/7/313. [DOI] [PubMed] [Google Scholar]
- D'Amico AV, Manola J, Loffredo M, Lopes L, Nissen K, O'Farrell DA, Gordon L, Tempany CM, Cormack RA. A practical method to achieve prostate gland immobilization and target verification for daily treatment. Int J Radiat Oncol Biol Phys. 2001;51:1431–1436. doi: 10.1016/s0360-3016(01)02663-3. [DOI] [PubMed] [Google Scholar]
- Fontbonne JM, Iltis G, Ban G, Battala A, Vernhes JC, Tillier J, Bellaize N, Le Brun C, Tamain B, Mercier K, Motin JC. Scintillating fiber dosimeter for radiation therapy accelerator. IEEE Trans Nucl Sci. 2002;49:2223–2227. [Google Scholar]
- Frelin AM, Fontbonne JM, Ban G, Colin J, Labalme M, Batalla A, Isambert A, Vela A, Leroux T. Spectral discrimination of Cerenkov radiation in scintillating dosimeters. Med Phys. 2005;32:3000–3006. doi: 10.1118/1.2008487. [DOI] [PubMed] [Google Scholar]
- Gaza R, McKeever SWS, Akselrod MS, Akselrod A, Underwood T, Yoder C, Andersen CE, Aznar MC, Marckmann CJ, Bøtter-Jensen L. A fiber-dosimetry method based on OSL from Al2O3:C for radiotherapy applications. Radiat Meas. 2004;38:809–812. [Google Scholar]
- Guillot M, Gingras L, Archambault L, Beddar S, Beaulieu L. Spectral method for the correction of the Cerenkov light effect in plastic scintillation detectors: A comparison study of calibration procedures and validation in Cerenkov light-dominated situations. Medical Physics. 2011;38:2140–2150. doi: 10.1118/1.3562896. [DOI] [PMC free article] [PubMed] [Google Scholar]
- Halvorsen PH. Dosimetric evaluation of a new design MOSFET in vivo dosimeter. Med Phys. 2005;32:110–117. doi: 10.1118/1.1827771. [DOI] [PubMed] [Google Scholar]
- Hardcastle N, Cutajar DL, Metcalfe PE, Lerch ML, Perevertaylo VL, Tome WA, Rosenfeld AB. In vivo real-time rectal wall dosimetry for prostate radiotherapy. Phys Med Biol. 2010;55:3859–3871. doi: 10.1088/0031-9155/55/13/019. [DOI] [PMC free article] [PubMed] [Google Scholar]
- Hardcastle N, Metcalfe PE, Rosenfeld AB, Tomé WA. Endo-rectal balloon cavity dosimetry in a phantom: Performance under IMRT and helical tomotherapy beams. Radiother Oncol. 2009;92:48–56. doi: 10.1016/j.radonc.2009.03.004. [DOI] [PMC free article] [PubMed] [Google Scholar]
- Hardcastle N, Soisson E, Metcalfe P, Rosenfeld AB, Tome WA. Dosimetric verification of helical tomotherapy for total scalp irradiation. Med Phys. 2008;35:5061–5068. doi: 10.1118/1.2996288. [DOI] [PubMed] [Google Scholar]
- Hughes RC, Huffman D, Snelling JV, Zipperian TE, Ricco AJ, Kelsey CA. Miniature radiation dosimeter for in vivo radiation measurements. Int J Radiat Oncol Biol Phys. 1988;14:963–967. doi: 10.1016/0360-3016(88)90019-3. [DOI] [PubMed] [Google Scholar]
- Klein D, Peakheart DW, McKeever SWS. Performance of a near-real-time KBr:Eu dosimetry system under computed tomography x-rays. Radiat Meas. 2010;45:663–667. [Google Scholar]
- Klein DM, Therriault-Proulx F, Archambault L, Briere TM, Beaulieu L, Beddar AS. Technical Note: Determining regions of interest for CCD camera-based fiber optic luminescence dosimetry by examining signal-to-noise ratio. Med Phys. 2011;38:1374–1377. doi: 10.1118/1.3554645. [DOI] [PMC free article] [PubMed] [Google Scholar]
- Lambert J, Nakano T, Law S, Elsey J, McKenzie DR, Suchowerska N. In vivo dosimeters for HDR brachytherapy: A comparison of a diamond detector, MOSFET, TLD, and scintillation detector. Med Phys. 2007;34:1759–1765. doi: 10.1118/1.2727248. [DOI] [PubMed] [Google Scholar]
- Landoni V, Saracino B, Marzi S, Gallucci M, Petrongari MG, Chianese E, Benassi M, Iaccarino G, Soriani A, Arcangeli G. A study of the effect of setup errors and organ motion on prostate cancer treatment with IMRT. Int J Radiat Oncol Biol Phys. 2006;65:587–594. doi: 10.1016/j.ijrobp.2006.01.021. [DOI] [PubMed] [Google Scholar]
- Laub WU, Wong T. The volume effect of detectors in the dosimetry of small fields used in IMRT. Med Phys. 2003;30:341–347. doi: 10.1118/1.1544678. [DOI] [PubMed] [Google Scholar]
- Ling CC, Burman C, Chui CS, Kutcher GJ, Leibel SA, LoSasso T, Mohan R, Bortfeld T, Reinstein L, Spirou S, Wang XH, Wu Q, Zelefsky M, Fuks Z. Conformal radiation treatment of prostate cancer using inversely-planned intensity-modulated photon beams produced with dynamic multileaf collimation. Int J Radiat Oncol Biol Phys. 1996;35:721–730. doi: 10.1016/0360-3016(96)00174-5. [DOI] [PubMed] [Google Scholar]
- Magne S, de Carlan L, Bordy JM, Isambert A, Bridier A, Ferdinand P. Multichannel dosimeter and α-Al2O3:C Optically Stimulated Luminescence (OSL) fiber sensors for use in Radiation Therapy - evaluation with photon beams, Advancements in Nuclear Instrumentation Measurement Methods and their Applications (ANIMMA). 2009 First International Conference on; Marseille, France. pp. 1–10. [Google Scholar]
- Nam TL, Keddy RJ, Burns RC. Synthetic diamonds as in vivo radiation detectors. Med Phys. 1987;14:596–601. doi: 10.1118/1.596024. [DOI] [PubMed] [Google Scholar]
- Otto K. Volumetric modulated arc therapy: IMRT in a single gantry arc. Med Phys. 2008;35:310–317. doi: 10.1118/1.2818738. [DOI] [PubMed] [Google Scholar]
- Palma D, Vollans E, James K, Nakano S, Moiseenko V, Shaffer R, McKenzie M, Morris J, Otto K. Volumetric modulated arc therapy for delivery of prostate radiotherapy: comparison with intensity-modulated radiotherapy and three-dimensional conformal radiotherapy. Int J Radiat Oncol Biol Phys. 2008;72:996–1001. doi: 10.1016/j.ijrobp.2008.02.047. [DOI] [PubMed] [Google Scholar]
- Patel RR, Orton N, Tome WA, Chappell R, Ritter MA. Rectal dose sparing with a balloon catheter and ultrasound localization in conformal radiation therapy for prostate cancer. Radiother Oncol. 2003;67:285–294. doi: 10.1016/s0167-8140(03)00056-2. [DOI] [PubMed] [Google Scholar]
- Purdy JA, Michalski JM. Does the evidence support the enthusiasm over 3D conformal radiation therapy and dose escalation in the treatment of prostate cancer? Int J Radiat Oncol Biol Phys. 2001;51:867–870. doi: 10.1016/s0360-3016(01)01721-7. [DOI] [PubMed] [Google Scholar]
- Smeenk RJ, van Lin EN, van Kollenburg P, Kunze-Busch M, Kaanders JH. Anal wall sparing effect of an endorectal balloon in 3D conformal and intensity-modulated prostate radiotherapy. Radiother Oncol. 2009;93:131–136. doi: 10.1016/j.radonc.2009.05.014. [DOI] [PubMed] [Google Scholar]
- Vatnitsky S, Jarvinen H. Application of a natural diamond detector for the measurement of relative dose distributions in radiotherapy. Phys Med Biol. 1993;38:173–184. doi: 10.1088/0031-9155/38/1/013. [DOI] [PubMed] [Google Scholar]
- Webb S. Intensity-modulated radiation therapy (IMRT): a clinical reality for cancer treatment, "any fool can understand this". The 2004 Silvanus Thompson Memorial Lecture. Br J Radiol. 2005;78(Spec No 2):S64–S72. doi: 10.1259/bjr/26711644. [DOI] [PubMed] [Google Scholar]
- Wolff D, Stieler F, Welzel G, Lorenz F, Abo-Madyan Y, Mai S, Herskind C, Polednik M, Steil V, Wenz F, Lohr F. Volumetric modulated arc therapy (VMAT) vs. serial tomotherapy, step-and-shoot IMRT and 3D-conformal RT for treatment of prostate cancer. Radiother Oncol. 2009;93:226–233. doi: 10.1016/j.radonc.2009.08.011. [DOI] [PubMed] [Google Scholar]
- Zelefsky MJ, Fuks Z, Hunt M, Lee HJ, Lombardi D, Ling CC, Reuter VE, Venkatraman ES, Leibel SA. High dose radiation delivered by intensity modulated conformal radiotherapy improves the outcome of localized prostate cancer. J Urol. 2001;166:876–881. [PubMed] [Google Scholar]
- Zhang P, Happersett L, Hunt M, Jackson A, Zelefsky M, Mageras G. Volumetric modulated arc therapy: planning and evaluation for prostate cancer cases. Int J Radiat Oncol Biol Phys. 2010;76:1456–1462. doi: 10.1016/j.ijrobp.2009.03.033. [DOI] [PubMed] [Google Scholar]


