Abstract
An optical coherence tomography (OCT) system employing a microelectromechanical system (MEMS) mirror was used to measure the refractive index (RI) of anatomically different regions in acute brain tissue slices, in which viability was maintained. RI was measured in white-matter and grey-matter regions, including the cerebral cortex, putamen, hippocampus, thalamus and corpus callosum. The RI in the corpus callosum was found to be ~4% higher than the RIs in other regions. Changes in RI with tissue deformation were also measured in the cerebral cortex and corpus callosum under uniform compression (20-80% strain). For 80% strain, measured RIs increased nonlinearly by up to 70% and 90% in the cerebral cortex and corpus callosum respectively. Knowledge of RI in heterogeneous tissues can be used to correct distorted optical images caused by RI variations between different regions. Also deformation-dependent changes in RI can be applied to OCT elastography or to mechanical tests based on optical imaging such as indentation tests.
OCIS codes: (110.4500) Optical coherence tomography, (290.3030) Index measurements, (230.4685) Optical microelectromechanical devices, (170.3880) Medical and biological imaging
1. Introduction
Optical bioimaging techniques such as optical coherence tomography (OCT), confocal microscopy and multiphoton fluorescence excitation microscopy provide imaging resolution on the order of micrometers or sub-micrometers, at least 100 times the resolution of traditional bioimaging techniques such as CT and MRI [1–5]; and these optical imaging techniques have been applied to clinical applications, such as early cancer detection [6,7], as well as to mechanical testing based on elastography [8,9]. Even with higher resolution, optical images of a biological tissue can be distorted by inaccurate data of the tissue’s refractive index (RI) which may vary from region to region even in the same tissue. Variation in RI between anatomical regions may be due to heterogeneous tissue structures caused by differences in tissue constituents. Variation in RI may also be introduced with compression or swelling of tissues, which can change the ratio of solid and fluid fractions in tissue. Accurately measuring RI is essential to provide high-fidelity optical images since RI is a key parameter for image reconstruction and interpretation as well as for understanding light-tissue interactions. In addition, clinical diagnosis can be made based on RI differences between normal and malignant tissues [10].
In previous studies, numerical simulations based on photon absorption and scattering models have been used to predict tissue RIs [11,12]. These methods involve complex algorithms and lengthy calculation times. Other attempts to experimentally determine tissue RIs measure the output angle of an optical fiber with the tissue as the fiber cladding [13], or measure the critical angle of total internal reflection between the boundary of the tissue sample and a triangular prism [14] or semi-cylindrical lens [15]. Using these experimental methods, the RIs of various tissues including kidney, liver and striated muscles were obtained [13,15].
Recently, more accurate methods for measuring RIs were proposed by Tearney et al. based on OCT [16]. Two methods were introduced to measure RIs of dermis, epidermis and stratum corneum in [16]: the first one used OCT images of a flat substrate and tissue boundaries and extracted the RI by comparing the optical and physical thickness; and the second method utilized focus tracking, in which the movements of the reference and sample arms were recorded and the RI was calculated based on the distances they moved. Binding et al. measured the RI of the cortex of the rat brain as a function of age by employing a full-field OCT with a similar focus tracking method [17]. Note that a broadband light source is typically used in OCT, so group RI was measured in these methods. Another approach, which was applied to liver, spleen and brain tissues, measured the phase change induced by tissue samples to calculate RI [18–20]. This method, by using a HeNe laser as the light source, gives the phase RIs of the samples. Group and phase RI are defined with respect to group and phase velocity respectively, and they are slightly different in biological tissues due to the chromatic dispersion.
While optical properties have been previously measured in central nervous system (CNS) tissue, RIs for living tissues are scarce, and to our knowledge, regionally-varying RIs in brain tissue have not been reported. Measurement of regionally varying RI is important for heterogeneous tissues consisting of different types of cells and cellular densities at each anatomic region. With these additional measures, distortion of optical images between anatomical regions due to variation of RIs may be corrected in complex tissues. Maintaining tissue viability is potentially important for measuring RI of CNS tissues. Hypoxic neuronal injury due to a lack of transported oxygen and nutrients increases cell membrane permeability, and cell membranes and matrix components will also lose their structural integrity. These physical changes may have an effect on optical properties of brain tissues. In addition, information on how RI changes with regards to physical deformation may be used to characterize or potentially diagnose diseases which are related to tissue deformation such as hydrocephalus and brain tumors [21–23]. Besides, OCT-based elastography, which has been used for medical diagnosis and mechanical testing may also benefit from this knowledge, since it is based on the measurements of tissue deformation under loaded conditions [8,9].
In this study, OCT is used to measure group RIs in various anatomical regions in live rat brain tissue slices. The effects of tissue deformation on RI changes are also measured in different anatomical regions. To measure RI, OCT and an indenter tip are used to measure both the physical and optical thicknesses of normal and compressed tissue slices, and cell viability for tissue slices is maintained throughout the measurements. Refractive index is determined by the ratio of physical thickness and optical thickness of brain tissue slices. To minimize disturbance to the test sample, a microelectromechanical system (MEMS) mirror is employed to scan the optical beam in air, so that a moving stage was not required.
2. OCT system
OCT is an optical imaging modality that employs coherent gating to realize cross-sectional micron-scale resolution images [1]. It employs a broadband-light Michelson interferometer, in which interference occurs only when the optical path lengths in the sample arm and the reference arm match within the coherence length of the light source. In this study, a time-domain OCT system was employed to provide through-thickness images of acute brain tissue slices. The experimental system is shown in Fig. 1 . The broadband light source (DenseLight, DL-BX9-CS3159A) had a center wavelength of 1310 nm and FWHM (full width half maximum) bandwidth of 75 nm, resulting in a 10 µm axial resolution in air. Depth scanning in the reference arm was realized by a rapid scanning optical delay line (RSOD). The galvanometer in the RSOD was driven at 1 KHz and the scanning range was 0 to 1.6 mm. In the sample arm, a MEMS mirror was used for lateral scans. The reflected interference signal was detected by a balanced photodetector whose output signal was collected and digitized by a DAQ card (NI-5122), and image processing was done with a PC. The sensitivity of the system was measured to be 74 dB. The frame rate of the OCT system was 2.5 frames/s.
Fig. 1.
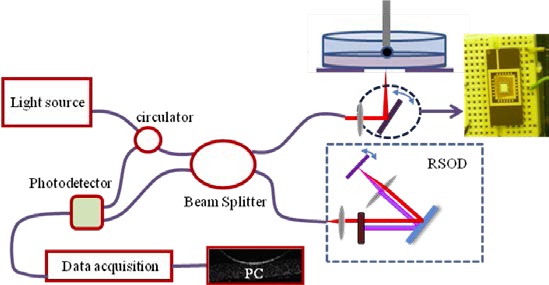
MEMS mirror based - OCT setup used for refractive index measurements.
In the sample arm, instead of using a translational stage to hold the sample for lateral scans, an electrothermal-based MEMS mirror was used (Fig. 2 ). The output light from the single mode fiber (SMF-28) was collimated with a fiber collimator (Thorlabs, F260FC-C); and the collimated beam size was 2.8 mm in diameter. The light was then focused using a lens with diameter of 12.7 mm and focal length of 39 mm. A MEMS mirror was placed approximately 26 mm behind the focusing lens, with 45° to the incoming beam. The beam diameter at the mirror plate was about 0.94 mm, and the 45° cross section was about 1.33 mm in diameter. The mirror plate is 3 mm × 3 mm, which is larger than twice the beam size and did not truncate the incident beam even at the largest scan angle of the MEMS mirror. The transverse resolution was ~23 µm.
Fig. 2.
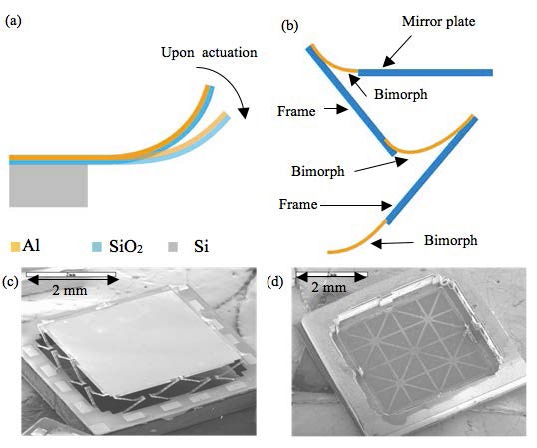
MEMS mirror used for lateral scans. (a) Bending motion of the bimorph beam. (b) LSF-LVD actuator design. (c) SEM of the front side of the MEMS mirror. (d) SEM of the back side of the MEMS mirror showing the Si ribs structure.
The advantage of using a MEMS mirror was that it allowed the sample to remain stationary, and thus disturbance from a moving stage was avoided. For ex vivo testing, the tissue slices were submerged in a physiological fluid, but were not fixed to the underlying substrate. With stage movement, even small relative movement of the tissue would cause image artifacts, and by employing a MEMS mirror, motion artifacts were avoided. A galvanometer could also be used for this purpose; however a MEMS mirror was preferred in this study. The ultimate application is to measure RI in vivo. In that case, a miniature laser scanning probe must be used. MEMS mirrors are a good fit because they are small and scan fast. Much smaller space is required for the MEMS mirror compared with a two-dimensional translational stage or a galvanometer set. In addition, MEMS mirrors have the advantage of low cost.
3. MEMS mirror
The MEMS mirror employed in this experiment is based on eletrothermal actuation. Electrothermal actuation is based on the movements of bimorph beams. A cantilever bimorph beam, as depicted in Fig. 2(a), consists of two layers of materials with different coefficients of thermal expansion (CTEs). The bimorph beam bends when the beam is heated because the two layers expand/contract differently upon a temperature change. Aluminum and SiO2 were used as the bimorph materials, and Platinum was embedded in the bimorph to form the resistor for Joule heating. For each actuator, three bimorph beams and two rigid frames were connected in series to compensate the lateral shift of each segment during scanning and to realize large displacement as well. This actuator design is called lateral-shift-free, large-vertical-displacement (LSF-LVD) design, similar to the one reported in [24]. A large mirror plate leads to low resonant frequency. In order to keep up the bandwidth of the mirror, a light-weight mirror structure was employed to reduce the mass of the mirror plate. The light-weight structure was realized by employing silicon ribs on the backside of the mirror plate for support instead of using a solid silicon layer, as shown in Fig. 2(d). The mirror plate mass was reduced to 21.8% of its original mass.
A relatively large 3 mm × 3 mm mirror plate was chosen for good optical resolution and ease of alignment. To control mirror movement, there were 16 actuators in total, 4 on each side of the mirror, as shown in Fig. 2(c). The scan angle of the MEMS mirror was ± 6.5° when a 4 Vdc driving voltage was applied and the measured tip-tilt resonant frequency was 445 Hz.
4. Tissue sample preparation
Tissue samples from five adult male Sprague Dawley rats (~250 g) were tested. Tissue slices from three rats were used to measure RIs within different anatomical regions and tissue slices from two rats were used to measure RI changes with tissue compression. Rat surgery was conducted in accordance with the NIH guidelines on the use of animals in research and the regulations of the Animal Care and Use Committee of the University of Florida. Prior to euthanasia, rats were fully anesthetized by isoflurane inhalation and checked for absence of toe-pinch, righting, and corneal reflexes. After euthanasia, standard protocols for tissue retrieval, brain tissue slicing, and tissue maintenance were implemented. Excised rat brains were immediately sliced using a vibratome (Leica VT 1000A, Leica Microsystems Inc., Germany) into coronal sections of 300 µm thickness. This thickness was chosen to ensure transport of oxygen and good visibility through the sample thickness in OCT images [25]. After slicing, brain tissues were submerged in O2-saturated artificial cerebrospinal fluid (aCSF, Neurobasal Media, GIBCO, Invitrogen Co., CA) and temperature was maintained between approximately 35 - 37 °C. The aCSF was continuously bubbled with 95% O2 and 5% CO2 gases and 0.5 mM L-Glutamine (Invitrogen Co., CA) and 1% penicillin-streptomycin (Invitrogen Co., CA) were supplemented. The pH of the aCSF measured before testing was 7.4. Through testing, sliced brain tissues were maintained under these conditions; cell viability was determined by measuring neuronal death or degeneration as a function of incubation time with Fluor-Jade C (FJC) staining. The results have shown that cells in the slices could maintain viability for up to 7 hrs [9].
5. RI measurement method and process
To establish regional variation of RI in acute rat brain tissue slices, cerebral cortex, putamen, hippocampus, thalamus and corpus callosum were tested (Fig. 3 ). The RI of a tissue slice is calculated by dividing optical thickness by its physical thickness, i.e.,
Fig. 3.
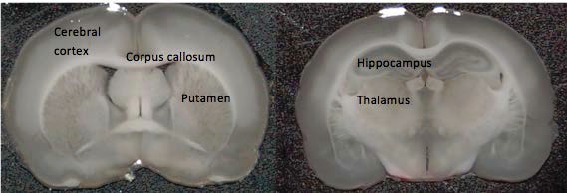
Anatomical regions of rat brain tissue slices tested. Medial sections from excised rat brains were sliced into coronal sections of 300 µm thickness.
| (1) |
Thicknesses were measured using the following procedure. To measure RI, an acute rat tissue slice was placed into a Petri dish which was filled with oxygenated aCSF (aCSF was oxygenated with 95% O2 and 5% CO2 for an hour prior to testing). A 2 mm spherical bead attached to a micro-positioner was lowered onto the slice to touch the surface of selected anatomical regions, see Fig. 4(a) . The spherical ball was aligned within the center of the lateral scan range of the MEMS mirror and OCT was used to scan cross-sectional tissue images from the bottom of the Petri dish which was made of glass. The optical thickness of the tissue slice was obtained by directly measuring the thickness of the slice in the OCT image through the number of pixels (see Fig. 4(b)). After the optical thickness was measured, the brain tissue slice was removed gently without moving the metal bead, and the aCSF in the Petri dish was removed using a pipette and paper tissue. The physical thickness of the brain tissue slice was determined using the thickness of the air gap between the metal bead and the bottom of the Petri dish. The RI of air is 1. The RI was calculated by comparing the pixel numbers of the tissue slice thickness and the air gap. To verify accuracy, a known optical path length of 500 µm was measured to be between 496 to 498 µm using this setup, so the system error was smaller than 0.8%. Ten tissue slices from each region were measured; one test was conducted on each slice.
Fig. 4.
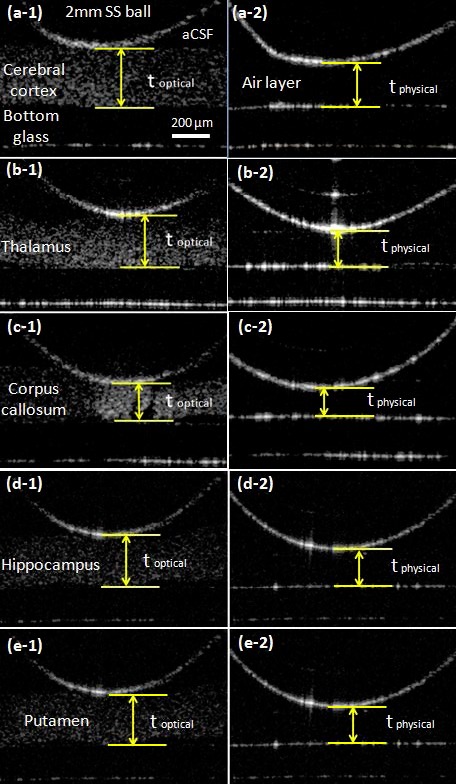
Measurement of optical and physical thickness of various anatomical regions in rat brain tissue slices. The optical thicknesses (toptical) of each target region was measured by touching a 2mm stainless steel (SS) ball at the surface of the cerebral cortex (a-1), thalamus (b-1), corpus callosum (c-1), hippocampus (d-1) and putamen (e-1). The physical thicknesses (tphysical) which is shown on right side of picture were measured as the distance from the glass bottom to the 2mm SS ball after gently removed the brain tissue slice and aCSF (a-2 to e-2).
To measure the refractive index of tissues under compressed states, the spherical bead was replaced by a 2 × 2 × 0.2 mm flat glass tip to apply uniformly compressive strains. Brain slices from 2 rats were used for this study, 7 slices for cerebral cortex and 8 slices for corpus callosum were tested. The same area in each slice underwent strains from 20% to 80% during a single series of tests. The initial physical distance between the bottom and top surface of brain tissue was measured using a micrometer stage, and then tissue was deformed by moving the flat indenter. Brain tissue slices were continuously compressed by 20%, 40%, 60% and 80% with respect to the initial physical thickness. Cross-sectional deformed images were taken by OCT and the physical thickness and optical thickness were compared to measure changes of RI with respect to tissue compression. The experimental procedure took less than 2 minutes for each series of tests.
6. Results
OCT provided 2D cross-sectional images of acute rat brain tissue slices, shown in Figs. 4 and 5 . The bottom and top surfaces of the tissue slices were clearly delineated. The surface contact of the 2 mm-diameter stainless steel bead was also detected for each anatomical region. The RI in the corpus callosum, which is a known white matter region, was 1.407 ± 0.015 and the RIs in the putamen and cortex, which are known as grey matter regions, were averaged between 1.361 and 1.369. RI in the corpus callosum was measured to be statistically higher than those in other regions of brain tissue (see Fig. 6 ). The corpus callosum was the only region found to be statistically different from other anatomical regions based on the Tukey-Kramer method with alpha = 0.05. The standard deviation of the RI in each region ranged from 0.007 to 0.016. The RI of the aCSF was 1.342 ± 0.007. This was ~2.7% lower than the average RI over all the regions measured in the brain tissue slices, which was 1.380.
Fig. 5.

OCT images of brain tissue slices under compression for (a) cerebral cortex (grey matter) and (b) corpus callosum (white matter, bundle of myelinated axons). (a-1, b-1) no compression, (a-2,b-2) 20%, (a-3, b-3) 40%, (a-4, b-4) 60% and (a-5,b-5) 80% compression.
Fig. 6.
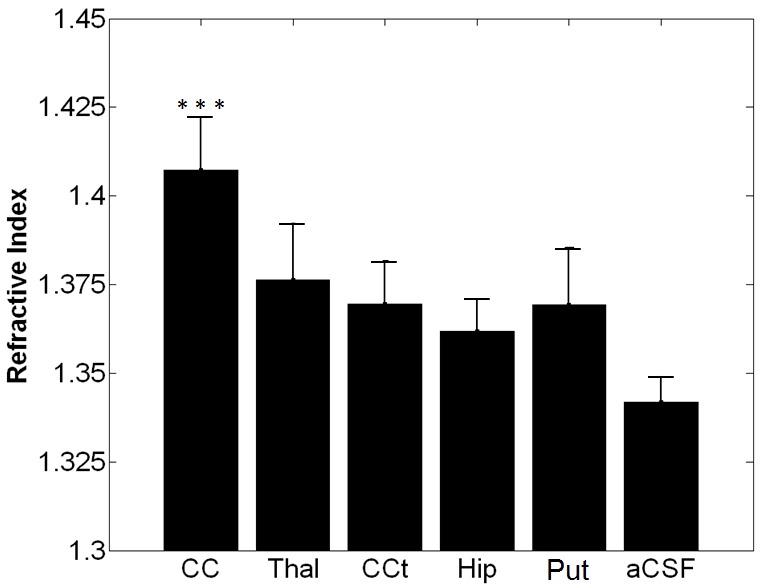
Measured RI in various anatomical regions in brain and aCSF. 10 samples were measured at each region. Bars correspond to 1SD (CC = corpus callosum, Thal = thalamus, CCt=cerebral cortex, Hip=hippocampus, Put=putamen, and aCSF=artificial cerebral spinal fluid). RI of corpus callosum was statistically different compared to other regions.
The effect of tissue deformation on RI was estimated in the cerebral cortex and corpus callosum by unconfined uniform compression. The RI changes in both regions showed a similar trend, non-linear increases with increasing compressive strain, as shown in Fig. 7 . The RI of the white matter increased more significantly under the same strain compared to the RI of the grey matter. For strains up to 20%, only small increases in RI were observed, which were ~3% for the grey matter and 6% for the white matter. For applied strains over 40%, RI significantly increased. For 80% strain, a RI increase of more than 70% was measured for the grey matter, while an average 90% increase was measured for the white matter.
Fig. 7.
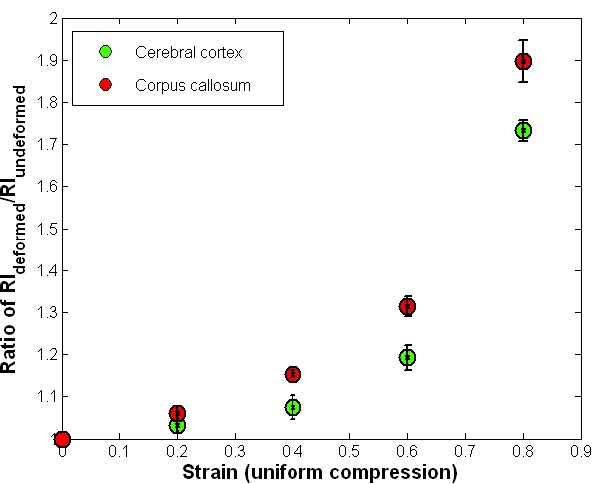
RI in rat brain tissue slices under uniform compression. 7 rat brain tissue slices were test for cerebral cortex and 8 tissue slices were tested for corpus callosum measurements. Bars correspond to ±1SE.
7. Discussion and conclusion
In this study, RI of rat brain tissue slices was measured in various anatomical regions using a MEMS based OCT system. OCT images clearly captured cross sectional images of brain tissue slices with white matter (corpus callosum and thalamus) showing brighter intensity than gray matter regions such as the cerebral cortex and putamen. RI of the corpus callosum, which consists primarily of white matter was measured to be 1.407±0.015. No statistical differences in RIs of grey matter regions (cerebral cortex and putamen) were found and the average RI of all grey matter regions was 1.369±0.014. RI of aCSF was slightly higher than RI of water by approximately 0.9%. The difference between RIs at each anatomical region may be due to different types of cells, cell densities, and differences in fractions of extra/intracellular space in their structures. The higher RI measured from the white matter may also be due to multiple scattering. RIs of both white and grey matter regions were close to RI of water, because of the large water content of brain tissue [26]. RIs of brain tissue slices measured by OCT in this study are comparable to those previously reported in literature, for example, 1.3526 for cortex at a 1.1 µm wavelength [17], 1.371 over a range of spatial frequency of 0.06 to 0.6 µm−1 (region not specified) [18]; and 1.3751 and 1.3847 for two cortical neuron cell bodies at 658nm [19]. Differences between measures may be due to different measuring wavelengths. Another reason could be due to maintenance of tissue viability. Tissue viability may be important in measures of optical properties in brain tissue since it can change with the fraction of solid to fluid constituents, e.g. extracellular fluid content. However, our measured RIs may be similar to other studies since ~80% of brain tissue is fluid, and changes in solid to fluid volume fractions with changes in tissue viability may not be significant as long as structural integrity of the ECM and cell membranes is maintained (short time after slicing).
Changes of RIs under unconfined compression testing of brain tissue slices were also measured in both white (corpus callosum) and grey matter (cerebral cortex) regions. Non-linear increasing trends with increases in strain were observed for RIs of both regions. Under smaller compression strains under 20%, changes of RI were almost negligible. RIs increased significantly over 40% compression. This large increase may be due to changes in water content and significant compaction of solid matrix in the tissue with large strains as fluid is squeezed out of the extracellular space. As compression approached 80%, most extracellular fluid was likely squeezed out and RI which was significantly higher than for non-compressed states likely reflected that of the solid constituents including cells, vessel walls, and ECM. The higher scattering of solid constituents compared to fluids can therefore be used to explain the gradual increase in OCT image intensity with the increased compression shown in Fig. 5.
In measurement of RIs, tissue swelling can be a significant issue when comparing acute slices to tissues in vivo. Thicknesses of brain tissue slices were measured within 2 hours after tissue slicing. Average thicknesses of the cerebral cortex and corpus callosum were 341 µm (1SE = 14 µm) and 254 µm (1SE = 22 µm), respectively. Thus an approximately 13% thickness increase in the cerebral cortex and a 20% thickness decrease in corpus callosum were detected after tissue slicing. This may in part be due to effects residual stresses within brain tissues. For example, within the brain, certain grey matter regions have been measured to be in compression while white matter was measured to be in tension [27]. After slicing, these stresses may be removed resulting in thickness changes. However, these changes in the thickness may not have a significant effect on RI, since changes of RI under 20% of compression were estimated to be less than 3%. This suggests that RI measurements in vivo and ex vivo could be comparable.
It should be noted that blood flow was not taken into account for this study, and the temperature of brain tissue samples may have changed slightly during the testing process since the sample arm was not heated. These two factors may introduce some differences when comparing the testing results to in vivo conditions. In large strain tests, viability of cells may be compromised as tissue is compressed. Within the region of the flat glass tip, the extracellular space may be greatly reduced, resulting in hindered extracellular transport and hypoxic cell damage. To reduce this effect, all test procedures were completed in less than 2 min within each test region. Cell viability may not be significantly compromised during this short period of time. Cells may also be damaged due to loading under large compression (over 40 to 80% of compression). With rupture or damage to the cell membrane, cellular components are released and these constituents may cause further tissue damage. Also due to the small scan angle of the MEMS mirror, the non-telecentric scan effects were not corrected within the OCT images. The precision of RI measurements can be increased with improved resolution of the OCT system and correction of the non-telecentric scan effects.
OCT provides rapid imaging and direct visualization of cross-sectional images of tissue slices. In this study, a MEMS-based OCT system was used to measure regional RIs in acute brain tissue slices under uncompressed and compressed states. Incorporating a scanning MEMS mirror in the OCT system eliminates the need of a moving stage so that the acute tissues can be imaged without any vibrational disturbance. The results of this study may be helpful in correcting optical image distortion caused by regionally varying RI and tissue compression caused by injury, surgery or disease. Accurate optical images of brain tissue aid in image interpretation and may lead to improved diagnosis and more successful imaging-guided surgery. In addition, OCT-based mechanical testing of tissues under compression or indentation tests may also benefit from this study. Furthermore, the exploration of using MEMS for miniaturizing the measuring system may lead to real-time in vivo tissue imaging. We only studied coronally sectioned brain tissue slices in this work. Since brain tissues can have variously aligned micro-structures, we will explore the effect of the directionality of brain tissue slices on RI and RI changes in response to compression in the future.
Acknowledgments
The project was supported from the National Science Foundation in part by award numbers 0725598 and 0901711, University of Florida Opportunity Fund, award number R01NS063360 from the National Institute of Neurological Disorders and Stroke, and award number W911NF-10-1-0276 from the Army Research Office.
References and links
- 1.Huang D., Swanson E. A., Lin C. P., Schuman J. S., Stinson W. G., Chang W., Hee M. R., Flotte T., Gregory K., Puliafito C. A., Fujimoto J. G., “Optical coherence tomography,” Science 254(5035), 1178–1181 (1991). 10.1126/science.1957169 [DOI] [PMC free article] [PubMed] [Google Scholar]
- 2.N. Claxton, T. Fellers, and M. Davidson, “Laser scanning confocal microscopy,” Olympus, (2006). Available online at http://www.olympusconfocal.com/theory/LSCMIntro.pdf
- 3.Gu M., Gan X., Kisteman A., Xu M. G., “Comparison of penetration depth between two-photon excitation and single-photon excitation in imaging through turbid tissue media,” Appl. Phys. Lett. 77(10), 1551–1553 (2000). 10.1063/1.1308059 [DOI] [Google Scholar]
- 4.Zipfel W. R., Williams R. M., Christie R., Nikitin A. Y., Hyman B. T., Webb W. W., “Live tissue intrinsic emission microscopy using multiphoton-excited native fluorescence and second harmonic generation,” Proc. Natl. Acad. Sci. U.S.A. 100(12), 7075–7080 (2003). 10.1073/pnas.0832308100 [DOI] [PMC free article] [PubMed] [Google Scholar]
- 5.Potma E. O., Evans C. L., Xie X. S., “Heterodyne coherent anti-Stokes Raman scattering (CARS) imaging,” Opt. Lett. 31(2), 241–243 (2006). 10.1364/OL.31.000241 [DOI] [PubMed] [Google Scholar]
- 6.König K., Speicher M., Bückle R., Reckfort J., McKenzie G., Welzel J., Koehler M. J., Elsner P., Kaatz M., “Clinical optical coherence tomography combined with multiphoton tomography of patients with skin diseases,” J. Biophotonics 2(6-7), 389–397 (2009). 10.1002/jbio.200910013 [DOI] [PubMed] [Google Scholar]
- 7.González S., Aplicaciones clínicas de la microscopía confocal de reflectancia en el manejo de los tumores cutáneos,” Actas Dermosifiliogr. 99(7), 528–531 (2008). [PubMed] [Google Scholar]
- 8.Schmitt J., “OCT elastography: imaging microscopic deformation and strain of tissue,” Opt. Express 3(6), 199–211 (1998). 10.1364/OE.3.000199 [DOI] [PubMed] [Google Scholar]
- 9.Lee S. J., Sun J., Flint J. J., Guo S., Xie H. K., King M. A., Sarntinoranont M., “Optically based-indentation technique for acute rat brain tissue slices and thin biomaterials,” J. Biomed. Mater. Res., Part B: Appl. Biomater. 97B(1), 84–95 (2011). 10.1002/jbm.b.31789 [DOI] [PMC free article] [PubMed] [Google Scholar]
- 10.T. Enatsu, H. Kitahara, K. Takano, and T. Nagashima, Terahertz spectroscopic imaging of paraffin-embedded liver cancer samples,” Infrared and Millimeter Waves, 2007 and the 2007 15th International Conference on Terahertz Electronics. IRMMW-THz. Joint 32nd International Conference 557–558, 2–9 Sept. (2007). [Google Scholar]
- 11.Arridge S. R., Hebden J. C., “Optical imaging in medicine: II. Modelling and reconstruction,” Phys. Med. Biol. 42(5), 841–853 (1997). 10.1088/0031-9155/42/5/008 [DOI] [PubMed] [Google Scholar]
- 12.Dehghani H., Brooksby B., Vishwanath K., Pogue B. W., Paulsen K. D., “The effects of internal refractive index variation in near-infrared optical tomography: a finite element modelling approach,” Phys. Med. Biol. 48(16), 2713–2727 (2003). 10.1088/0031-9155/48/16/310 [DOI] [PubMed] [Google Scholar]
- 13.Bolin F. P., Preuss L. E., Taylor R. C., Ference R. J., “Refractive index of some mammalian tissues using a fiber optic cladding method,” Appl. Opt. 28(12), 2297–2303 (1989). 10.1364/AO.28.002297 [DOI] [PubMed] [Google Scholar]
- 14.Song Q. W., Ku C., Zhang C., Michalak R., “Modified critical angle method for measuring the refractive index of bio-optical materials and its application to bacteriorhodopsin,” J. Opt. Soc. Am. B 12(5), 797–803 (1995). 10.1364/JOSAB.12.000797 [DOI] [Google Scholar]
- 15.Li H., Xie S., “Measurement method of the refractive index of biotissue by total internal reflection,” Appl. Opt. 35(10), 1793–1795 (1996). 10.1364/AO.35.001793 [DOI] [PubMed] [Google Scholar]
- 16.Tearney G. J., Brezinski M. E., Southern J. F., Bouma B. E., Hee M. R., Fujimoto J. G., “Determination of the refractive index of highly scattering human tissue by optical coherence tomography,” Opt. Lett. 20(21), 2258–2260 (1995). 10.1364/OL.20.002258 [DOI] [PubMed] [Google Scholar]
- 17.Binding J., Ben Arous J., Léger J. F., Gigan S., Boccara C., Bourdieu L., “Brain refractive index measured in vivo with high-NA defocus-corrected full-field OCT and consequences for two-photon microscopy,” Opt. Express 19(6), 4833–4847 (2011). 10.1364/OE.19.004833 [DOI] [PubMed] [Google Scholar]
- 18.Lue N., Bewersdorf J., Lessard M. D., Badizadegan K., Dasari R. R., Feld M. S., Popescu G., “Tissue refractometry using Hilbert phase microscopy,” Opt. Lett. 32(24), 3522–3524 (2007). 10.1364/OL.32.003522 [DOI] [PMC free article] [PubMed] [Google Scholar]
- 19.Rappaz B., Marquet P., Cuche E., Emery Y., Depeursinge C., Magistretti P., “Measurement of the integral refractive index and dynamic cell morphometry of living cells with digital holographic microscopy,” Opt. Express 13(23), 9361–9373 (2005). 10.1364/OPEX.13.009361 [DOI] [PubMed] [Google Scholar]
- 20.Beuthan J., Minet O., Helfmann J., Herrig M., Müller G., “The spatial variation of the refractive index in biological cells,” Phys. Med. Biol. 41(3), 369–382 (1996). 10.1088/0031-9155/41/3/002 [DOI] [PubMed] [Google Scholar]
- 21.Dorward N. L., Alberti O., Velani B., Gerritsen F. A., Harkness W. F. J., Kitchen N. D., Thomas D. G. T., “Postimaging brain distortion: magnitude, correlates, and impact on neuronavigation,” J. Neurosurg. 88(4), 656–662 (1998). 10.3171/jns.1998.88.4.0656 [DOI] [PubMed] [Google Scholar]
- 22.Roberts D. W., Hartov A., Kennedy F. E., Miga M. I., Paulsen K. D., “Intraoperative brain shift and deformation: a quantitative analysis of cortical displacement in 28 cases,” Neurosurgery 43(4), 749–758, discussion 758–760 (1998). 10.1097/00006123-199810000-00010 [DOI] [PubMed] [Google Scholar]
- 23.Cheng S., Bilston L. E., “Computational model of the cerebral ventricles in hydrocephalus,” J. Biomech. Eng. 132(5), 054501 (2010). 10.1115/1.4001025 [DOI] [PubMed] [Google Scholar]
- 24.Sun J., Guo S., Wu L., Liu L., Choe S. W., Sorg B. S., Xie H., “3D in vivo optical coherence tomography based on a low-voltage, large-scan-range 2D MEMS mirror,” Opt. Express 18(12), 12065–12075 (2010). 10.1364/OE.18.012065 [DOI] [PubMed] [Google Scholar]
- 25.Nicholson C., Syková E., “Extracellular space structure revealed by diffusion analysis,” Trends Neurosci. 21(5), 207–215 (1998). 10.1016/S0166-2236(98)01261-2 [DOI] [PubMed] [Google Scholar]
- 26.Shigeno T., Brock M., Shigeno S., Fritschka E., Cervós-Navarro J., “The determination of brain water content: microgravimetry versus drying-weighing method,” J. Neurosurg. 57(1), 99–107 (1982). 10.3171/jns.1982.57.1.0099 [DOI] [PubMed] [Google Scholar]
- 27.Xu G., Bayly P. V., Taber L. A., “Residual stress in the adult mouse brain,” Biomech. Model. Mechanobiol. 8(4), 253–262 (2009). 10.1007/s10237-008-0131-4 [DOI] [PMC free article] [PubMed] [Google Scholar]


