Abstract
The study herein determined the role of nuclear factor erythoid 2–related factor 2 (Nrf2) in the pathogenesis of hepatic steatosis, insulin resistance, obesity, and type 2 diabetes. Lepob/ob-Keap1-knockdown (KD) mice, which have increased Nrf2 activity, were generated. Markers of obesity and type 2 diabetes were measured in C57Bl/6J, Keap1-KD, Lepob/ob, and Lepob/ob-Keap1-KD mice. Lepob/ob-Keap1-KD mice exhibited less lipid accumulation, smaller adipocytes, decreased food intake, and reduced lipogenic gene expression. Enhanced Nrf2 activity impaired insulin signaling, prolonged hyperglycemia in response to glucose challenge, and induced insulin resistance in Lepob/ob background. Nrf2 augmented hepatic steatosis and increased lipid deposition in liver. Next, C57Bl/6J and Keap1-KD mice were fed a high-fat diet (HFD) to determine whether Keap1 and Nrf2 impact HFD-induced obesity. HFD-induced obesity and lipid accumulation in white adipose tissue was decreased in Keap1-KD mice. Nrf2 activation via Keap1-KD or sulforaphane suppressed hormone-induced differentiation and decreased peroxisome proliferator–activated receptor-γ, CCAAT/enhancer–binding protein α, and fatty acid–binding protein 4 expression in mouse embryonic fibroblasts. Constitutive Nrf2 activation inhibited lipid accumulation in white adipose tissue, suppressed adipogenesis, induced insulin resistance and glucose intolerance, and increased hepatic steatosis in Lepob/ob mice.
Type 2 diabetes is characterized by insulin resistance (IR) in skeletal muscle (SKM), liver, and white adipose tissue (WAT) (1). Type 2 diabetes mellitus is predominantly caused by obesity, which results from a sustained disorder between energy intake and expenditure. It is projected that in the U.S., 86% of adults will be overweight and 51% will be obese by the year of 2030 (2). Because obesity is associated with IR, type 2 diabetes, coronary heart disease, and cancer, the need to understand the pathologensis of obesity and identify new therapeutic molecular targets is imperative.
Excess energy is stored as triglycerides in WAT. Historically, WAT has been primarily considered to be a fuel storage depot, but is now recognized to have additional functions involved in hormone and cytokine secretion that control appetite, inflammation, and insulin sensitivity (3). Because adipocyte biology is significant to the pathogenesis of obesity and type 2 diabetes, transcriptional regulation of pro-obesity factors, the molecular networks that control adipogenesis, adipocyte maturation, and lipogenic gene expression are well characterized (4). Adipogenesis is a sequential process by which gene expression changes cause fibroblast differentiation to adipocytes (5). In isolated primary mouse embryonic fibroblasts (MEFs), adipogenesis begins with the induction of peroxisome proliferator–activated receptor (PPAR)-γ and CCAAT/enhancer–binding protein (C/ebp)-α, then the induction of the downstream of lipogenic genes, namely fatty acid–binding protein 4 (Fabp4), sterol regulatory element binding protein 1c (Srebp1c), fatty acid synthase (FAS), acetyl-CoA carboxylase (ACC), and stearoyl-CoA desaturase-1 (SCD-1).
It is well established that nuclear factor erythoid 2–related factor 2 (Nrf2)-Kelch–like ECH-associated protein 1 (Keap1) transcriptional pathway counters cellular electrophilic and oxidative stress. Nrf2 resides in the cytoplasm and is sequestered by Keap1 for targeted degradation by Cullin 3-base E3 ubiquitin ligase (6). Upon electrophilic/oxidative stress, the sequestration complex dissociates and Nrf2 translocates to the nucleus, binds to antioxidant-responsive elements, and induces expression of a battery of detoxification and antioxidant genes including NAD(P)H:quinine oxidoreductase 1, heme oxygenase-1, glutamate-cysteine ligase, catalytic and modifiers subunits, glutathione-S-transferases, uridine diphosphate–glucuronosyl transferases, and multidrug resistance–associated proteins to bolster cytoprotective functions (7). It was recently reported that the largest cluster of genes regulated by enhanced Nrf2 expression are lipid metabolism genes, suggesting Nrf2 plays a vital role in lipid metabolism (8). However, how Nrf2 modulates lipid synthesis and adipogenesis needs further elucidation (9–12); the role it plays in diabetes is emerging (13). For example, Nrf2 activation attenuated methionine- and choline-deficient diet-induced hepatic steatosis through inhibition of lipid deposition and CD36, Fgf21, and PPAR-α expression in liver (9). CDDO-imidazolide, an Nrf2 activating compound, decreased high-fat diet (HFD)–induced obesity, hepatic lipid accumulation, and hepatic lipid synthesis gene expression (FAS, ACC-1, and ACC-2), suggesting Nrf2 activation negatively regulates lipid metabolism (10). MEFs derived from Keap1-knockdown (KD) mice exhibit delayed differentiation and impaired adipogenesis, further demonstrating that Nrf2 potentially acts as a negative regulator of lipid metabolism (11). In contrast, recent work from Pi et al. (12) illustrated Nrf2-null mice had decreased WAT mass and smaller adipocyte formation and protection against weight gain and obesity compared with Nrf2 expressing mice, suggesting that the presence of Nrf2 is needed for adipogenesis and to induce lipid synthesis.
To explore the function of Nrf2 activation in adipogenesis in conjunction with related glucose and lipid metabolism outcomes, Lepob/ob-Keap1-KD mice were generated to determine how nonchemical Nrf2 activation and Keap1 affect adipogenesis, glucose/lipid metabolism, and IR status in a mouse model. In addition, wild-type (WT) and Keap1-KD mice were fed a HFD to induce obesity and clarify Nrf2 function in a nongenetically induced obesity model.
RESEARCH DESIGN AND METHODS
Animals.
Mice were maintained in a pathogen-free animal facility with a 12-h light/dark cycle. C57Bl/6J and Lepob/+ mice were purchased from Jackson Laboratory (Bar Harbor, ME). Keap1-KD mice congenic to the C57Bl/6J background (Keap1-KD) (14,15) were shared by Dr. Curtis Klaassen (University of Kansas Medical Center, Kansas City, KS) and Dr. Masayuki Yamamoto (Tohoku University Graduate School of Medicine, Sendai, Japan). Male age-matched mice were used for all experiments, which were carried out in University of Rhode Island with institutional animal care and use committee approval.
Generation of mice homozygous for Keap1-KD and leptin deficiency.
Keap1-KD mice were bred with Lepob/+ mice to create compound heterozygotes (Lepob/+-Keap1+/−), then subsequently bred with Keap1-KD mice to produce Lepob/+-Keap1-KD mice. Male and female Lepob/+-Keap1-KD mice were crossed to each other to obtain mice homozygous for Keap1-KD and leptin deficiency (Lepob/ob-Keap1-KD, OBKeap1-KD) or Keap1-KD. Lepob/ob (OB) and C57Bl/6J WT mice were produced by crossing the Lepob/+ mice to each other.
HFD-induced obesity.
Nine-week-old C57Bl/6J and Keap1-KD mice were fed either a standard diet (LM 485; Harlan Teklad) or HFD (Research Diets 12492, 60% kcal from fat). Body weight was measured every 4 days. After 36 days, liver, heart, kidney, and epididymal pad were collected and weighed.
Food intake.
Eight-week-old mice of four experimental genotypes were housed individually. Food intake was measured every day for at least 1 week.
Glucose tolerance test and insulin tolerance test.
Glucose tolerance tests and insulin tolerance test were performed by glucose administration (1 g/kg i.p.) or insulin (1 unit/kg i.p.) to OB and OBKeap1-KD mice fasted 16 h or 6 h, respectively. Blood glucose was determined by measuring tail blood concentrations at 0, 15, 30, 60, and 120 min after glucose or insulin administration.
MEF adipogenesis assay.
MEF differentiation to adipocytes was performed as described (11). MEFs were isolated from 13.5- to 15.5-days postcoital mouse embryos and cultured in Dulbecco’s modified Eagle’s medium supplemented with 10% FBS. MEFs were collected and cultured in 6- or 12-well plate in 90% confluence 24 h before differentiation. MEFs were then treated with sulforaphane (10 μmol/L; Sigma-Aldrich, St. Louis, MO) for 12 h first, then induced to differentiate to adipocytes (day 0) (10 μg/mL insulin, 5 μmol/L dexamethasone, 0.2 mmol/L isobutylmethylxanthine [Sigma-Aldrich], and 1 μmol/L rosiglitazone [Cayman Chemical Company, Ann Arbor, MI] for the first 3 days; 10 μg/mL insulin and 1 μmol/L rosiglitazone for the additional 4 days). Otherwise, MEFs were induced to differentiate to adipocytes for 3 days, then treated with sulforaphane (10 μmol/L) on day 3, and induction was continued for 7 more days with cells being collected on day 10. Media was refreshed every 2 days.
Measurement of insulin, triglyceride, and free fatty acid concentration.
Serum insulin was measured using a rat/mouse insulin ELISA kit (Millipore, Billerica, MA); triglycerides (TG) and free fatty acid (FFA) were determined with reagent kits (Pointe Scientific, Canton, MI; Wako Chemicals, Richmond, VA). Tissues (50 mg) were homogenized with PBS and extracted with chloroform-methanol (2:1; vol/vol). The residue was resuspended in 1% Triton X-100 in 100% ethanol. The TG and FFA content were normalized with tissue weight. Lipids were extracted from differentiated MEFs and the TG content and normalized to cellular protein amount.
Hematoxylin and eosin staining.
Sections (5–7 μm) of paraffin-embedded liver and WAT were cut and stained with hematoxylin and eosin before histopathologic analysis. For WAT, two fields from each section were analyzed to obtain the mean cell area per animal (n = 4 per genotype).
Oil Red O staining.
MEFs plated on 6-well plates were washed with PBS and fixed with 10% formalin for 10 min, then stained with Oil Red O solution (six parts Oil Red O stock solution and four parts H2O; Oil Red O stock solution is 0.5% Oil Red O in 100% isopropanol) for at least 1 h. Slides were counterstained with hematoxylin and mounted in glycerin jelly (Burlington, NC). Frozen sections were fixed with 10% formalin for 10 min, incubated with Oil Red O solution for 15 min, then followed by the same procedure as MEFs.
RNA isolation and quantitative real-time PCR.
Total RNA was isolated using TRIzol reagent (Invitrogen, Camarillo, CA) according to the manufacturer’s instructions. One microgram of total RNA was converted to cDNA, and mRNA levels were quantified by quantitative real-time PCR using a Roche LightCycler 480 System (Roche Applied Science, Mannheim, Germany). SYBR green chemistry was used, and relative target gene expression was normalized to 18S rRNA. The primers used are listed in Supplementary Table 2.
Western blot analysis.
Proteins from liver homogenates were resolved by SDS-PAGE and then transferred to polyvinylidene fluoride membrane. The membrane was blocked with 5% nonfat dry milk in Tris-buffered saline with Tween followed by incubation with primary antibodies overnight. Bands were visualized on X-ray film using an ECL detection kit (Amersham Biosciences, Piscataway, NJ). A list of antibody, source, and dilution is listed in Supplementary Fig. 1.
Statistical analysis.
Quantitative data were presented as mean ± SE. Statistic differences between multiple genotypes were determined by a one-way ANOVA followed by a Duncan post hoc test, or two different genotypes were calculated by one-tailed Student’s t test. All statistical tests with P < 0.05 were considered as significant.
RESULTS
Activation of Nrf2 attenuates lipid accumulation in Lepob/ob mice.
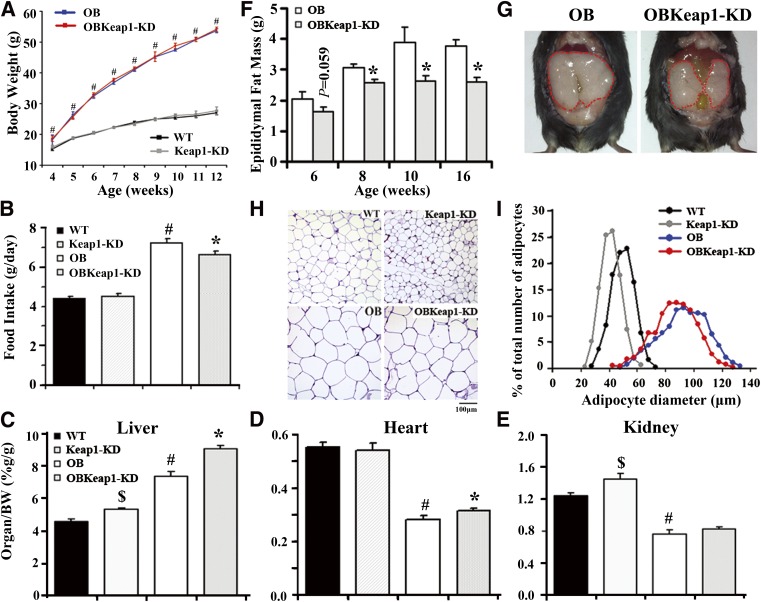
Resulting progeny of Lepob/+-Keap1-KD mice followed the expected Mendelian distribution, suggesting no embryonic lethality with targeted Keap1-KD in Lepob/ob mice. Figure 1A depicts the growth curve of mice from 4 to 12 weeks. OB mice were heavier than WT littermates at 4 weeks as previously described (16), and the difference remained significant from 5 to 12 weeks. However, no significant body weight change was observed between WT and Keap1-KD mice, or between OB and OBKeap1-KD mice. OB and OBKeap1-KD mice were hyperphagic compared with WT and Keap1-KD mice; however, OBKeap1-KD mice consumed less food than OB mice (Fig. 1B). By 8 weeks, liver weight increased in OBKeap1-KD mice (Fig. 1C, Supplementary Table 1). Heart weight increased in OBKeap1-KD mice (Fig. 1D, Supplementary Table 1). Kidney weight increased in Keap1-KD mice, and slightly increased in OBKeap1-KD mice (Fig. 1E, Supplementary Table 1), consistent with Nrf2 activation–induced organ hypertrophy or hyperplasia in other mouse models (9).
FIG. 1.
Activation of Nrf2 attenuates lipid accumulation in Lepob/ob mice. A: Body weights are shown for WT, Keap1-KD, OB, and OBKeap1-KD mice from 4 to 12 weeks (black squares, WT mice; gray squares, Keap1-KD mice; blue squares, OB mice; red squares, OBKeap1-KD mice; n = 4 to 12). B: Food intake from male mice at 8 weeks (n = 6 to 10). Ratios of liver (C), heart (D), and kidney weight (E) to body weight from 8-week-old male mice (n = 4 to 8) are shown. F: Epididymal pad weights are shown for male OB and OBKeap1-KD mice at 6, 8, 10, and 16 weeks (n = 5 to 8). G: The representative picture of epididymal pad from OB and OBKeap1-KD mice at 8 weeks. H: Representative hematoxylin and eosin staining of epididymal pad from 8-week-old male mice (100×, scale bar = 100 µm). I: Distribution of adipocytes diameters in epididymal pad from 8-week-old mice (n = 4). $P < 0.05, Keap1-KD mice compared with WT mice; #P < 0.05, OB mice compared with WT mice; *P < 0.05, OBKeap1-KD mice compared with OB mice. BW, body weight. (A high-quality digital representation of this figure is available in the online issue.)
In OBKeap1-KD mice, the epididymal WAT weighed less than OB mice, suggesting less lipid accumulation in WAT after Nrf2 activation (Fig. 1F and G, Supplementary Table 1). Furthermore, histomorphometric analysis of WAT revealed that Keap1-KD and OBKeap1-KD mice had smaller adipocytes than WT and OB mice, respectively (Fig. 1H). Quantitative analysis indicated that the adipocytes of Keap1-KD and OBKeap1-KD mice were somewhat smaller than those of WT and OB mice (Fig. 1I), suggesting that Nrf2 may impair the potential for adipocyte recruitment in Lepob/ob background.
Enhanced Nrf2 activity induces IR and impairs glucose metabolism.
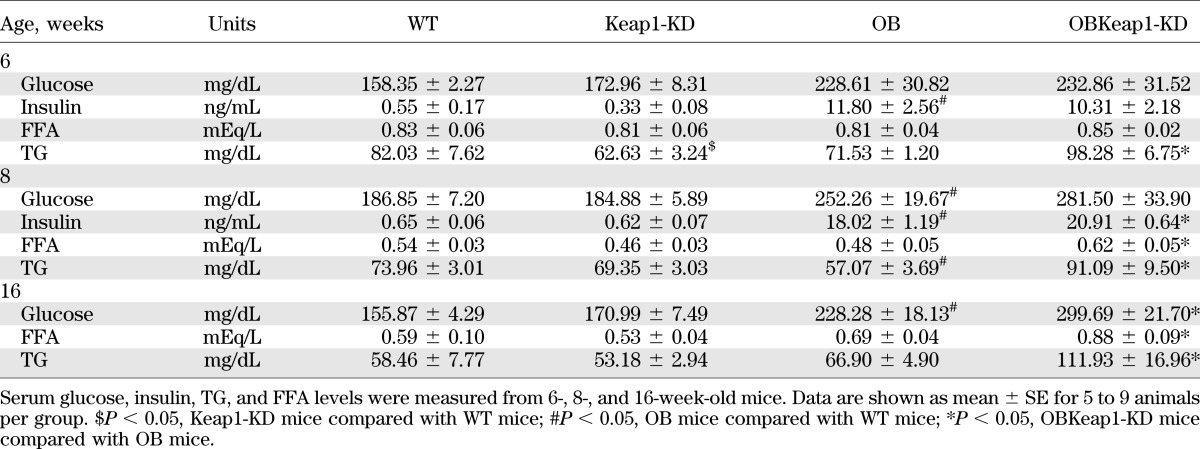
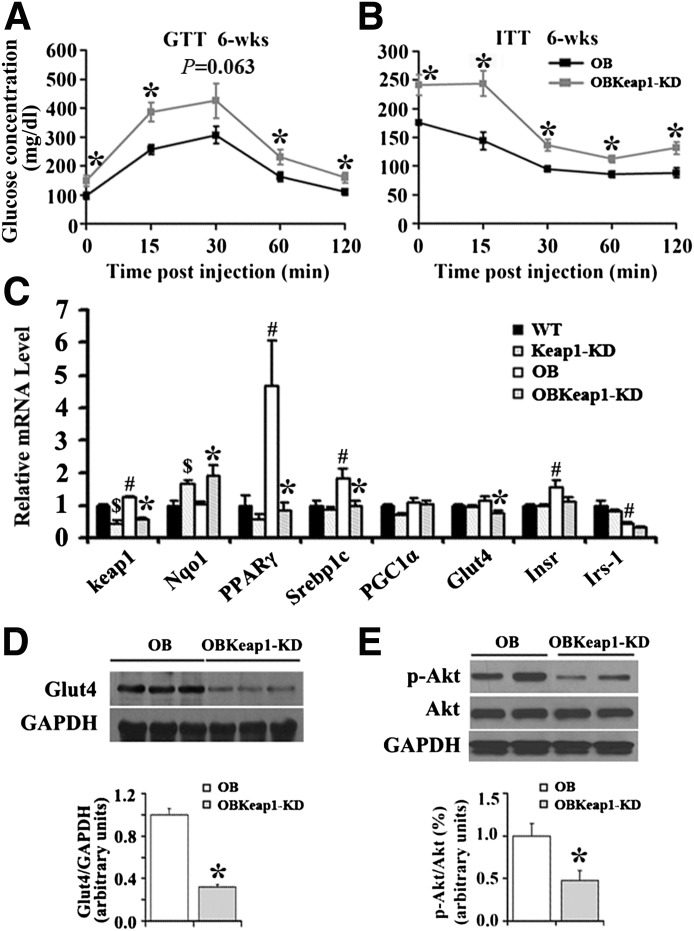
OBKeap1-KD mice exhibited elevated blood glucose, TG, FFA, and insulin levels (Table 1). To investigate how Nrf2 regulates glucose metabolism, blood glucose levels were monitored in response to acute glucose and insulin challenge. OBKeap1-KD mice exhibited impaired glucose tolerance (Fig. 2A) and insulin-induced glucose removal (Fig. 2B) at 6 weeks, suggesting Nrf2 activation may induce IR and impair glucose metabolism in OB mice. Yet, no significant difference of glucose tolerance was observed between these two genotypes (Supplementary Fig. 2A), and decreased insulin-induced glucose removal in OB-Keap1KD mice at 8 weeks (Supplementary Fig. 2B).
TABLE 1.
Metabolic parameters of serum in WT, Keap1-KD, OB, and OBKeap1-KD mice at different ages
FIG. 2.
Enhanced Nrf2 activity induces earlier onset of IR in Lepob/ob mice. Blood glucose concentration during glucose tolerance test (A) and insulin tolerance test (B) assay from 6-week-old mice (black squares, OB mice; gray squares, OBKeap1-KD mice; n = 5 to 6) is shown. C: Gene expression in SKM (n = 5 to 6). Immunoblot analysis of ser473-phospholylated-Akt (p-Akt), total-Akt (Akt) (D), and Glut4 (E) in SKM of 6-week-old mice is shown. $P < 0.05, Keap1-KD mice compared with WT mice; #P < 0.05, OB mice compared with WT mice; *P < 0.05, OBKeap1-KD mice compared with OB mice. Insr, insulin receptor; Irs, insulin receptor substrate; PGC, peroxisome proliferator–activated receptor γ coactivator; wk, weeks.
To determine the mechanism by which enhanced Nrf2 activity affects glucose metabolism, the expression of genes involved in glucose uptake and tolerance were measured. Keap1 decreased 54% and 53% in SKM of Keap1-KD and OBKeap1-KD mice. NAD(P)H:quinone oxidoreductase 1 (Nqo1), a well-described Nrf2 target gene (17), was upregulated, indicating Nrf2 activation occurred. PPARγ and Srebp1c, transcription factors, which mediate insulin effects (18,19), were decreased in OBKeap1-KD mice (Fig. 2C). Glut4 was reduced in OBKeap1-KD mice (Fig. 2C and D). Insulin receptor and insulin receptor substrate -1 mRNA expression tended to be decreased in OBKeap1-KD mice (P = 0.054 and P = 0.10, respectively). Nrf2 activation did not change the total amount of Akt, but reduced p-Akt in OBKeap1-KD mice (Fig. 2E), which could reduce Glut4 translocation and impair glucose uptake. Peroxisome proliferator–activated receptor γ coactivator 1α mRNA levels were similar between OB and OBKeap1-KD mice (Fig. 2C). Overall, Nrf2 activation may impair insulin signaling and glucose uptake, which could induce IR in SKM.
It is interesting that Nrf2 activation inhibited lipid accumulation in SKM of OBKeap1-KD mice at 8 weeks (Supplementary Fig. 3), but promoted lipid accumulation at 16 weeks (Supplementary Fig. 4).
Nrf2 activation promotes fatty liver in Lepob/ob mice.
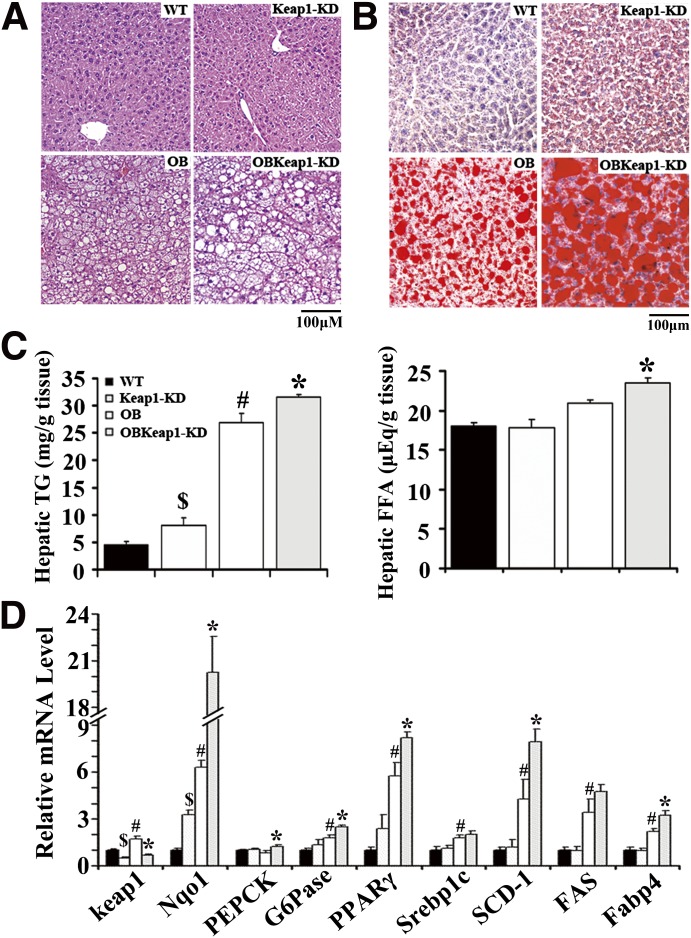
In OB and OBKeap1-KD mice, steatosis was observed, as well as increased neutral TG and lipid staining at 16 weeks (Fig. 3A and B). Nrf2 activation increased lipid staining, hepatic TG, and FFA content in OBKeap1-KD mice (Fig. 3B and C), in association with increased de novo lipid synthesis and lipid accumulation gene expression (PPARγ, SCD-1, and Fabp4) (Fig. 3D). However, no significant difference in hepatic TG and FFA content was observed between OB and OB-Keap1KD mice at 8 weeks (Supplementary Fig. 5). Keap1 mRNA expression was decreased 51% and 60% in Keap1-KD and OBKeap1-KD mice, respectively. Nqo1 expression was increased, suggesting Nrf2 activation occurred. PEPCK and glucose-6-phosphatase mRNA expression was increased in OBKeap1-KD mice, suggesting higher glucose production in the liver, perhaps contributing to the increased serum hyperglycemia observed (Table 1).
FIG. 3.
Nrf2 activation promotes hepatic lipid deposition and lipogenic gene expression in Lepob/ob mice. Histological analyses of hematoxylin and eosin (n = 4) (A) and Oil Red O staining (n = 3) (B) of liver sections from 16-week-old mice (200×, scale bar = 100 µm) are shown. C: Hepatic TG and FFA levels were measured to quantify liver lipid concentrations (n = 5 to 9). D: Gene expression from livers of 16-week-old mice (n = 4 to 8). $P < 0.05, Keap1-KD mice compared with WT mice; #P < 0.05, OB mice compared with WT mice; *P < 0.05, OBKeap1-KD mice compared with OB mice. (A high-quality digital representation of this figure is available in the online issue.)
Nrf2 activation impairs lipid accumulation and lipogenic gene expression in WAT.
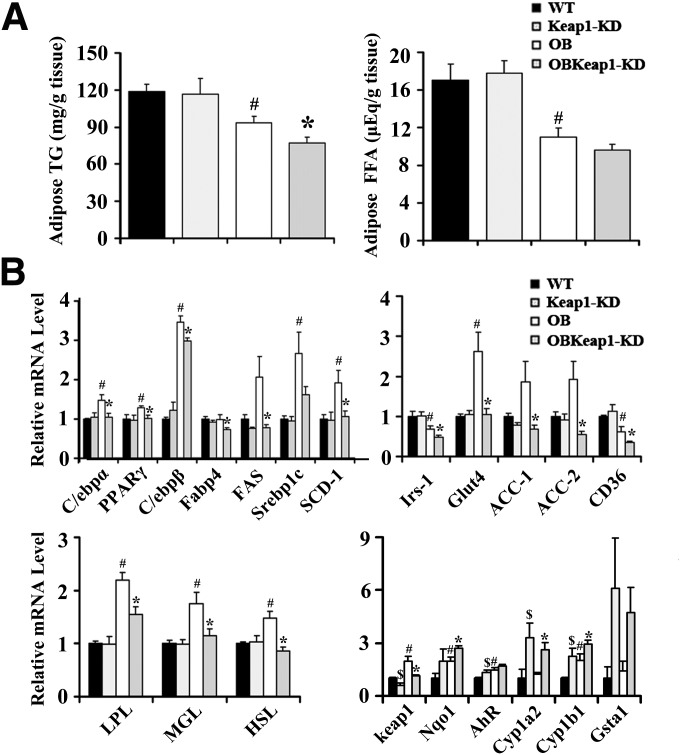
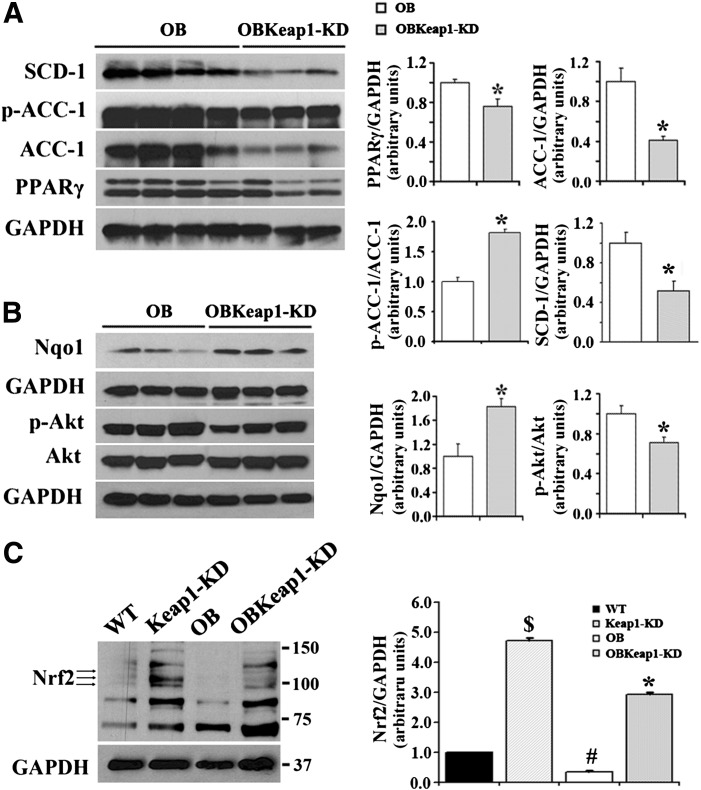
Enhanced Nrf2 activity decreased TG content and tended to decrease FFA content in OBKeap1-KD mice (Fig. 4A), accompanied by decreased expression of C/ebpα, PPARγ, C/ebpβ, Fabp4, FAS, SCD-1, ACC-1, ACC-2, and CD36 (Fig. 4B). Insulin receptor substrate -1, the molecular mediator of insulin signaling, was decreased in OBKeap1-KD mice. Glut4 also was decreased in OBKeap1-KD mice. Lipoprotein lipase, monoacylglycerol lipase, and hormone-sensitive lipase were increased in WAT of OB mice compared with WT mice, but this upregulation was dampened in OBKeap1-KD mice. Keap1 mRNA expression decreased 39% and 42% in Keap1-KD and OBKeap1-KD mice, respectively. Nqo1 was induced, indicating that Nrf2 activation occurred. Increased aryl hydrocarbon receptor (AhR) signaling concomitant Cyp1a2 and Cyp1b1 mRNA induction was present in Keap1-KD and OBKeap1-KD mice. Figure 5A illustrates that Keap1-KD suppressed SCD-1, ACC-1, and PPARγ expression and activated p-ACC at the protein level. Increased Nqo1 expression indicated Nrf2 activation in OBKeap1-KD mice (Fig. 5B). This activation also was confirmed in Keap1-KD and OBKeap1-KD MEFs, which indicated a higher amount of Nrf2 protein (Fig. 5C). The reduced amount of p-Akt in OBKeap1-KD mice further suggested impaired insulin signaling by Nrf2 activation in WAT (Fig. 5B).
FIG. 4.
Nrf2 activation reduces lipid deposition and lipogenic gene expression in WAT of Lepob/ob mice. A: TG and FFA levels in epididymal pad from 8-week-old male mice (n = 4 to 8). B: Total RNA was extracted and gene expression was analyzed by quantitative real-time PCR from epididymal pad of 8-week-old male mice (n = 5 to 8). $P < 0.05, Keap1-KD mice compared with WT mice; #P < 0.05, OB mice compared with WT mice; *P < 0.05, OBKeap1-KD mice compared with OB mice. Irs, insulin receptor substrate; LPL, lipoprotein lipase; MGL, monoacylglycerol; HSL, hormone sensitive lipase.
FIG. 5.
Enhanced Nrf2 activity reduced insulin signaling molecules and suppressed lipogenic gene expression in epididymal WAT in Lepob/ob mice. Immunoblot analysis of SCD-1, Ser79-phospholylated-Acetyl-CoA carboxylase (p-ACC-1), total ACC-1, PPARγ (A), ser473-phospholylated-Akt (p-Akt), total Akt (Akt), Nqo1 (B) in epididymal WAT from 8-week-old mice is shown. C: Immunoblot analysis of Nrf2 in MEFs from four types of mice. $P < 0.05, Keap1-KD mice compared with WT mice; #P < 0.05, OB mice compared with WT mice; *P < 0.05, OBKeap1-KD mice compared with OB mice.
Nrf2 activation delays adipocyte differentiation in Keap1-KD and OBKeap1-KD MEFs.
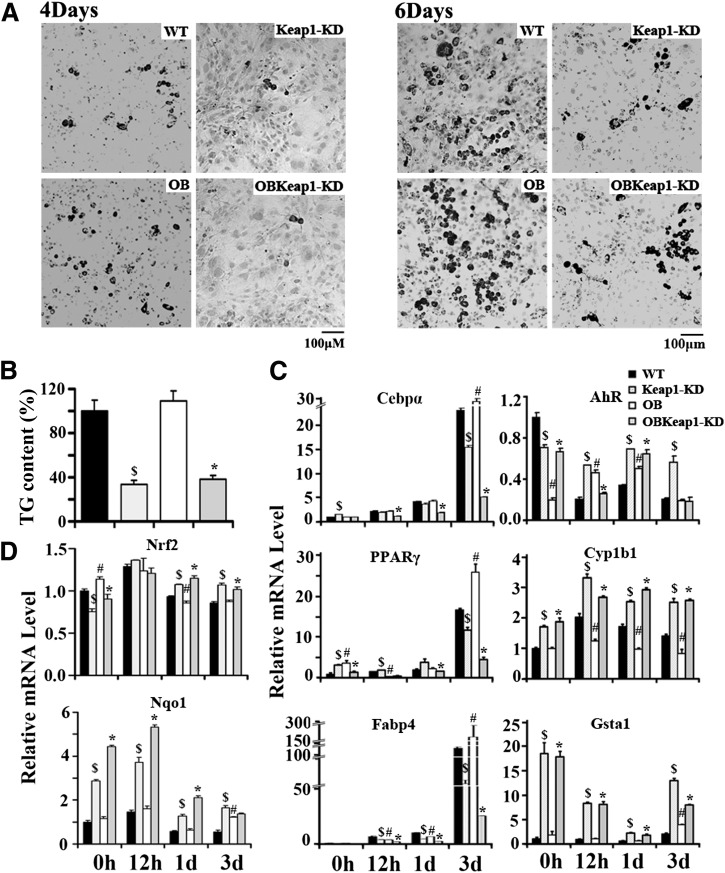
Lipid droplets were found in WT and OB MEFs 4 days after stimulation and became more apparent 6 days after treatment. In contrast, lipid droplets were not readily visible in Keap1-KD and OBKeap1-KD MEFs (Fig. 6A). The TG content in MEFs from Keap1-KD and OBKeap1-KD mice was ∼30% of WT and OB (Fig. 6B), suggesting Nrf2 activation attenuated lipid synthesis and lipid accumulation in vitro.
FIG. 6.
Nrf2 activation impaired hormone-induced adipogenesis and differentiation in MEFs. A: Representative picture of Oil Red O staining of four genotypes MEFs that were induced to differentiate to adipocytes for 4 days (left) and 6 days (right) (100×, scale bar = 100 μm). B: TG content of MEFs induced to differentiate to adipocytes for 6 days. C and D: Total RNA was extracted from MEFs after induced to differentiate to adipocytes for 0 h, 12 h, 1 day, and 3 days, and the indicated mRNA level was quantified by quantitative real-time PCR. $P < 0.05, Keap1-KD mice compared with WT mice; #P < 0.05, OB mice compared with WT mice; *P < 0.05, OBKeap1-KD mice compared with OB mice.
Adipogenesis is a process that occurs through highly ordered changes in gene expression. Initially, growth arrest occurs in proliferating preadipocytes, then C/EBPs and PPARs are induced in early adipogenesis (20,21). Therefore, induction of C/ebpα, PPARγ, and Fabp4 were selected as markers for adipogenesis. C/ebpα mRNA levels increased 12 h after stimulation; high levels were sustained in the differentiation process and peaked 3 days after induction; and enhanced Nrf2 activity attenuated C/ebpα induction. PPARγ induction was also impaired in Keap1-KD and OBKeap1-KD MEFs. Basal Fabp4 mRNA levels were equivalent among the four genotypes of MEFs. After stimulation for 12 h, Fabp4 expression increased in WT and OB MEFs, and this increase was sustained for 3 days, whereas this induction was attenuated in Keap1-KD and OBKeap1-KD MEFs (Fig. 6C). These data indicate that C/ebpα, PPARγ, and Fabp4 increased in MEFs following differentiation, but persistent Keap1-KD prevented this accumulation, reduced adipogenesis, and lipid accumulation.
It was reported that Nrf2 activation can induce AhR signaling and inhibit adipogenesis (11). The basal transcriptional levels of AhR target genes, Cyp1b1 and Gsta1, were higher in Keap1-KD and OBKeap1-KD than WT and OB MEFs, suggesting elevated AhR signaling may be involved in the observed attenuation of adipogenesis and lipid accumulation.
Nrf2 mRNA levels were induced in Keap1-KD and OBKeap1-KD MEFs at 1 day and 3 days, peaked at 12 h, and decreased thereafter. A similar expression pattern was observed with Nqo1, which peaked at 12 h, then decreased at 1 day and 3 days (Fig. 6D).
Sulforaphane delays MEF differentiation to adipocytes.
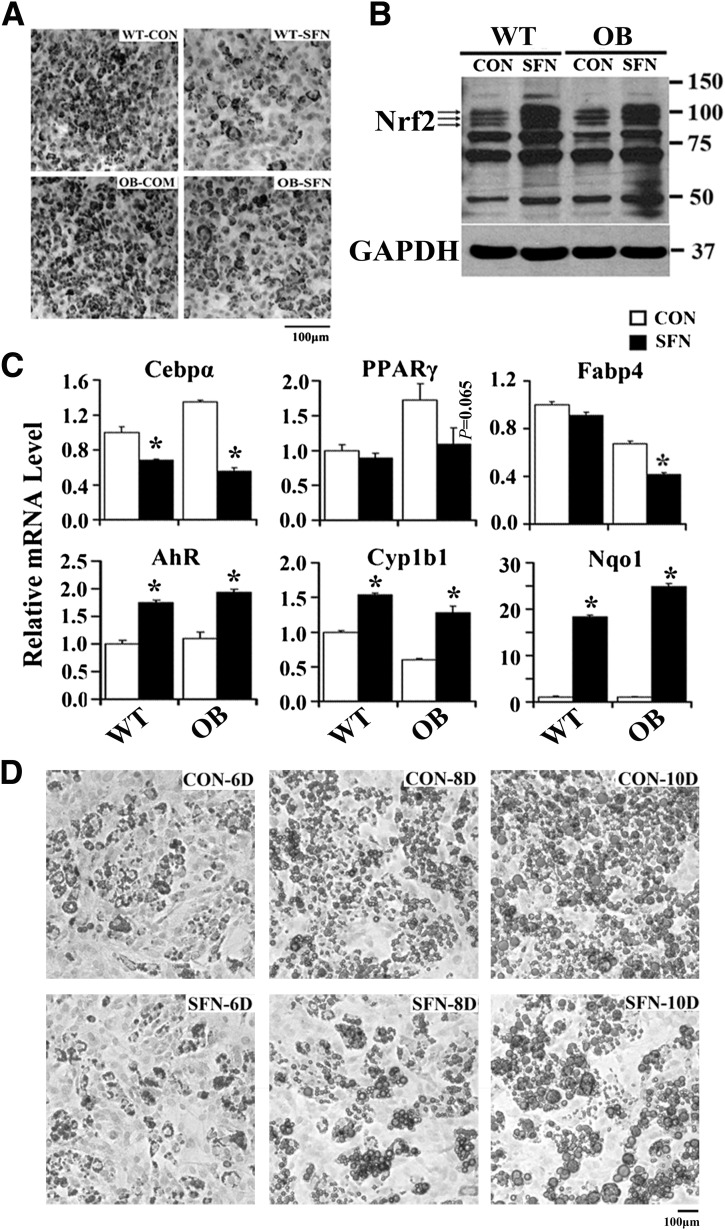
To confirm whether pharmacological Nrf2 activation delayed adipocyte differentiation, MEFs from WT and OB mice were pretreated with sulforaphane, and then differentiated to adipocytes (Fig. 7B). MEFs treated with sulforaphane had less Oil Red O staining (Fig. 7A) and reduced expression of C/ebpα, PPARγ, and Fabp4 (Fig. 7C). Furthermore, AhR target gene expression was induced by sulforaphane (Fig. 7C). To clarify Nrf2 function after fibroblast differentiation, MEFs were induced to differentiate to adipocytes for 3 days and then treated with sulforaphane. Figure 7D illustrates less Oil Red O staining in differentiated MEFs treated with sulforaphane, accompanied with reduced cellular TG content at day 6, day 8, and day 10 (Supplementary Fig. 6). Overall, pharmacological Nrf2 activation by sulforaphane prevented adipogenesis and lipid accumulation.
FIG. 7.
Nrf2 activation pharmacologically impaired hormone-induced adipogenesis and differentiation in MEFs. A: Representative image of Oil Red O staining of MEFs preactivated Nrf2 with sulforaphane (SFN; 10 μmol/L, 12 h) that were induced to differentiate to adipocytes for 6 days (100×, scale bar = 100 μm). B: MEFs were pretreated with the Nrf2 activator of sulforaphane (10 μmol/L, 6 h) and induced to differentiate to adipocytes for 24 h; total protein was extracted, and immunoblot analysis of Nrf2 was performed as indicated. C: Total RNA was extracted from MEFs pretreated with sulforaphane and induced to differentiate for 3 days, and the indicated mRNA level was measured by quantitative real-time PCR. D: Representative image of Oil Red O staining of MEFs induced to differentiate to adipocytes for 3 days. MEFs were then treated with sulforaphane or not (control [CON]) for the remaining days while incubating with differentiated media (100×, scale bar = 100 μm). Cells were fixed at day 6, day 8, and day 10. *P < 0.05, sulforaphane treatment (SFN) compared with CON.
Nrf2 activation prevents HFD-induced obesity.
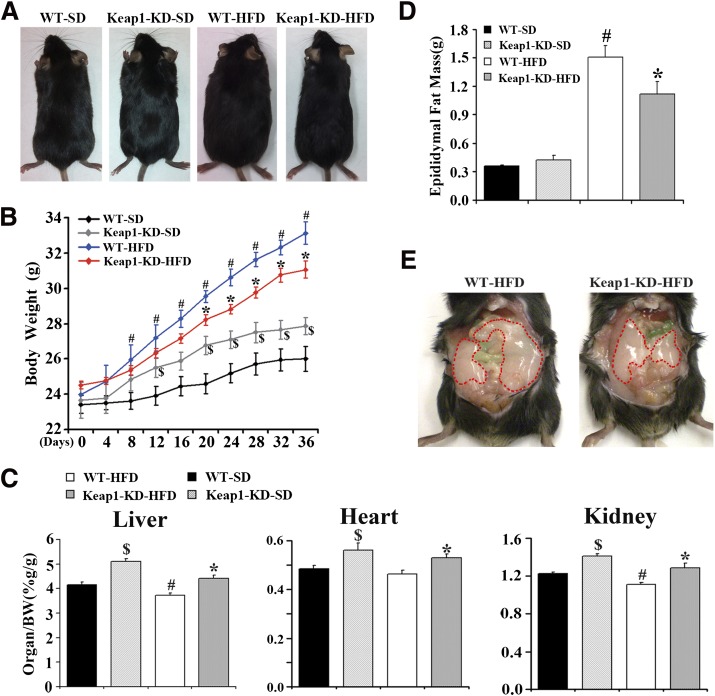
Next, to determine whether enhanced Nrf2 activity via Keap1-KD could decrease adipose tissue mass in a diet-induced obesity model, a short-term feeding study was performed. WT and Keap1-KD mice were fed a standard diet or HFD for 36 days. In WT mice, HFD feeding increased body weight starting at day 8 and continued through day 36. From day 20 until day 36, Keap1-KD mice had lower body weights than WT mice in response to HFD feeding (Fig. 8A and B). Keap1-KD increased liver, heart, and kidney weights in both standard chow diet– and HFD-fed mice (Fig. 8C). At 36 days, HFD feeding increased epididymal fat mass in WT mice, but less so in Keap1-KD mice, indicating that Keap1-KD or Nrf2 activation represses HFD-induced lipid accumulation in WAT and HFD-induced obesity (Fig. 8D and E).
FIG. 8.
Enhanced Nrf2 activity prevents HFD-induced obesity. A: The representative pictures of WT and Keap1-KD mice after HFD treatment for 36 days. B: The growth curve of WT and Keap1-KD mice after HFD treatment (black diamonds, WT mice fed with standard chow diet, WT-SD; gray diamonds, Keap1-KD mice fed with standard chow diet, Keap1-KD-SD; blue diamonds, WT mice fed with HFD, WT-HFD; red diamonds, Keap1-KD mice fed with HFD, Keap1-KD-HFD; n = 7 to 8). C: Ratios of liver, heart, and kidney weight to body weight (BW) of WT and Keap1-KD mice after HFD treatment (n = 7 to 8). D: Epididymal fat mass in WT and Keap1-KD mice after HFD treatment (n = 6 to 8). E: The representative picture of epididymal pad from WT and Keap1-KD mice after HFD treatment for 36 days. $P < 0.05, Keap1-KD-SD mice compared with WT-SD mice; #P < 0.05, WT-HFD mice compared with WT-SD mice; *P < 0.05, Keap1-KD-HFD mice compared with WT-HFD mice. (A high-quality color representation of this figure is available in the online issue.)
DISCUSSION
Nrf2 is ubiquitously expressed with relative high expression in liver, intestine, kidney, lung, and SKM. Presently, OBKeap1-KD mice with constitutive Nrf2 activation had decreased lipid accumulation in WAT, smaller adipocytes, increased IR, and impaired glucose tolerance compared with OB mice. Fibroblasts from OBKeap1-KD mice exhibited depressed adipocyte differentiation and reduced lipogenic gene expression, suggesting depressed adipogenesis in association with enhanced Nrf2 activity. Also, sulforaphane attenuated fibroblast differentiation to adipocytes and decreased lipogenic gene expression, even in differentiated fibroblasts. This is the first report that describes Nrf2 inhibition on lipid accumulation in WAT in vivo.
The first key finding in this study is that constitutive Nrf2 activity through Keap1-KD decreased WAT mass and lipid accumulation and negatively regulated adipogenesis, which explains the observed IR in OBKeap1-KD mice. Lipid accumulation is dependent on adipogenesis, in which C/ebpα and PPARγ are critical mediators. Development is delayed in C/ebpα-null mice, which die within 8 h after birth and exhibit inadequate body fat with undetectable lipid droplets in WAT, suggesting lipid accumulation in WAT was C/ebpα dependent (22). Ectopic expression of C/ebpα was observed to promote adipogenesis in mouse fibroblasts, suggesting a role in activation of lipid storage–related genes in adipose tissue (23). Adipogenesis was disturbed and adipocyte differentiation markers were decreased in conjunction with Nrf2 activation in 3T3 cells treated with oleanolic acid, suggesting Nrf2 activation attenuated adipogenesis (24). Adipogenesis is known to induce C/ebpα through a PPARγ-dependent pathway (25). PPARγ is abundantly expressed in adipose tissue, required to initiate adipogenesis in fibroblasts, and has a predominant role in regulation of adipogenesis (26). It is well described that thiazolidinediones (TZDs), PPARγ agonists, significantly decrease blood glucose and FFA levels, as well as enhance insulin sensitivity. However, weight gain and promotion of lipid accumulation is a factor that limits TZD use therapeutically (27). The increased adipogenesis caused by TZD can be interrupted by disruption of PPARγ gene expression (16). PPARγ-deficient mice were protected from the progression of adipocyte hypertrophy induced by HFD with hypersecretion of leptin, suggesting reduced lipid accumulation by leptin is PPARγ dependent (28). The current work demonstrated that OBKeap1-KD mice had reduced lipid accumulation and decreased fat mass, accompanied by decreased PPARγ expression, suggesting PPARγ regulates lipid metabolism via a leptin-independent mechanism.
The in vitro data using fibroblasts demonstrated that Nrf2 mRNA expression was induced at an early time point (e.g., 12 h) when the fibroblasts began the transition to adipocytes. However, Nrf2 and Nqo1 expression was downregulated in the later stages of MEF differentiation. This initial increase followed by a decrease suggests that Nrf2 induction is potentially needed for fibroblast differentiation to adipocytes (Fig. 6D). After the fibroblasts began to differentiate to adipocytes, Nrf2 activation by sulforaphane prevented further differentiation and decreased lipid content, indicating Nrf2 may exert an inhibitory role for lipid accumulation in differentiated adipocytes.
Conflicting reports exist regarding the role of Nrf2 in adipogenesis. Nrf2 inhibited adipogenesis in MEFs in vitro (11). However, others reported inhibition of adipogenesis and lipid accumulation in Nrf2-null mice (C57Bl/6;129SV background) (12). One possible reason for the discrepancy could be the difference in background strain of mice used or that Keap1-KD and Nrf2 deletion are not opposite models. Keap1 could have Nrf2-independent effects on transcription factors, such as PPARγ or C/ebpα, that induce fibroblast differentiation to adipocytes.
The second key observation is OBKeap1-KD mice exhibited impaired glucose and insulin tolerance, signifying impaired insulin sensitivity and IR with constitutive Nrf2 activity (Fig. 2A). IR correlates with elevated TG and FFA levels, which have been found to contribute to the onset of IR (29,30). The current study demonstrated that OBKeap1-KD mice exhibited increased glucose, TG, and FFA levels (Table 1). Glut4 is the predominant glucose transporter and is integral to glucose homeostasis. Downregulation of Glut4 expression in SKM is a major mechanism, which contributes to glucose intolerance associated with type 2 diabetes (31). High TG and FFA levels impaired Glut4 expression, which is thought to contribute to hyperglycemia and IR (32,33). OBKeap1-KD mice exhibited decreased Glut4 expression in SKM, which corresponds to the reduced glucose uptake and subsequent impaired glucose tolerance (Fig. 3). It was reported that Glut4 overexpression in WAT protected mice lacking Glut4 in SKM from IR and diabetes (34), suggesting Glut4 expression in WAT is key in glucose metabolism in association with the related IR and diabetes. OBKeap1-KD mice exhibited decreased Glut4 in WAT, implicating impaired IR could be related to a Glut4-dependent mechanism (Fig. 4). Additionally, two target genes of insulin signaling, PPARγ and Srebp1c, were decreased in WAT of OBKeap1-KD mice. Enhanced PPARγ signaling by TZDs tends to promote Glut4 expression and the translocation in adipocytes (35), subsequently enhancing glucose transportation to maintain glucose homeostasis. Therefore, the observed decrease in PPARγ signaling in OBKeap1-KD mice would impair glucose tolerance. Srebp1c regulates Glut4 expression directly in adipose tissue (36), which partially explains the observed impaired glucose tolerance. It should be noted that these results do differ from a previous finding that Nrf2-null mice showed impaired insulin secretion and prolonged hyperglycemia, which suggested impaired glucose tolerance (13). It could be speculated that either lack of Nrf2 or constitutive Nrf2 activity may not be entirely “opposite”, and again—there could be Keap1 effects on nuclear receptors and transcriptional pathways that are Nrf2 independent.
The third key observation is that OBKeap1-KD mice showed increased hepatic steatosis or “fatty liver” compared with OB mice. Nonalcoholic fatty liver disease (NAFLD) is a growing health issue in industrialized countries with the incidence of 20% to 40% and is the most prevalent chronic liver disease in adults in the U.S. (37,38). Obesity and IR are the risk factors for NAFLD. High blood lipid levels promote lipid deposition in liver and SKM, which induces IR. FFAs are converted to TGs by de novo synthesis enzymes, such as ACC-1 and FAS. These synthetic enzymes are under the master control of PPARγ and Srebp1c transcription factors (39,40). In the current study, OBKeap1-KD mice exhibited increased hepatic steatosis and prolipogenic gene expression (e.g., PPARγ, SCD-1, Fabp4).
The fourth key observation is that pharmacological activation of Nrf2 corresponds with a protective function in adipogenesis and obesity, suggesting Nrf2 activation represents a potential approach in preventing obesity and diabetic mellitus. Sulforaphane, a compound found in broccoli, is known to be an Nrf2 activator (41) and recently has demonstrated protection against the development of type 1 diabetes in mice with streptozotocin-induced diabetes and β-cell damage (42). Oltipraz, another known Nrf2 activator and chemopreventive agent (43), prevented HFD-induced obesity and IR in C57Bl/6J mice (44). Nrf2-null mice had increased lipogenic gene expression and enhanced hepatic FFA content induced by short-term HFD feeding for 4 weeks. Additionally, Nrf2 and Nqo1 and Gstm6 target gene expression reduced in HFD-induced obesity (45) are consistent with the current in vitro data, which illustrated that Nrf2 and Nqo1 mRNA levels decreased along with fibroblast differentiation to adipocytes. However, recent work using Nrf2-null mice demonstrated Nrf2 deficiency prevented HFD-induced obesity by repressing Fgf21 (46). Thus, the role that antioxidant signaling and Nrf2 have in obesity remains unclear. Based on our observations herein and evaluation of the literature, it appears that Nrf2 and Keap1 may exert differential effects with short- or long-term HFD feeding. Moreover, Nrf2-null or Keap1-KD (Nrf2 overexpression) mice sometimes display similar, rather than opposite, results. The hormetic role for Nrf2 in obesity needs much consideration. Overall, the collection of published work suggests that Nrf2 activation can be exploited for novel approaches for the protection of obesity, diabetes, and NAFLD, perhaps with consideration for different stages of human development and disease.
The final key observation herein is that Nrf2-Keap1 signaling pathway was inducible in WAT and SKM. Nrf2 protective function against oxidative stress and electrophilic injury in liver is well described. Few studies have addressed whether Nrf2 pathway is inducible in WAT or SKM. Dysfunction of Nrf2-Keap1 has been associated with a sedentary lifestyle, whereas an active lifestyle can reverse the redox status, suggesting metabolic induction of Nrf2-Keap1 signaling in SKM (47). The current study demonstrated Nrf2 target gene expression was increased in WAT and SKM of Keap1-KD and OBKeap1-KD mice. Moreover, Nrf2 target gene expression was observed to be higher in OB mice, indicating a relationship between hyperlipidemia and Nrf2 activation.
Overall, the current research demonstrates that enhanced Nrf2 activity by Keap1-KD in Lepob/ob mice dampens insulin signaling and aggravates IR, which was accompanied by reduced WAT expandability and lipid accumulation, elevated hepatic steatosis, and impaired peripheral glucose and lipid metabolism. Enhanced Nrf2 activity by Keap1-KD also decreased WAT expandability and obesity with short-term HFD feeding. In vitro data further suggest enhanced Nrf2 activity suppresses lipid synthesis and lipid accumulation in fibroblasts after differentiation to adipocytes. Overall, Keap1-KD and constitutive Nrf2 activation decreases WAT mass, but increases hepatic steatosis and glucose intolerance.
ACKNOWLEDGMENTS
This work was supported by the National Institutes of Health (5R-01ES-016042-03, 3R-01ES-016042-2S2, 5K-22ES-013782-03) and also supported, in part, by the Rhode Island IDeA Network of Biomedical Research Excellence (Award No. P20RR016457-10) from the National Center for Research Resources, National Institutes of Health.
No potential conflicts of interest relevant to this article were reported.
J.X. devised the research questions, formulated the research plan, researched the data, and wrote, reviewed, and edited the manuscript. S.R.K. and V.R.M. contributed to discussion and reviewed and edited the manuscript. A.C.D. contributed to the discussion. A.L.S. devised the research questions, formulated the research plan, and wrote, reviewed, and edited the manuscript. A.L.S. is the guarantor of this work and, as such, had full access to all the data in the study and takes responsibility for the integrity of the data and the accuracy of the data analysis.
Parts of this study were presented as an oral presentation at the Gordon Conference on Cellular and Molecular Mechanisms of Toxicity of the Gordon Research Conferences, Andover, New Hampshire, 7–12 August 2011.
The authors thank Dr. Michael Goedken (Department of Pathology, Merck Research Laboratories, Kenilworth, NJ) and Dr. Clyde Belgrave (Providence VA Medical Center, Providence, RI) for histopathology and photomicrograph assistance. The authors also thank Maneesha Paranjpe, Dr. Wei Wei, Dr. Liya Li, and Hang Ma (all from the University of Rhode Island, Kingston, RI) for technical assistance with sample collection.
Footnotes
This article contains Supplementary Data online at http://diabetes.diabetesjournals.org/lookup/suppl/doi:10.2337/db11-1716/-/DC1.
REFERENCES
- 1.Kahn CR. Banting Lecture. Insulin action, diabetogenes, and the cause of type II diabetes. Diabetes 1994;43:1066–1084 [DOI] [PubMed] [Google Scholar]
- 2.Wang Y, Beydoun MA, Liang L, Caballero B, Kumanyika SK. Will all Americans become overweight or obese? Estimating the progression and cost of the US obesity epidemic. Obesity (Silver Spring) 2008;16:2323–2330 [DOI] [PubMed] [Google Scholar]
- 3.Rosen ED, Spiegelman BM. Adipocytes as regulators of energy balance and glucose homeostasis. Nature 2006;444:847–853 [DOI] [PMC free article] [PubMed] [Google Scholar]
- 4.Darlington GJ, Ross SE, MacDougald OA. The role of C/EBP genes in adipocyte differentiation. J Biol Chem 1998;273:30057–30060 [DOI] [PubMed] [Google Scholar]
- 5.Rangwala SM, Lazar MA. Transcriptional control of adipogenesis. Annu Rev Nutr 2000;20:535–559 [DOI] [PubMed] [Google Scholar]
- 6.Itoh K, Ishii T, Wakabayashi N, Yamamoto M. Regulatory mechanisms of cellular response to oxidative stress. Free Radic Res 1999;31:319–324 [DOI] [PubMed] [Google Scholar]
- 7.Klaassen CD, Reisman SA. Nrf2 the rescue: effects of the antioxidative/electrophilic response on the liver. Toxicol Appl Pharmacol 2010;244:57–65 [DOI] [PMC free article] [PubMed] [Google Scholar]
- 8.Yates MS, Tran QT, Dolan PM, et al. Genetic versus chemoprotective activation of Nrf2 signaling: overlapping yet distinct gene expression profiles between Keap1 knockout and triterpenoid-treated mice. Carcinogenesis 2009;30:1024–1031 [DOI] [PMC free article] [PubMed] [Google Scholar]
- 9.Zhang YK, Yeager RL, Tanaka Y, Klaassen CD. Enhanced expression of Nrf2 in mice attenuates the fatty liver produced by a methionine- and choline-deficient diet. Toxicol Appl Pharmacol 2010;245:326–334 [DOI] [PMC free article] [PubMed] [Google Scholar]
- 10.Shin S, Wakabayashi J, Yates MS, et al. Role of Nrf2 in prevention of high-fat diet-induced obesity by synthetic triterpenoid CDDO-imidazolide. Eur J Pharmacol 2009;620:138–144 [DOI] [PMC free article] [PubMed] [Google Scholar]
- 11.Shin S, Wakabayashi N, Misra V, et al. NRF2 modulates aryl hydrocarbon receptor signaling: influence on adipogenesis. Mol Cell Biol 2007;27:7188–7197 [DOI] [PMC free article] [PubMed] [Google Scholar]
- 12.Pi J, Leung L, Xue P, et al. Deficiency in the nuclear factor E2-related factor-2 transcription factor results in impaired adipogenesis and protects against diet-induced obesity. J Biol Chem 2010;285:9292–9300 [DOI] [PMC free article] [PubMed] [Google Scholar]
- 13.Aleksunes LM, Reisman SA, Yeager RL, Goedken MJ, Klaassen CD. Nuclear factor erythroid 2-related factor 2 deletion impairs glucose tolerance and exacerbates hyperglycemia in type 1 diabetic mice. J Pharmacol Exp Ther 2010;333:140–151 [DOI] [PMC free article] [PubMed] [Google Scholar]
- 14.Reisman SA, Yeager RL, Yamamoto M, Klaassen CD. Increased Nrf2 activation in livers from Keap1-knockdown mice increases expression of cytoprotective genes that detoxify electrophiles more than those that detoxify reactive oxygen species. Toxicol Sci 2009;108:35–47 [DOI] [PMC free article] [PubMed] [Google Scholar]
- 15.Okawa H, Motohashi H, Kobayashi A, Aburatani H, Kensler TW, Yamamoto M. Hepatocyte-specific deletion of the keap1 gene activates Nrf2 and confers potent resistance against acute drug toxicity. Biochem Biophys Res Commun 2006;339:79–88 [DOI] [PubMed] [Google Scholar]
- 16.Medina-Gomez G, Gray SL, Yetukuri L, et al. PPAR gamma 2 prevents lipotoxicity by controlling adipose tissue expandability and peripheral lipid metabolism. PLoS Genet 2007;3:e64. [DOI] [PMC free article] [PubMed] [Google Scholar]
- 17.Dinkova-Kostova AT, Talalay P. NAD(P)H:quinone acceptor oxidoreductase 1 (NQO1), a multifunctional antioxidant enzyme and exceptionally versatile cytoprotector. Arch Biochem Biophys 2010;501:116–123 [DOI] [PMC free article] [PubMed] [Google Scholar]
- 18.Guillet-Deniau I, Mieulet V, Le Lay S, et al. Sterol regulatory element binding protein-1c expression and action in rat muscles: insulin-like effects on the control of glycolytic and lipogenic enzymes and UCP3 gene expression. Diabetes 2002;51:1722–1728 [DOI] [PubMed] [Google Scholar]
- 19.Kintscher U, Law RE. PPARgamma-mediated insulin sensitization: the importance of fat versus muscle. Am J Physiol Endocrinol Metab 2005;288:E287–E291 [DOI] [PubMed] [Google Scholar]
- 20.Gregoire FM, Smas CM, Sul HS. Understanding adipocyte differentiation. Physiol Rev 1998;78:783–809 [DOI] [PubMed] [Google Scholar]
- 21.Rosen ED, Spiegelman BM. Molecular regulation of adipogenesis. Annu Rev Cell Dev Biol 2000;16:145–171 [DOI] [PubMed] [Google Scholar]
- 22.Wang ND, Finegold MJ, Bradley A, et al. Impaired energy homeostasis in C/EBP alpha knockout mice. Science 1995;269:1108–1112 [DOI] [PubMed] [Google Scholar]
- 23.Freytag SO, Paielli DL, Gilbert JD. Ectopic expression of the CCAAT/enhancer-binding protein alpha promotes the adipogenic program in a variety of mouse fibroblastic cells. Genes Dev 1994;8:1654–1663 [DOI] [PubMed] [Google Scholar]
- 24.Sung HY, Kang SW, Kim JL, et al. Oleanolic acid reduces markers of differentiation in 3T3-L1 adipocytes. Nutr Res 2010;30:831–839 [DOI] [PubMed] [Google Scholar]
- 25.Rosen ED, Hsu CH, Wang X, et al. C/EBPalpha induces adipogenesis through PPARgamma: a unified pathway. Genes Dev 2002;16:22–26 [DOI] [PMC free article] [PubMed] [Google Scholar]
- 26.Tontonoz P, Hu E, Spiegelman BM. Stimulation of adipogenesis in fibroblasts by PPAR gamma 2, a lipid-activated transcription factor. Cell 1994;79:1147–1156 [DOI] [PubMed] [Google Scholar]
- 27.Boden G, Zhang M. Recent findings concerning thiazolidinediones in the treatment of diabetes. Expert Opin Investig Drugs 2006;15:243–250 [DOI] [PubMed] [Google Scholar]
- 28.Kubota N, Terauchi Y, Miki H, et al. PPAR gamma mediates high-fat diet-induced adipocyte hypertrophy and insulin resistance. Mol Cell 1999;4:597–609 [DOI] [PubMed] [Google Scholar]
- 29.Kraegen EW, Cooney GJ, Ye J, Thompson AL. Triglycerides, fatty acids and insulin resistance—hyperinsulinemia. Exp Clin Endocrinol Diabetes 2001;109:S516–S526 [DOI] [PubMed] [Google Scholar]
- 30.Kelley DE, Goodpaster BH. Skeletal muscle triglyceride. An aspect of regional adiposity and insulin resistance. Diabetes Care 2001;24:933–941 [DOI] [PubMed] [Google Scholar]
- 31.Kotani K, Peroni OD, Minokoshi Y, Boss O, Kahn BB. GLUT4 glucose transporter deficiency increases hepatic lipid production and peripheral lipid utilization. J Clin Invest 2004;114:1666–1675 [DOI] [PMC free article] [PubMed] [Google Scholar]
- 32.Mingrone G, Rosa G, Di Rocco P, et al. Skeletal muscle triglycerides lowering is associated with net improvement of insulin sensitivity, TNF-alpha reduction and GLUT4 expression enhancement. Int J Obes Relat Metab Disord 2002;26:1165–1172 [DOI] [PubMed] [Google Scholar]
- 33.Armoni M, Harel C, Bar-Yoseph F, Milo S, Karnieli E. Free fatty acids repress the GLUT4 gene expression in cardiac muscle via novel response elements. J Biol Chem 2005;280:34786–34795 [DOI] [PubMed] [Google Scholar]
- 34.Carvalho E, Kotani K, Peroni OD, Kahn BB. Adipose-specific overexpression of GLUT4 reverses insulin resistance and diabetes in mice lacking GLUT4 selectively in muscle. Am J Physiol Endocrinol Metab 2005;289:E551–E561 [DOI] [PubMed] [Google Scholar]
- 35.Shintani M, Nishimura H, Yonemitsu S, et al. Troglitazone not only increases GLUT4 but also induces its translocation in rat adipocytes. Diabetes 2001;50:2296–2300 [DOI] [PubMed] [Google Scholar]
- 36.Im SS, Kwon SK, Kang SY, et al. Regulation of GLUT4 gene expression by SREBP-1c in adipocytes. Biochem J 2006;399:131–139 [DOI] [PMC free article] [PubMed] [Google Scholar]
- 37.Marchesini G, Bugianesi E, Forlani G, et al. Nonalcoholic fatty liver, steatohepatitis, and the metabolic syndrome. Hepatology 2003;37:917–923 [DOI] [PubMed] [Google Scholar]
- 38.Browning JD, Szczepaniak LS, Dobbins R, et al. Prevalence of hepatic steatosis in an urban population in the United States: impact of ethnicity. Hepatology 2004;40:1387–1395 [DOI] [PubMed] [Google Scholar]
- 39.Yu S, Matsusue K, Kashireddy P, et al. Adipocyte-specific gene expression and adipogenic steatosis in the mouse liver due to peroxisome proliferator-activated receptor gamma1 (PPARgamma1) overexpression. J Biol Chem 2003;278:498–505 [DOI] [PubMed] [Google Scholar]
- 40.Shimano H, Horton JD, Shimomura I, Hammer RE, Brown MS, Goldstein JL. Isoform 1c of sterol regulatory element binding protein is less active than isoform 1a in livers of transgenic mice and in cultured cells. J Clin Invest 1997;99:846–854 [DOI] [PMC free article] [PubMed] [Google Scholar]
- 41.Thimmulappa RK, Mai KH, Srisuma S, Kensler TW, Yamamoto M, Biswal S. Identification of Nrf2-regulated genes induced by the chemopreventive agent sulforaphane by oligonucleotide microarray. Cancer Res 2002;62:5196–5203 [PubMed] [Google Scholar]
- 42.Song MY, Kim EK, Moon WS, et al. Sulforaphane protects against cytokine- and streptozotocin-induced beta-cell damage by suppressing the NF-kappaB pathway. Toxicol Appl Pharmacol 2009;235:57–67 [DOI] [PubMed] [Google Scholar]
- 43.Merrell MD, Jackson JP, Augustine LM, et al. The Nrf2 activator oltipraz also activates the constitutive androstane receptor. Drug Metab Dispos 2008;36:1716–1721 [DOI] [PMC free article] [PubMed] [Google Scholar]
- 44.Yu Z, Shao W, Chiang Y, et al. Oltipraz upregulates the nuclear factor (erythroid-derived 2)-like 2 [corrected](NRF2) antioxidant system and prevents insulin resistance and obesity induced by a high-fat diet in C57BL/6J mice. Diabetologia 2011;54:922–934 [DOI] [PubMed] [Google Scholar]
- 45.Tanaka Y, Aleksunes LM, Yeager RL, et al. NF-E2-related factor 2 inhibits lipid accumulation and oxidative stress in mice fed a high-fat diet. J Pharmacol Exp Ther 2008;325:655–664 [DOI] [PubMed] [Google Scholar]
- 46.Chartoumpekis DV, Ziros PG, Psyrogiannis AI, et al. Nrf2 represses FGF21 during long-term high-fat diet–induced obesity in mice. Diabetes 2011;60:2465–2473 [DOI] [PMC free article] [PubMed] [Google Scholar]
- 47.Safdar A, deBeer J, Tarnopolsky MA. Dysfunctional Nrf2-Keap1 redox signaling in skeletal muscle of the sedentary old. Free Radic Biol Med 2010;49:1487–1493 [DOI] [PubMed] [Google Scholar]


