Abstract
Most cardiovascular diseases need to be treated by more than a simple drug and the use of combination products diminishes noncompliance. Advicor® as a combination product of a vitamin and a fat lowering agent has no monograph in official pharmacopeias for its quality control purposes. In this study, first and third derivative signals for NA and LV quantitation at the two pairs of wavelengths, 261 and 273 nm; 245 and 249 nm were monitored with the addition of standard solutions of NA or LV, respectively. The limits of detection were 0.03 and 0.32 mg/L for LV and NA, respectively. The limits of quantitation were 0.09 and 0.78 mg/L for LV and NA, respectively. RSD% for both interday and intraday precision was lower than 2.6 and 2.7% for LV and NA, respectively. Selectivity of the method was assessed for both degradation products produced in stress conditions and common excipients that may present in the pharmaceutical dosage forms. The recommended procedure was successfully applied to real samples.
Keywords: Lovastatin, Niacin, Spectrophotometry, Derivative spectrum, HPSAM
INTRODUCTION
Lovastatin (LV) is a cholesterol-lowering drug isolated from a Monascus and a strain of Aspergillus terreus, which competitively inhibits the biosynthesis of mevalonic acid by HMG-CoA reductase(1). Niacin (NA) is a lipid-lowering drug known for decades, which has recently attracted renewed interest, first because it is currently the most potent drug increasing HDL-cholesterol, and secondly, because it has recently been found to induce regression of atherosclerosis as measured by carotid intima-media thickness in patients with coronary heart disease(2). The combination of a statin with NA can be an attractive option because both have excellent records of improving cardiovascular outcomes and can effectively correct all abnormalities of atherogenic dyslipidemia in patients with diabetes. A combination product containing extended-release NA and LV (Advicor®; Abbott Pharmaceutical Co., USA) is approved for the treatment of dyslipidemia(3,4). Over the last few years much attention has been paid in developing chromatographic, capillary electrophoresis (CE), and ion-exchange chromatographic methods for NA determination and its metabolites in human plasma and food(5–10). For determination of LV in human plasma or pharmaceutical formulations, spectrophotometric and HPLC methods has been published(11–14). However UV-spectrophotometry methods have been reported for the quantitative determination of LV and simvastatin(11), or LV and antioxidants combinations(15). According to our knowledge, no method for determination of NA and LV in combination products appears to be reported. Simultanous determination of these two constituents without any preliminary procedure, especially considering that the amount of one ingredient (NA) is about 25 to 50 times more than the other (LV), would be of great importance. In 1988, Bosch Reig and Campins Falco delineated the fundamentals of H-point standard addition method (HPSAM)(16,17) with which two species with mostly or even totally overlapping spectra can be determined. HPSAM is used where the error resulting from the presence of a direct interference in the presence of an analyte is transformed into a systematic error. This error can then be evaluated and eliminated. Therefore HPSAM can determine the two components in a binary system(16,18). High versatility and applicability of HPSAM has been documented(19–22). This work describes a novel, simple, inexpensive and accurate method for deter-mination of LV and NA in their combinations.
MATERIALS AND METHODS
Reagents
All reagents used were of analytical grade. Double distilled water was used throughout. LV and NA were kindly donated by Daru Pakhsh Pharmaceutical Co., Iran. Methanol, sodium hydroxide, and hydrochloric acid, were purchased from Merck, Darmstadt Co., Germany. Advicor® tablet manufactured by Abbott Pharmaceutical Co. was purchased from local market. Advicor® is supplied as unscored capsule shaped tablets containing different amounts of NA and LV as their contents have been summarized in Table 1.
Table 1.
Advicor® tablet products with their labeled niacin and lovastatin contents.

Apparatus
A Perkin-Elmer Lambda 25 double beam UV-Vis spectrophotometer with 1 cm quartz cells with a fixed slit width (2 nm) connected to a PC computer loaded with UV-Win Lab Software equipped with a HP 1200 printer was used for absorbance measurements and treatment of data.
Standard solutions preparation and calibration
LV and NA stock standards (1000 mg/L) were prepared by dissolving 10.0 mg of each compound in 10 ml of methanol. The working standards were prepared by dilution of the stock standards with methanol. To determine optimum pairs of wavelengths (WLs) applicable for HPSAM, working standards of 50 mg/L and 1 mg/L of NA and LV were prepared respectively. For measurement of NA and LV contents of commercially available tablets, working solutions consisting of 25-75 mg/L of NA and 1-3 mg/L of LV were prepared from stock solutions.
All solutions were prepared freshly and protected from light. Standard solutions containing 25 mg/L NA and 1 mg/L LV were tested for stability during the actual analysis. All measurements were performed at room temperature.
Selection of wavelength couples
The first and third derivative spectra of the working solutions were recorded against blank (methanol) at 200 to 700 nm. Then the first and third derivative signals were measured at 261 and 273 nm (when standard NA solutions were added) or at 245 and 249 nm (when standard LV solutions were added) for NA and LV, respectively, and the H-point determining graphs were obtained. The magnitudes of CH and (dA/dλ)H were obtained from the point of intersection of the two straight lines plotted for each H-point determining graph.
Validation
Specificity of the method was evaluated for both probable interferences of excipients that are present in the dosage form and the degradation products which may appear in the product during storage. To measure interferences from degradation products, standard solutions of NA or LV with final concentration of 25 or 1 mg/L, respectively, were refluxed in HCl 0.1 N and NaOH 0.1 N as chemical stress condition that may produce degradation products faster than normal conditions. The probable interferences of the degradation products with parent molecules analysed by the developed method were assessed. The linearity of the methods were evaluated by calibration curves ranging from 1-120 mg/L and 0.1-25 mg/L (n=5) of the NA and LV, respectively.
Accuracy, recovery, precision, LOD, and LOQ were evaluated by standard procedures. LOD was calculated as LOD= X̄ + 3 SCH where, X̄ is the average concentration calculated from calibration curve of HPSAM for 25 blank solutions (NA blank contained all ingredients except NA), and SCHis the standard deviation of 25 replicated measurements of blank with HPSAM(23).
Pharmaceutical dosage form analysis
For the analysis of real samples, four com-mercially available tablets (Advicor®) containing NA and LV were weighed, ground and a certain amount of ground tablets was dissolved in the methanol. The resultant solution was then filtered. A 5 ml sample of the prepared solution containing NA and LV (diluted to 100 ml) was analyzed (n=3) using the proposed method.
RESULTS
Spectra of NA and LV in dimethylformamide, acetonitrile, ethanol, chloroform, dichloro-methane, methanol, and water showed that methanol with sufficient solubility for both drugs and UV cut off point lower than 210 nm is an appropriate solvent and therefore used throughout this study.
Zero, first, and third derivative spectra
The Zero, first and third derivative spectra of NA and LV are shown in Fig. 1.
Fig. 1.
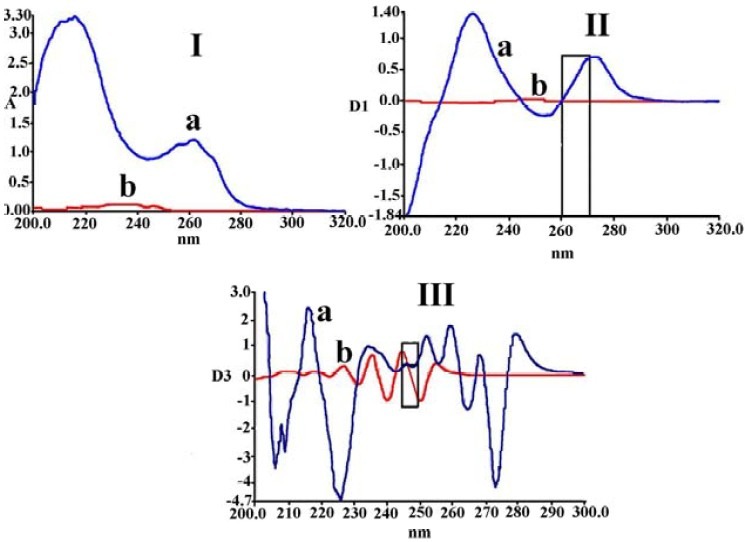
Different orders of derivation of NA and LV, I) Zero order derivative spectra of a: NA (50 mg/L) and b: LV (1 mg/L); II) first derivative spectra of a: NA (50 mg/L) and b: LV (1 mg/L); III) third derivative spectra of a: NA (50 mg/L) and b: LV (1 mg/L).
Application of HPSAM for determination of NA and LV
HPSAM applied for determination of NA at first derivation and LV at third derivation spectra to avoid any preliminary separation process. Results of applying HPSAM for determination of NA are shown in Figs. 2 and 3. In Fig. 2, determination of NA has been evaluated by addition of standard solutions of NA using the selected wavelengths (261 and 273 nm) at first derivative spectra.
Fig. 2.
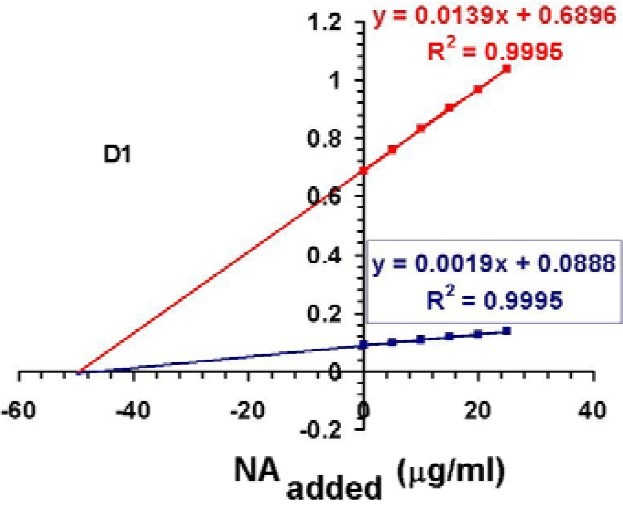
Plots of H-point standard addition method for determination of NA (50 mg/L) in the presence of LV (1 mg/L) when different standard NA solutions (5, 10, 15, 20, and 25 mg/L) were added.
Fig. 3.

Plots of H-point standard addition method for a) fixed LV concentration (1 mg/L) and different concentrations of NA; and b) fixed NA concentration (50 mg/L) and different concentrations of LV. Standard additions are performed by NA standards.
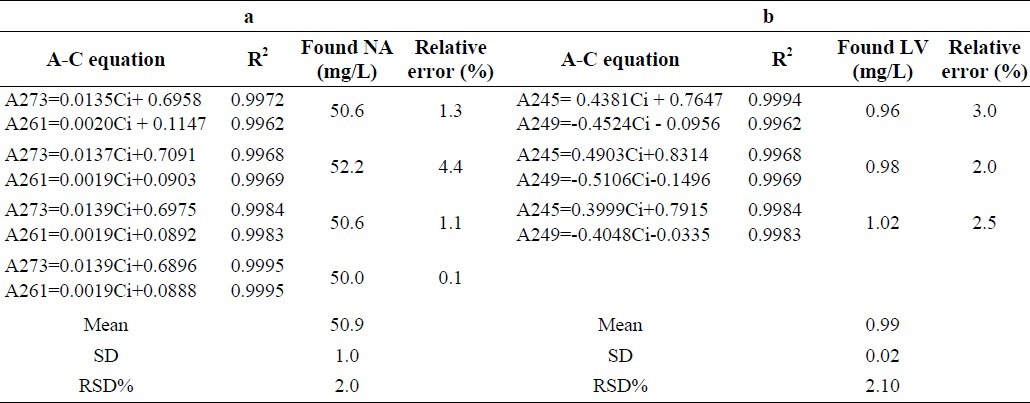
To evaluate HPSAM in determination of NA, different standard NA solutions were added to the fixed initial concentration of LV and NA solutions. In the first three set of samples, to the initial fixed amounts of NA and LV (LV concentration was kept fixed in all three set of samples while NA was used with three different initial levels), standard solutions of NA were added (Fig. 3a), whereas in the second two set of samples, to the initial fixed amounts of NA and LV, (in these sets, LV was used at two levels and NA was kept fixed), standard solutions of NA were added (Fig. 3b). LV was determined by measuring the amplitudes of the third derivative spectra at 245 and 249 nm, and applying the results as shown in Figs. 4 and 5. The plot of HPSAM was constructed by standard addition of LV to standard solution mixtures of LV and NA. Developed method was evaluated in terms of the linearity, precision, and accuracy. Obtained line equations at two wavelengths of 273 and 261 nm for NA and 249 and 245 nm for LV determination, linearity parameters and calculated concentrations based on the related equations are summarized in Table 2. In Table 3, results of linear equations, accuracy (by means of Error %) and precision (by means of RSD %) are summarized.
Fig. 4.
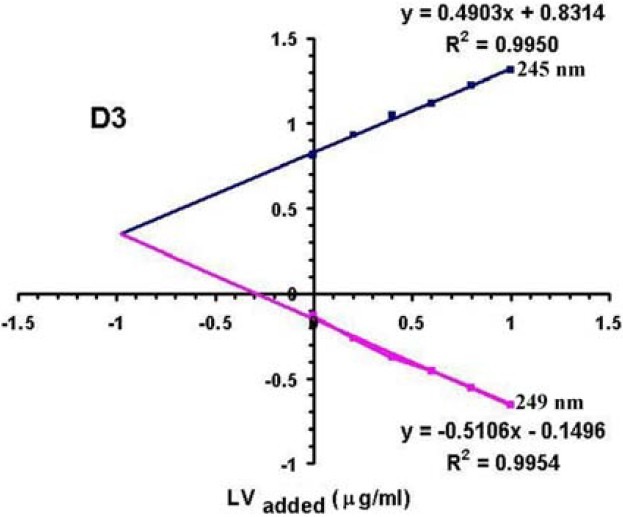
Plots of H-point standard addition method for determination of LV (1 mg/L) in the presence of NA (50 mg/L) when different standard LV solutions (0.2, 0.4, 0.6, 0.8, and 1 mg/L) are added.
Fig. 5.
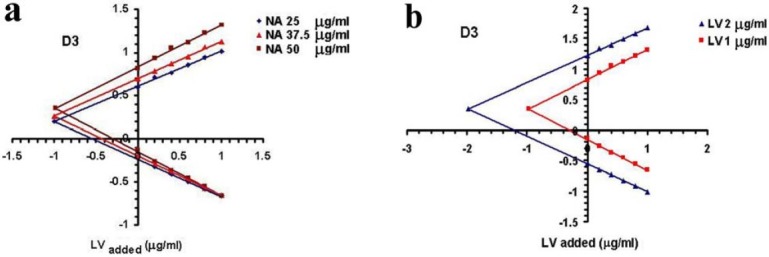
Plots of H-point standard addition method for a) fixed LV concentration (1 mg/L) and different concentrations of NA; and b) fixed NA concentration (50 mg/L) and different concentrations of LV. Standard additions are performed with LV standards.
Table 2.
Results of determination of NA in a) different concentration ratios of NA-LV and b) LV in different concentration ratios of NA-LV mixtures

Table 3.
Results of four replicate experiments for the analysis of a) NA, 50 mg/L in the presence of LV, 1 mg/L, and b) LV, 1 mg/L in the presence of NA, 50 mg/L.
Determination of NA and LV concentrations in commercial tablets
To determine NA and LV in real samples of Advicor®, developed methods were applied, and the results are given in Table 3.
DISCUSSION
Zero, first, and third derivative spectra
In Fig. 1-I, as revealed by the absorbance spectra, HPSAM cannot be applied with sufficient efficiency for the simultaneous determination of LV and NA. This is due to the high overlap between the two zero-order derivative spectra. According to Reig and Falco(16), there aren’t any couples of wavelengths in normal spectrum of NA where the absorbances in the spectrum of LV are constant. Therefore, to quantify NA in NA-LV mixtures by HPSAM, we tried to find pairs of WLs needed in the higher orders of derivative spectra. Fig. 1-II depicts many pairs of WLs showing the same D1 for LV and different D1 for NA. In order to obtain the highest possible accuracy, the maximum possible D1 differences at the two wavelengths for the NA must be considered(24). One pair of WLs which appear to be optimal is 261 and 273 nm when standard solutions of NA are added. Third derivative spectra were used for LV quantification in the presence of high amount of NA (Fig. 1-III). As illustrated in Fig. 1, spectra were suitably resolved, and it is possible to find two wavelengths with different D3s for LV and constant D3s for NA. Wavelengths of 245 nm and 249 nm were used when standard solutions of LV were added to determine LV at low concentrations of 1 or 2 mg/L in the presence of NA with high concentrations.
It should be noticed that, as revealed by the absorbance spectra (Fig. 1-I), it was possible to quantify NA at 262 nm without any interference from LV, while it was impossible to quantify LV in the presence of NA even by HPSAM. The main aim of this study was to develop generalized HPSAM for the simultaneous determination of NA and LV, as reported by other researchers for similar situations where one ingredient could be determined directly, but HPSAM was developed for both ingredients(24).
Applying HPSAM first derivative spectro-photometry for determination of NA
Figs. 3a and 3b clearly show the effect of changes in the concentration of NA and LV on the position of H-point. As shown in this figure, the value of (dA/dλ)H is independent of the amounts of NA in the samples.
Results showed that the method has a good linear relationship in the range of 1-120 mg/L (r2=0.998) between concentration of added standard solutions and D1 with high accuracy (error% <4.4) and acceptable precision (RSD%< 2) (Table 3). The corresponding values of LOD and LOQ obtained for NA were 0.32 and 0.78 mg/L, respectively.
Applying HPSAM third derivative spectrophotometry for determination of LV
As illustrated in Fig. 4, CH is independent of the concentration of interferent and AHis also independent of the analyte concentration. Fig. 5 clearly shows the effect of change in concentration of LV and NA on the position of H-point.
This method was also evaluated for linearity, repeatability, reproducibility and accuracy (Table 2). Results showed that the method has a good linear relationship in the range of 0.1-34 mg/L (r2=0.995) between concentration of added standard solutions and D3 with high accuracy (error% <3) and acceptable precision (RSD % < 2.1) (Table 3).
LOD and LOQ calculated by the same method as NA were found to be 0.03 and 0.09 mg/L, respectively.
Interference studies
Some substances supposed to be present in pharmaceuticals were tested for their possible interferences. Absorbance, D1, and D3 changes of a solution containing NA (50.0 mg/L) and LV (2.0 mg/L) were analyzed. A species was considered as an interferent when its presence produced a CH. The following excipients did not interfere with the maximum tested concentrations (NA: 50 mg/L; LV: 2 mg/L. Starch (18%), calcium carbonate (45%), Hypromellose (4.6%), microcrystalline cellulose (27%), Tween 80 (1.8%), colloidal silicone dioxide (1.8%), magnesium stearate (0.9%), and Opadry (0.9%). The specificity of the method was also investigated by observing any interferences resulting from the degradation products that may have been produced in chemical stress conditions. The spectra of refluxed solution at different times up to 240 min showed that absorbance of NA solutions in 0.1 N HCl were increased probably due to the evaporation of its water, while the shapes of the spectra were not changed. The spectra amplitudes of NA in 0.1 N NaOH were decreased, although similar to NA solusions, the shapes of the spectra remained unchanged. It can be concluded that NA was not degraded in the acidic and alkaline solutions and therefore the proposed HPSAM is applicable for long term studies of NA-containing products. Similar conditions were applied to LV solutions in 0.1 N HCl and 0.1 N NaOH solutions, respectively. The spectra of the refluxed solutions at different times showed that absorbance of both acidic and alkaline LV solutions were decreased probably due to the degradation of LV. However, probable degradation products do not interfere with the proposed method. The results suggest this method can be used in stability studies as a stability indicating method.
Determination of NA and LV concentrations in commercial tablets
The proposed method was applied to determine NA and LV in commercially available tablets. The quantitative results of this analysis are summarized in Table 4. As it is shown, NA and LV can be determined with satisfactory accuracy and precision in pharmaceutical preparations.
Table 4.
Results for NA and LV quantification in pharmaceutical samples.

CONCLUSION
The literature compilation has revealed that there isn’t any method reported for analysis of NA and LV in combined pharmaceutical preparations. Proposed method was simple and reliable for simultaneous determination of NA and LV even in the presence of different excipients with good accuracy and precision, either in laboratory prepared samples or in pharmaceutical dosage forms. Finally, it was concluded that the short analysis time and low costs are the main advantages of these two HPSAM-derivative spectrophotometric methods for determination of NA and LV in routine analysis. High percentage recovery shows that the methods are free from interferences from the excipients commonly used in the formulations of drugs. Although HPSAM has been used for a long time in pharmaceutical analysis, this procedure is still simple and applicable in routine laboratory tasks.
REFERENCES
- 1.Li M, Fan L-Y, Zhang W, Sun J, Cao C-X. Quantitative analysis of lovastatin in capsule of Chinese medicine Monascus by capillary zone electrophoresis with UV-vis detector. J Pharm Biomed Anal. 2007;43:387–392. doi: 10.1016/j.jpba.2006.07.003. [DOI] [PubMed] [Google Scholar]
- 2.Westphal S, Borucki K, Taneva E, Makarova R, Luley C. Extended-release niacin raises adiponectin and leptin. Atherosclerosis. 2007;193:361–365. doi: 10.1016/j.atherosclerosis.2006.06.028. [DOI] [PubMed] [Google Scholar]
- 3.Xydakis AM, Ballantyne CM. Combination therapy for combined dyslipidemia. Am J Cardiol. 2002;90:21–29. doi: 10.1016/s0002-9149(02)02968-5. [DOI] [PubMed] [Google Scholar]
- 4.Toth PP. High-density lipoprotein as a therapeutic target: Clinical evidence and treatment strategies. Am J Cardiol. 2005;96:50–58. doi: 10.1016/j.amjcard.2005.08.008. [DOI] [PubMed] [Google Scholar]
- 5.Wang Y, Song M, Hang T, Wen A, Yang L. LC-MS–MS simultaneous determination of niacin, niacinamide and nicotinuric acid in human plasma LC-MS–MS and its application to a human pharmacokinetic study. Chromatographia. 2010;72:245–253. [Google Scholar]
- 6.Pegg RB, Landen WO, Eitenmiller RR. Nielsen SS, editor. Vitamin Analysis. Food Analysis: Springer US. 2010:179–200. [Google Scholar]
- 7.Nisha P, Singhal RS, Pandit AB. A study on degradation kinetics of niacin in potato (Solanum tuberosum L.) J Food Comp Anal. 2009;22:620–624. [Google Scholar]
- 8.Pfuhl P, Kärcher U, Häring N, Baumeister A, Tawab MA, Schubert-Zsilavecz M. Simultaneous determination of niacin, niacinamide and nicotinuric acid in human plasma. J Pharm Biomed Anal. 2005;36:1045–1052. doi: 10.1016/j.jpba.2004.08.033. [DOI] [PubMed] [Google Scholar]
- 9.Juraja SM, Trenerry VC, Millar RG, Scheelings P, Buick DR. Asia Pacific food analysis network (APFAN) training exercise: the determination of niacin in cereals by alkaline extraction and high performance liquid chromatography. J Food Comp Anal. 2003;16:93–106. [Google Scholar]
- 10.Windahl KL, Trenerry VC, Ward CM. The determination of niacin in selected foods by capillary electrophoresis and high performance liquid chromatography: acid extraction. Food Chem. 1999;65:263–270. [Google Scholar]
- 11.Sharaf El-Din MMK, Attia KAM, Nassar MWI, Kaddah MMY. Colorimetric determination of simvastatin and lovastatin in pure form and in pharmaceutical formulations. Spectrochim Acta A: Mol Biomol Spectrosc. 2010;76:423–428. doi: 10.1016/j.saa.2010.04.015. [DOI] [PubMed] [Google Scholar]
- 12.Yuan H, Wang F, Tu J, Peng W, Li H. Determination of lovastatin in human plasma by ultra-performance liquid chromatography-electrospray ionization tandem mass spectrometry and its application in a pharmacokinetic study. J Pharm Biomed Anal. 2008;46:808–813. doi: 10.1016/j.jpba.2007.12.005. [DOI] [PubMed] [Google Scholar]
- 13.Conley JM, Symes SJ, Kindelberger SA, Richards SM. Rapid liquid chromatography-tandem mass spectrometry method for the determination of a broad mixture of pharmaceuticals in surface water. J Chromatogr A. 2008;1185:206–215. doi: 10.1016/j.chroma.2008.01.064. [DOI] [PubMed] [Google Scholar]
- 14.Damić M, Nigović B. Fast Analysis of Statins in Pharmaceuticals by MEKC. Chromatographia. 2010;71:233–240. [Google Scholar]
- 15.Markopoulou CK, Koundourelllis JE. Two derivative spectrophotometric methods for the simultaneous determination of lovastatin combined with three antioxidants. J Pharm Biomed Anal. 2003;33:1163–1173. doi: 10.1016/s0731-7085(03)00429-1. [DOI] [PubMed] [Google Scholar]
- 16.Reig FB, Falco PC. H-point standard additions method. Part 1. Fundamentals and application to analytical spectroscopy. Analyst. 1988;113:1011–1016. [Google Scholar]
- 17.Pouretedal H, Asefi M. H-point Standard Addition Method for Simultaneous Determination of Cobalt (II) and Zinc (II) Ions. J Iranian Chem Soc. 2007;4:503–509. [Google Scholar]
- 18.Bosch Reig F, Campins Falco P. H-point standard-additions method. Fundamentals and application to analytical spectroscopy. Reply. Analyst. 1990;115:112–113. [Google Scholar]
- 19.Hajian R, Shams N, Rad A. Application of h-point standard addition method for simultaneous spectrophotometric determination of hydrochloro-thiazide and propranolol. J Braz Chem Soc. 2009;20:860–865. [Google Scholar]
- 20.Shahlaei M, Gholivand M, Pourhossein A. Simultaneous Determination of Tyrosine and Histidine by Differential Pulse Cathodic Stripping Voltammetry Using H-point Standard Addition Method in Tap and Seawater. Electroanalysis. 2009;21:2499–2502. [Google Scholar]
- 21.El-Sherbiny D, El-Wasseef D, Abd El-Ghaffar M, El-Ashry S. Simultaneous determination of ritodrine and isoxsuprine using coupling technique of synchronous fluorimetry and h-point standard addition method. J Fluores. 2010;20:251–260. doi: 10.1007/s10895-009-0547-y. [DOI] [PubMed] [Google Scholar]
- 22.Bordbar M, Yeganeh-Faal A, Ghasemi J, Ahari-Mostafavi M, Sarlak N, Baharifard M. Simultaneous spectrophotometric determination of minoxidil and tretinoin by the H-point standard addition method and partial least squares. Chem Papers. 2009;63:336–344. [Google Scholar]
- 23.Givianrad MH, Saber-Tehrani M, Aberoomand-Azar P, Mohagheghian M. H-point standard additions method for simultaneous determination of sulfamethoxazole and trimethoprim in pharmaceutical formulations and biological fluids with simultaneous addition of two analytes. Spectrochim Acta A: Mol Biomol Spectrosc. 2011;78:1196–1200. doi: 10.1016/j.saa.2010.12.082. [DOI] [PubMed] [Google Scholar]
- 24.Lakshmi KS, Lakshmi S. Simultaneous spectro-photometric determination of valsartan and hydrochlorothiazide by H-point standard addition method and partial least squares regression. Acta Pharmaceutica. 2011;61:37–50. doi: 10.2478/v10007-011-0007-5. [DOI] [PubMed] [Google Scholar]


