

Abstract
Purpose
We engineered a flexible fiber-optic microendoscope for longitudinal optical imaging studies in a mouse model of disseminated ovarian cancer.
Procedures
The microendoscope delivers 470 nm excitation light from a light-emitting diode through a fiber-optic bundle with outer diameter of 680 μm. Optics were optimized to maximize power and lateral resolution. We used this instrument to repetitively monitor intraperitoneal growth of HeyA8 ovarian cancer cells stably transduced with green fluorescent protein (GFP) over 4 weeks.
Results
The microendoscope achieves 0.7 mW power and lateral resolution of 4 μm. Initial in vivo imaging studies visualized single cells and small clusters of malignant cells with subsequent studies showing tumor masses and vasculature. We also resolved single cells within intraperitoneal tumor masses.
Conclusions
These studies establish microendoscope technology with single cell resolution for minimally-invasive, longitudinal imaging in living animals. This technology will advance future molecular imaging studies of ovarian cancer and other diseases.
Keywords: Confocal, microscopy, fluorescence, in vivo, LED, fiber bundle, small animal imaging, ovarian cancer, xenograft, Zemax®
Introduction
Intra-vital microscopes are extremely powerful tools for performing in vivo cellular and molecular imaging in small animal models [1]. Unlike whole body imaging techniques that detect light remotely [2], intra-vital microscopy allows monitoring of signal transduction and cell functions at single cell or even sub-cellular resolution. Microscopic imaging can be performed repetitively in mice to observe disease development and/or response to therapy over time if instruments are sufficiently small in dimension. A key benefit of longitudinal imaging is that each animal can be used as its own control, thus significantly reducing the numbers needed to achieve statistical validity [3]. Although repetitive intra-vital imaging has been performed using surgically-implanted optical windows, this approach is highly invasive and is limited to imaging superficial structures [4]. Furthermore, objectives on conventional microscopes used for intra-vital imaging are bulky and require wide exposure, often necessitating terminal procedures rather than serial studies [5,6].
Recently, inexpensive but powerful LEDs have become available in a wide range of colors, providing a Lambertian radiation pattern that delivers a relatively uniform beam to individual fibers over the face of a bundle and eliminates the need for a scanning mechanism. This simple approach has been demonstrated previously to achieve a robust, low-cost confocal system using charge-coupled device (CCD) imaging [7–8]. A longitudinal study using this type of instrument to monitor tumor response to therapy in two imaging sessions over a span of 5 days was recently demonstrated, albeit using a more expensive electron-multiplying CCD (EMCCD) camera [9].
In this study, we developed an optical model to improve the system design parameters to maximize light throughput, allowing for use of smaller caliber optical bundles with more output power. This new system provides greater sensitivity for fluorescence detection using a lower-cost CCD camera, while minimizing trauma to the animal. To test this instrument for in vivo imaging, we established ovarian cancer cells stably transduced with green fluorescent protein (GFP) and used these cells in a mouse model of disseminated, intraperitoneal ovarian cancer. The smaller size of the microendoscope allowed for repetitive imaging studies to monitor tumor growth deep within living animals over a longer time span than previously demonstrated.
Materials and Methods
System Design
A schematic of the imaging system is shown in Fig. 1. A LED light source (Luxeon K2, Philips Lumileds, San Jose, CA) produces emission centered at 470 nm with a spectral bandwidth of 25 nm at full-width-half-max (FWHM) with a power of 21 lumens [10]. A 488 nm short pass filter (SPF, Semrock FF01-518/SP-25) is used to limit the excitation bandwidth. An aspheric lens collimates the beam onto the back aperture of an infinity-corrected objective lens (Olympus UIS2 PLN 20X, Tokyo, Japan) after reflection by a 495 nm dichroic beamsplitter (Semrock FF495-Di02-25x36). The flexible optical fiber bundle (Sumitomo IGN-06/17, Osaka, Japan) has ~17,000 individual fibers with NA = 0.35, a core diameter of 2.4 μm, and core-to-core spacing of ~4 μm. The outer diameter is 680 μm, the diameter of the active optical area is 540 μm, and the length is 2.1 m. The fluorescence image is transferred back through the bundle through the objective and dichroic and focused by a condenser onto a CCD camera (Photometrics CoolSnapEZ, Tucson, AZ). A 500 nm long-pass filter (LPF, Semrock BLP01-488R-25) blocks the reflected excitation light. The distal face of the fiber bundle (Fig. 1, inset) is polished using 5-, 3-, and 1-μm grit paper using a custom chuck that keeps the bundle flat.
Fig. 1.

Schematic excitation from LED at 470 nm is collimated by asphere, reflected by a dichroic beamsplitter, and focused into a 680 μm (O.D.) coherent fiber bundle. Fluorescence is transmitted to the CCD. The distal end of fiber (inset) is placed into contact with the tissue.
Optical model
We developed an optical model to optimize the system parameters for coupling the LED source into the fiber bundle. We use a 20X objective lens (NA = 0.4, f = 9 mm) to closely match the NA of the fiber bundle. The condenser contains the image of the active area on the proximal face of the fiber bundle within the surface area of the CCD detector. In order to achieve this requirement, the relay magnification must meet the condition M ≤ WCCD/Dfb, where WCCD is the dimension of the CCD and Dfb is the active diameter of the fiber bundle. The CCD array has dimensions of 8.98 × 6.71 mm, and Dfb = 540 μm, so Mmax = 12.4. In order to optimally fill the CCD, we chose an off-the-shelf condenser lens with f = 100 mm, providing a relay magnification M = 11.1. The CCD pixels are square with a dimension of 6.45 μm, and with magnification, the core spacing of the image of the bundle face on the CCD is ~44 μm. Thus, the system resolution is limited by the core spacing of fibers in the bundle rather than by the pixels of the CCD detector.
Light from the LED is produced by a square die with dimensions of 1 mm × 1 mm and is emitted with a FWHM angle of ~150 deg [10]. We designed a telescopic lens system to effectively couple light that emerges with this high divergence angle into the fiber bundle. An asphere provides a larger effective aperture than a comparable spherical lens. We developed an optical model in Zemax® to simulate the intensity after the fiber bundle to optimize the parameters L1, L2, and L3. The transmission of light through the various components of the system is addressed by this model in four areas: 1) Only rays incident within the clear aperture of the asphere are collected; 2) Light transmitted by the objective is determined by the dimension of the back aperture; 3) Light captured by the bundle is determined by the NA of the individual fibers; and 4) Excitation collected by the bundle is determined by the area of the LED die imaged onto the proximal face.
In vitro imaging
We used a lentiviral vector to stably transduce human HeyA8 ovarian cancer cells with GFP [11,12]. Cells were cultured in DMEM with 10% FBS. The distal end of the optical fiber bundle was positioned in direct contact with the cells. We also collected fluorescence images using a standard epifluorescence microscope (Nikon Eclipse TE2000-U). The target-background ratio was determined by dividing the mean intensity of a 10×10 pixel array from the cytoplasm of 5 cells by the average value of a 10×10 pixel array from 5 regions in between cells. The signal-to-noise ratio (SNR) was evaluated by dividing the mean intensity of a 10×10 pixel array in the cytoplasm by the standard deviation of the array, using 5 cells. All images were analyzed using NIH Image J® software.
Longitudinal in vivo imaging of tumor xenografts in mice
All animal experiments were approved by the University of Michigan Committee for Use and Care of Animals (UCUCA). We implanted 106 HeyA8-GFP cells into the peritoneal cavity of n = 10 adult female nude mice (Taconic, NCRNU-M-FHomozygousCrTac:NCr-Foxn1nu). Imaging started 1 week later and continued at weekly intervals. Mice were placed supine and administered 0.1 mg/kg buprenorphine s.c. for analgesia and 2% isoflurane via nose cone for anesthesia. The abdomen was prepared in sterile fashion. An 18G needle was passed percutaneously into the peritoneum to introduce a 16G angiocatheter. The needle was removed and the fiber-optic bundle was passed through the catheter and manipulated through the peritoneal cavity as shown in Fig. 2. Images were acquired with an exposure of 100 ms. Each imaging study lasted 5 to 10 minutes. Control images were obtained from the capsule of the liver and from the liver of a mouse not injected with tumor cells, and autofluorescence intensity was measured using NIH Image J® software. Imaging was repeated on the same cohort of mice for up to 4 weeks or until mice were euthanized due to tumor burden.
Fig. 2.
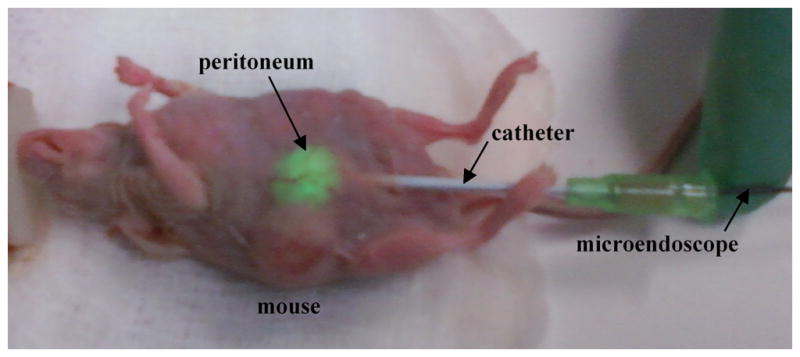
Longitudinal imaging approach. The distal tip of the microendoscope is introduced with an 18 G needle into the peritoneum through a catheter to collect fluorescence (green) from implanted HeyA8 ovarian tumor. The mice survive without need for closure of the wound.
Results
System design
We measured a field of view of 540 μm and a lateral resolution of 3.9 μm using a standard resolution target (USAF). This result is consistent with the average spacing in between the cores of the individual fibers. We measured a power of 0.70 mW of excitation light at the distal end of the fiber bundle. Since there is no lens at the distal end of the bundle, the working distance is zero.
Optical model
Based on our analysis and simulated results, we selected an asphere with fasp = 18 mm. The results of our model reveal that the excitation intensity increases with L1′ = fasp - L1, as the LED is moved away from aspheric lens along the optical axis, to a maximum value at L1′ = −3.0 mm. In order to get more accurate measurements and to compare our results directly with previously developed LED-based microendoscope systems, we used the Sumitomo IGN-08/30 fiber bundle (outer diameter 950 μm, active diameter 790 μm) that has ~30,000 individual fibers. The maximum power at the distal end of this fiber bundle was measured to be 1.7 mW at L1′ = −3.0 mm.
We also used our model to predict the output intensity of the smaller fiber bundle (O.D. 680 μm) as a function of the parameters L1′ and L2, resulting in the family of curves shown in Fig. 3. Each curve represents the simulated output as a function of L1′, given a fixed distance L2 between the asphere and the objective. The results are shown for values of L2 that range between 20 and 80 mm in increments of 10 mm. The model predicts that a maximum power of 0.9 mW can be transmitted to the distal end of the fiber bundle with L2 = 40 mm. However, due to the size of the dichroic mirror located in between the aspheric and objective lenses, the minimum distance in our system is L2 = 80 mm. From the simulation we find that a maximum power of 0.76 mW can be delivered with this parameter. We experimentally measured a value of 0.70 mW. The small difference between this result and our model can be explained by the presence of aberrations in the optical train.
Fig. 3.
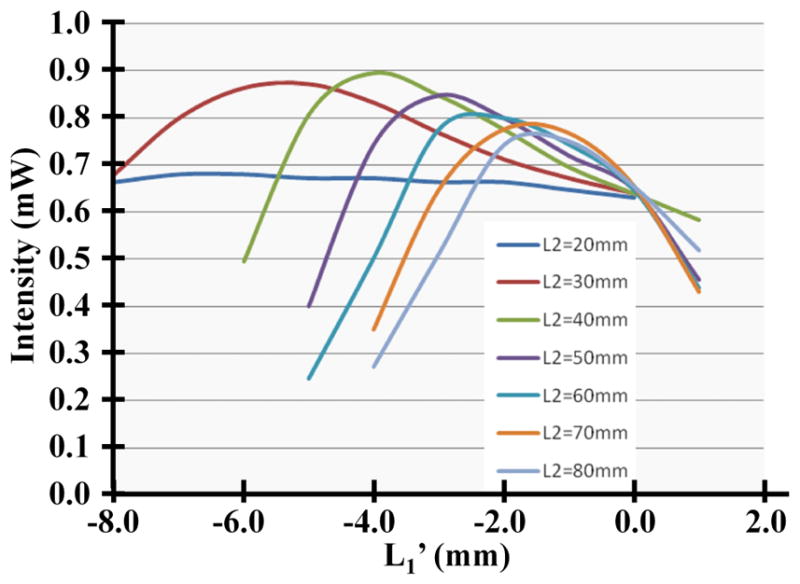
Dependence of the output intensity on L1′ and L2 from our model is shown.
In vitro validation
Images of HeyA8-GFP cells in culture collected with a bench-top epifluorescence microscope and with the microendoscope are shown in Fig. 4a and b, respectively, and demonstrate that the morphology of the single cells imaged is similar. The average target-to-background ratios for the images collected with the epifluorescence microscope and the microendoscope were found to be 6.1±2.4 and 6.9±1.7, respectively. The average SNR were found to be 41.8±14.7 and 5.9±1.0, respectively. As the image of the fiber bundle face on the CCD array after relay magnification is 44 μm, and the CCD pixels are square with a dimension of 6.45 μm, the SNR of the microendoscope can be increased by binning image pixels 2×2 without loss of resolution.
Fig. 4.
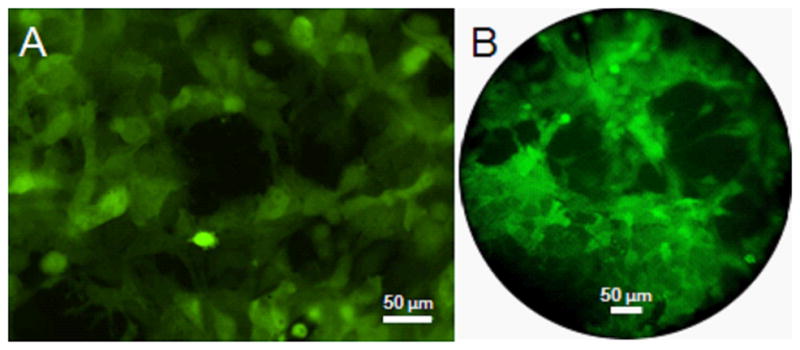
In vitro imaging. Fluorescence images of HeyA8 cells in culture collected with an a epifluorescence microscope and the b microendoscope reveal similar cellular morphology.
Longitudinal in vivo imaging of tumor xenografts in mice
No external signs of the tumor could be seen or palpated at 1 week after implantation, and single cells (arrow) could be visualized on imaging (Fig. 5a). Small masses (1 to 3 mm) were externally visible and palpable at 2 weeks, and small clusters of cells could be visualized (Fig. 5b). The mice exhibited large (>4 mm) tumors and showed evidence of weight loss at 3 weeks, and single cells could be resolved on the surface of the bulk tumor masses (Fig. 5c). Small clusters of cells were still detectable 4 weeks after implantation. Also, by inserting the microendoscope through the needle into a tumor, single cells within the mass could be visualized. Microvasculature (arrow) could also be visualized below the surface of the tumors at week 4 (Fig. 5d). After the third week, 3 of the 10 mice were euthanized due to tumor burden. The remaining 7 mice were imaged again at 4 weeks, and did not reveal additional changes in tumor morphology or distribution. All mice were euthanized after the final imaging session in week 4 due to tumor burden. Images from control mice showed minimal autofluorescence intensity, with a ratio of images in which the entire field-of-view is coated with tumor (such as the vasculature image in Fig. 5d) to control images of 4.1 ± 1.2 (data not shown).
Fig. 5.

In vivo imaging after implantation of HeyA8-GFP cells. a) Single cells (week 1). b) Small cluster of cells (week 2). c) Bulk tumor mass (week 3). d) Neovasculature detected as branching, non-fluorescent structures within a GFP-positive tumor (week 4).
Discussion
Here, we demonstrate a miniature confocal microscope that uses an LED source to collect fluorescence images with sub-cellular resolution in real-time. We developed an optical model to reduce the dimension of the fiber bundle to a size that allows for in vivo imaging with high SNR to be performed on mice in a repetitive fashion without requiring post-procedure closure of the entry-site. Recently, Muldoon et al. demonstrated an LED-based confocal microendoscope that used a fiber bundle with an outer diameter of 1.0 mm, and inserted it subcutaneously in mice in a terminal study [7]. The excitation power through this bundle was 1.0 mW. Subsequently, Zhong et al. built a system which delivered only 0.035 mW through a 1.0 mm outer diameter fiber bundle, necessitating use of a highly sensitive EMCCD to have sufficient sensitivity to detect fluorescence in vivo [9]. By comparison, our optical model helped us to achieve an output power of 1.7 mW through a bundle of comparable size, and allowed us to build an even smaller confocal microendoscope with 0.680 mm diameter and output power 0.7 mW that can pass harmlessly into the peritoneum, while using a low-cost CCD camera. Once the microendoscope is inserted into this cavity, it can be moved freely by hand to any location within this space. We also achieved high SNR at a fast frame rate of 10 Hz. This image acquisition speed is critical to minimize motion artifact, which is exaggerated in small animals due to their higher respiratory rate and larger relative lung displacement.
While imaging the same group of cells on serial sessions would be difficult, longitudinal studies can be performed by collecting representative images and drawing conclusions using statistical arguments. Moreover, histologic confirmation can be performed after euthanasia of the animal. The ability to conduct longitudinal imaging studies at the cellular level in small animals has important implications for translational research. Molecular changes are expressed in transformed cells well in advance of morphological differences, and produce targets that reveal biological function. While we used cells engineered to express GFP constitutively to demonstrate the proof-of-concept, resolution of this system is sufficient to detect changes in sub-cellular localization or expression of fluorescent reporter proteins. Since functions of many signaling molecules in ovarian cancer and other malignancies are regulated by changes in subcellular compartmentalization, this imaging technology will enable single cell analysis of signal transduction and inhibition with chemotherapeutic agents. Molecular targets in ovarian cancer or other diseases also can be detected with imaging probes, including monoclonal antibodies, peptides, and small molecules [13–16]. The small size of this instrument allows for minimally-invasive detection of molecular changes in progression of cancer and intercellular variations in signal transduction that may regulate susceptibility versus resistance to therapy. Moreover, the imaging bundle can accommodate a wide variety of LED sources, ranging in color from blue (λ = 455 nm) to red (λ = 630 nm). The flexibility to accommodate different colors of LED sources opens the opportunity to perform multi-spectral imaging of multiple molecular targets in real time in vivo, and we are developing this feature for a future study.
Conclusions
We have developed a miniature confocal microendoscope based on a LED source and flexible fiber to collect fluorescence images with sub-cellular resolution and perform longitudinal studies of tumor progression in living mice.
Acknowledgments
Research supported by NIH grants R01 CA136553, R01 CA136829, R01 CA142750, P50 CA93990, and U54 CA136429. We thank Gordon Mills, MD Anderson Cancer Center, for providing the HeyA8 ovarian cancer cells.
Contributor Information
Sakib F. Elahi, University of Michigan, Department of Biomedical Engineering, 109 Zina Pitcher Place, BSRB 1728, Ann Arbor, MI USA, 48109
Zhongyao Liu, University of Michigan, Department of Medicine, Division of Gastroenterology, 109 Zina Pitcher Place, BSRB 1728, Ann Arbor, MI USA, 48109.
Kathryn E. Luker, University of Michigan, Center for Molecular Imaging, Department of Radiology, 109 Zina Pitcher Place, BSRB A526, Ann Arbor, MI USA, 48109
Richard S. Kwon, University of Michigan, Department of Medicine, Division of Gastroenterology, 1500 E. Medical Center Dr., Taubman 3912, Ann Arbor, MI 48109-5362
Gary D. Luker, University of Michigan, Center for Molecular Imaging, Departments of Radiology and Microbiology and Immunology, 109 Zina Pitcher Place, BSRB A526, Ann Arbor, MI USA, 48109
Thomas D. Wang, University of Michigan, Department of Medicine, Division of Gastroenterology, Department of Biomedical Engineering, 109 Zina Pitcher Pl. BSRB 1522, Ann Arbor, MI 48109-2200
References
- 1.Luker GD, Luker KE. Optical imaging: current applications and future directions. J Nucl Med. 2008;49:1–4. doi: 10.2967/jnumed.107.045799. [DOI] [PubMed] [Google Scholar]
- 2.Choy G, Choyke P, Libutti SK. Current advances in molecular imaging: noninvasive in vivo bioluminescent and fluorescent optical imaging in cancer research. Mol Imaging. 2003;2:303–312. doi: 10.1162/15353500200303142. [DOI] [PubMed] [Google Scholar]
- 3.Lu S, Lowe AW, Triadafilopoulos G, Hsiung PL, Hao Y, Crawford JM, Wang TD. Endoscopic evaluation of esophago-gastro-jejunostomy in rat model of Barrett’s esophagus. Dis Esophagus. 2009;22:323–330. doi: 10.1111/j.1442-2050.2008.00909.x. [DOI] [PMC free article] [PubMed] [Google Scholar]
- 4.Skala MC, Fontanella A, Lan L, Izatt JA, Dewhirst MW. Longitudinal optical imaging of tumor metabolism and hemodynamics. J Biomed Opt. 2010;15:011112. doi: 10.1117/1.3285584. [DOI] [PMC free article] [PubMed] [Google Scholar]
- 5.Sumen C, Mempel TR, Mazo IB, von Andrian UH. Intravital microscopy: visualizing immunity in context. Immunity. 2004;21:315–329. doi: 10.1016/j.immuni.2004.08.006. [DOI] [PubMed] [Google Scholar]
- 6.Cahalan MD, Parker I. Choreography of cell motility and interaction dynamics imaged by two-photon microscopy in lymphoid organs. Annu Rev Immunol. 2008;26:585–626. doi: 10.1146/annurev.immunol.24.021605.090620. [DOI] [PMC free article] [PubMed] [Google Scholar]
- 7.Muldoon TJ, Pierce MC, Nida DL, Williams MD, Gillenwater A, Richards-Kortum R. Subcellular-resolution molecular imaging within living tissue by fiber microendoscopy. Optics Express. 2007;15:16413–16423. doi: 10.1364/oe.15.016413. [DOI] [PMC free article] [PubMed] [Google Scholar]
- 8.Muldoon TJ, Anandasabapathy S, Maru D, Richards-Kortum R. High-resolution imaging in Barrett’s esophagus: a novel, low-cost endoscopic microscope. Gastrointestinal Endoscopy. 2008;68:737–744. doi: 10.1016/j.gie.2008.05.018. [DOI] [PMC free article] [PubMed] [Google Scholar]
- 9.Zhong W, Celli JP, Rizvi I, et al. In vivo high-resolution fluorescence microendoscopy for ovarian cancer detection and treatment monitoring. Br J Cancer. 2009;101:2015–2022. doi: 10.1038/sj.bjc.6605436. [DOI] [PMC free article] [PubMed] [Google Scholar]
- 10.Philips Lumileds Lighting Company. Technical Datasheet DS51. http://www.philipslumileds.com.
- 11.Lois C, Hong EJ, Pease S, Brown EJ, Baltimore D. Germline transmission and tissue-specific expression of transgenes delivered by lentiviral vectors. Science. 2002;295:868–872. doi: 10.1126/science.1067081. [DOI] [PubMed] [Google Scholar]
- 12.Dittgen T, Nimmerjahn A, Komai S, et al. Lentivirus-based genetic manipulations of cortical neurons and their optical and electrophysiological monitoring in vivo. Proc Natl Acad Sci USA. 2004;101:18206–18211. doi: 10.1073/pnas.0407976101. [DOI] [PMC free article] [PubMed] [Google Scholar]
- 13.Goetz M, Ziebart A, Foersch S, et al. In vivo molecular imaging of colorectal cancer with confocal endomicroscopy by targeting epidermal growth factor receptor. Gastroenterology. 2010;138:435–446. doi: 10.1053/j.gastro.2009.10.032. [DOI] [PubMed] [Google Scholar]
- 14.Hsiung PL, Hardy J, Friedland S, et al. Detection of colonic dysplasia in vivo using a targeted heptapeptide and confocal microendoscopy. Nature Med. 2008;14:454–458. doi: 10.1038/nm1692. [DOI] [PMC free article] [PubMed] [Google Scholar]
- 15.Urano Y, Asanuma D, Hama Y, et al. Selective molecular imaging of viable cancer cells with pH-activatable fluorescence probes. Nature Med. 2009;15:104–109. doi: 10.1038/nm.1854. [DOI] [PMC free article] [PubMed] [Google Scholar]
- 16.Goetz M, Wang TD. Molecular imaging in gastrointestinal endoscopy. Gastroenterology. 2010;138:828–33. doi: 10.1053/j.gastro.2010.01.009. [DOI] [PMC free article] [PubMed] [Google Scholar]