Abstract
We report the strain effect of suspended graphene prepared by micromechanical method. Under a fixed measurement orientation of scattered light, the position of the 2D peaks changes with incident polarization directions. This phenomenon is explained by a proposed mode in which the peak is effectively contributed by an unstrained and two uniaxial-strained sub-areas. The two axes are tensile strain. Compared to the unstrained sub-mode frequency of 2,672 cm−1, the tension causes a red shift. The 2D peak variation originates in that the three effective sub-modes correlate with the light polarization through different relations. We develop a method to quantitatively analyze the positions, intensities, and polarization dependences of the three sub-peaks. The analysis reflects the local strain, which changes with detected area of the graphene film. The measurement can be extended to detect the strain distribution of the film and, thus, is a promising technology on graphene characterization.
Keywords: Graphene strain, Polarization Raman spectroscopy, suspended graphene, 78.67.Wj (optical properties of graphene), 74.25.nd (Raman and optical spectroscopy), 63.22.Rc (phonons in graphene)
Background
Raman and surface-enhanced Raman spectroscopy have been widely used to investigate vibration properties of materials [1-6]. Recently, they have been used as powerful technologies to characterize the phonons of graphene [7-14]. With its one to several atomic layers, graphene is the thinnest sp2 allotrope of carbon, and therefore holds many unique electrical and optical properties, interesting scientists and technologists [15-19]. The unique properties change with the number of atomic layers, defects, and dopants. These factors also affect graphene's phonon modes, and therefore, Raman spectroscopy is a useful method to reflect the variation of the properties [20-22]. In addition, Raman spectroscopy can be employed to determine strain, which modifies the characteristic of materials, such as band structure, and thus influences the performance of corresponding devices [23-25]. Recently, several groups study strain of graphene by artificially bending or stretching the film and then measuring the corresponding Raman spectra [26-30].
Methods
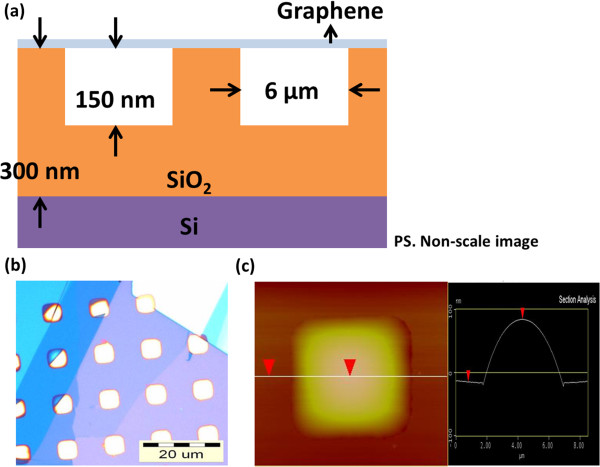
Suspended graphene are fabricated by mechanical exfoliation of graphene flakes onto the oxidized silicon wafer. First, ordered squares with areas of 6 μm2 are defined by photolithography on an oxidized silicon wafer with oxide thickness of 300 nm. Reactive ion etching is then used to etch the squares to a depth of 150 nm. Micromechanical cleavage of HOPG with scotch tape is then used to deposit the suspended graphene flakes over the indents, as shown in the schematic of Figure 1a. Optical micrograph and atomic force microscopy (AFM) image, as shown in Figure 1b,c, were used to characterize the suspended graphene. The surface of suspended graphene was bulging as indicated by AFM cross-section. The strain and defects of graphene are usually measured by Raman spectroscopy. To understand the strain of the suspended graphene, a micro-Raman microscope was used to perform Raman polarization-dependence measurements. A 532-nm frequency-doubling Nd-YAG laser serves as the excitation light source. The polarization and power of the incident light were adjusted by a half-wave plate and a polarizer. The laser power was monitored by a power meter and maintained through these measurements. The excitation laser power measured by the power meter is 8 mW. The laser power is measured on the delivered path between the polarizer and spectroscopy. After the delivery of laser light, the power of laser on the graphene surface is finally about 0.45 mW. The laser beam was focused by a ×50 objective lens (NA = 0.75) to the sample with a focal spot size of approximately 0.5 μm, representing the spatial resolution of the Raman system. The scattered radiation was collected backward with the same objective lens and polarization-selected by a polarization analyzer. Finally, the radiation was sent to a 55-cm spectrometer plus a liquid-nitrogen-cooled charge-coupled device for spectral recording. For the polarization dependent measurement, the polarization of incident (scattered) laser is controlled by the polarizer (analyzer). In the exploration, the polarization direction of the incident and scattered light are variable and fixed, respectively. The variability of polarization direction of the scattered light is 20°.
Figure 1.
Images of the suspended graphene. (a) The scheme, (b) optical image, and (c) AFM image of the suspended graphene. The AFM image included the topography and its cross-section.
Results and discussion
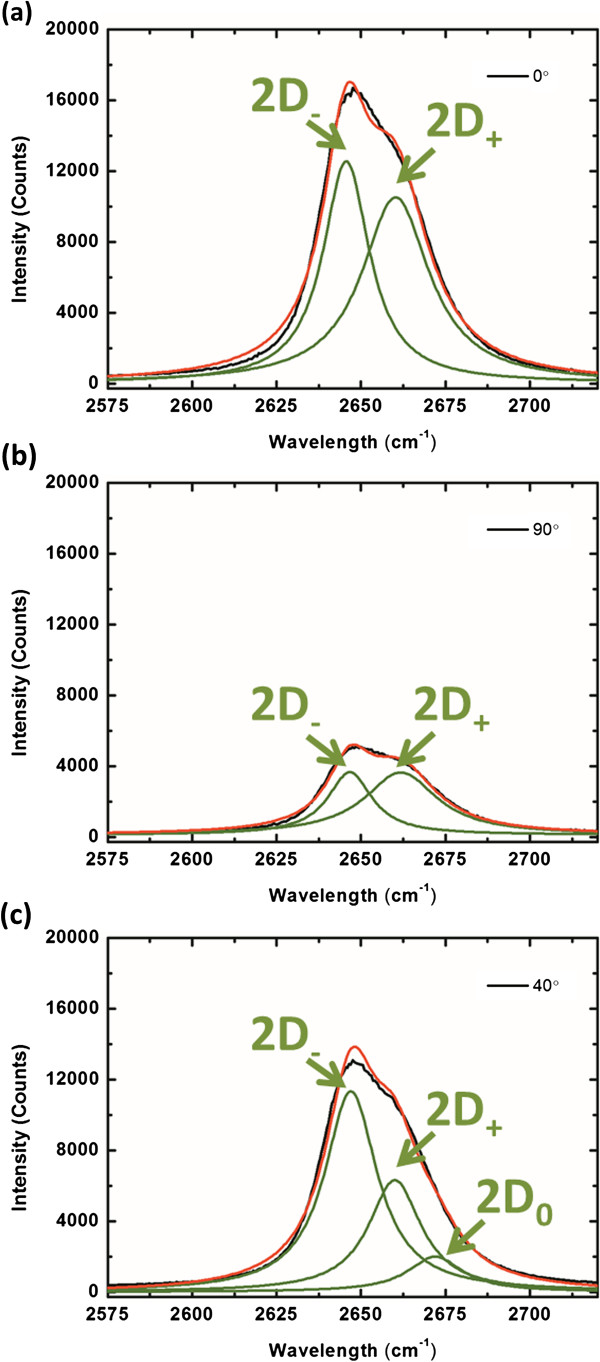
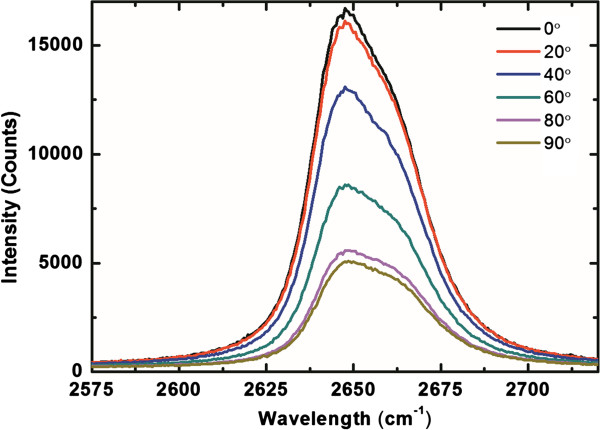
Polarized Raman spectra of 2D modes under incident lights with different polarization angle (Φ) are shown in Figure 2. The Φ is defined as the included angle between the incident polarization direction and the analyzer. The clear anti-symmetric spectra with different polarization angle can be observed in the spectra. Fitting of the 2D peaks is done using a double-Lorentzian function for Φ of (a) 0° and (b) 90°.
Figure 2.
Polarized Raman spectra of 2D modes under incident lights with different polarization angle (Φ). The Φ is defined as the included angle between the incident polarization direction and the analyzer.
The 2D peak originates from four-step Stokes-Stokes double-resonance Raman scattering [31]. According to the previous review, the 2D band split when strain is applied [32]. The two angles relating to the two maximum peak positions are exhibited in Figure 3, respectively. The two Lorentzian peaks for Figure 3a are at 2,646 (2D−) and 2,660 (2D+) cm−1, while that for Figure 3b are at 2,647 (2D−) and 2,662 (2D+) cm−1. To systematically analyze the sub-peak of the 2D modes, the spectra of 2D modes with different polarization angle can be fitted by double-Lorentz function, and the 2,647 and 2,660 cm−1 by average of all the peak positions of 2D+ and 2D− modes with different polarization angles. The 2D0 showed the peak position at 2,672 cm−1 as an original 2D peak in the unstrained graphene. The peak positions of 2D+ and 2D− modes compared with an original 2D peak both red shifts. The results showed that the 2D+ and 2D− modes are both tensile strains on suspended graphene. To understand the strain effect of the suspended graphene, fitting the 2D peak of graphene by a triple-Lorentzian function whose three peaks correspond to the sub-modes of 2D+, 2D−, and 2D0 with Φ = 40°, which is just an example of all the spectra, is shown in Figure 3c.
Figure 3.

Fitting the 2D peaks with a double-Lorentzian function.Φ of (a) 0° and (b) 90°. The two angles relate to the two maximum peak positions in Figure 2, respectively. The two Lorentz peaks for (a) are at 2,646 (2D−) and 2,660 (2D+) cm−1, while that for (b) are at 2,647 (2D−) and 2,662 (2D+) cm−1. (c) For Φ of 40°, fitting the 2D peak of graphene by a triple-Lorentzian function whose three peaks correspond to the sub-modes of 2D+, 2D−, and 2D0. The green curves represent the fitting peaks for the corresponding spectra. The black curves display the spectra, while the red ones show the profiles by adding all the related fitting peaks.
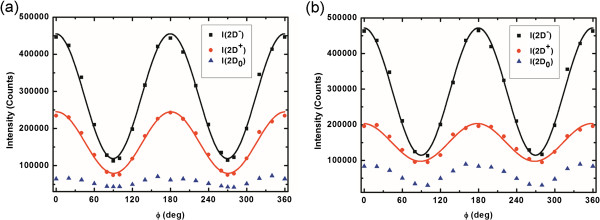
To systematically analyze the intensities of the fitting sub-peaks, the plots of I(2D+), I(2D−), and I(2D0) as functions of Φ is shown in Figure 4. The analysis of the suspended graphene was shown in Figure 4a. The 2D+ and 2D− sub-bands which have the peak positions of 2,647 and 2,660 cm−1, respectively, showed a prominent sinusoidal intensity modulation with a period of 180°. Both the modulation of the 2D+ and 2D− bands can be fitted by a function of cos2(θA − θP), where θA and θP are the polarization angles of the analyzer and polarizer, respectively. Both the intensities of 2D+ and 2D− modes are the maximum when Φ = 0° and minimum when Φ = 90°. This result of suspended graphene is very different from those of the supported graphene by previous research [32]. Compared with supported graphene, the same direction of tensile strain on the suspended graphene by analyzing 2D+ and 2D− modes can be obtained.
Figure 4.
Analysis of intensity. (a) Suspended and (b) supported graphenes. The plots of I(2D+), I(2D−), and I(2D0) as functions of Φ. The symbol ‘I’ denotes the intensity of the corresponding sub-peak obtained by fitting the related Raman spectrum with a triple-Lorentzian function. The obtained intensities are shown by the dots, which are fitted by the form of Acos2(Φ − Φ0) for I(2D+) and I(2D−), and of a constant of A, where A and Φ0 are fitting parameters. The black and red lines display the fitting results.
The strains of the 2D+ and 2D− can be calculated by employing the Grüneisen parameter [27] (γ) for the 2D mode of graphene. The corresponding equation is written as , where ω0 is the 2D peak position at zero strain and Δω is the shift caused by the strain of ε. For the uniaxial strain, is the uniaxial strain and is the relative strain in the perpendicular direction due to Poissons’ ratio of graphene [33]. In addition, the γ has been measured as 1.24 from the experiment on CNTs [34]. Hence the stains of for the 2D+ and 2D− are estimated as 0.44% and 0.93%, respectively. Based on these results, the distribution of strain on the suspended graphene can be obtained through our analysis.
Another interesting phenomenon measured from our sample can be observed in Figure 4b. The analysis of the supported graphene which was used the same method in Figure 4a was shown in Figure 4b. The 2D+ and 2D− sub-bands having the peak positions of 2,651 and 2,661 cm−1, respectively, showed a prominent sinusoidal intensity modulation with a period of 180°. Both the modulation of the 2D+ and 2D− bands can be fitted by a function of cos2(θA − θP), where θA and θP are the polarization angles of the analyzer and polarizer, respectively. Both the intensities of 2D+ and 2D− modes are the maximum when Φ = 1° and minimum when Φ = 91°. Using the same calculation, the stains of for the 2D+ and 2D− are estimated as 0.44% and 0.93%, respectively. The result in Figure 4b is similar with Figure 4a. Based on the results, we believed the strain will be relaxed to a new condition during the fabricated process of substrate.
Conclusion
We have explored the suspended graphene by polarized Raman spectroscopy. In the exploration, the polarization direction of the incident and scattered light are variable and fixed, respectively. The position and intensity of the graphene's 2D peak is modified by the incident polarization, and the modification is explained by a proposed biaxial-strained model. In this model, the 2D peak is contributed by three effective areas related to unstrained and two tensile-strained graphene, respectively. The two strains are uniaxial and in the same directions. The strength of the strains is quantified through our analysis. This analytical method can be used to probe strain and help us understand the situation of suspended graphene. Hence, this method provides great application potential on graphene-based electrical and optical devices, whose performance usually relies on strain.
Competing interests
The authors declare that they have no competing interests.
Authors' contributions
CWH and BJL carried the experimental parts: the acquisition, analysis, and interpretation of data. CWH also had been involved in drafting the manuscript. HYL and CHH performed the analysis and interpretation of data. They also had been involved in revising the manuscript. FYS and WHW (Institute of Atomic and Molecular Sciences, Academia Sinica) prepared the samples, suspended the graphene using micromechanical method, and captured the OM and AFM images. CYL has made substantial contributions to the conception and design of the study, and the critical revision of the manuscript for important intellectual content. HCC, the corresponding author, had made substantial contributions to the conception and design of the study, and had been involved in drafting the manuscript and revising it critically for important intellectual content. All authors read and approved the final manuscript.
Authors' information
CWH received his BS degree in Electronic Engineering from the National University of Kaohsiung, Kaohsiung, Taiwan, in 2008. He studied his MS degree in 2008 and PhD degree immediately in 2009. Currently, he is a PhD candidate in the Department of Photonics, National Cheng Kung University, Tainan, Taiwan. He focuses on the property of graphene and surface plasmon resonance of nanoparticles.
BJL received his BS degree in Physics from the National Chung-Hsing University, Taichung, Taiwan, in 2010. He received his MS degree in Photonics from the National Cheng Kung University, Tainan, Taiwan, in 2012. His research interests mainly include Raman measurement of graphene. He is in compulsory military service now.
Contributor Information
Cheng-Wen Huang, Email: chengwen620@gmail.com.
Bing-Jie Lin, Email: kingstart13@yahoo.com.tw.
Hsing-Ying Lin, Email: acsiolin@gmail.com.
Chen-Han Huang, Email: chenhan512@gmail.com.
Fu-Yu Shih, Email: fu.yu.shih@gmail.com.
Wei-Hua Wang, Email: wwang@gate.sinica.edu.tw.
Chih-Yi Liu, Email: liu.chihyi@gmail.com.
Hsiang-Chen Chui, Email: hcchui@mail.ncku.edu.tw.
Acknowledgment
We wish to acknowledge the support of this work by the National Science Council, Taiwan under contact no. NSC 98-2112-M-006-004-MY3.
References
- Suëtaka W. Surface Infrared and Raman Spectroscopy: Methods and Applications. New York: Plenum; 1995. [Google Scholar]
- Wang JK, Tsai CS, Lin CE, Lin JC. Vibrational dephasing dynamics at hydrogenated and deuterated semiconductor surfaces: symmetry analysis. J Chem Phys. 2000;7:5041–5052. doi: 10.1063/1.1289928. [DOI] [Google Scholar]
- Kneipp K, Moskovits M, Kneipp H. Surface-Enhanced Raman Scattering: Physics and Applications. Berlin: Springer; 2006. [Google Scholar]
- Wang HH, Liu CY, Wu SB, Liu NW, Peng CY, Chan TH, Hsu CF, Wang JK, Wang YL. Highly Raman-enhancing substrates based on silver nanoparticle arrays with tunable sub-10 nm gaps. Adv Mater. 2006;7:491–495. doi: 10.1002/adma.200501875. [DOI] [Google Scholar]
- Liu CY, Dvoynenko MM, Lai MY, Chan TH, Lee YR, Wang JK, Wang YL. Anomalously enhanced Raman scattering from longitudinal optical phonons on Ag-nanoparticle-covered GaN and ZnO. Appl Phys Lett. 2010;7:033109. doi: 10.1063/1.3291041. [DOI] [Google Scholar]
- Huang CH, Lin HY, Chen ST, Liu CY, Chui HC, Tzeng YH. Electrochemically fabricated self-aligned 2-D silver/alumina arrays as reliable SERS sensors. Opt Express. 2011;7:11441–11450. doi: 10.1364/OE.19.011441. [DOI] [PubMed] [Google Scholar]
- Ferrari AC, Meyer JC, Scardaci V, Casiraghi C, Lazzeri M, Mauri F, Piscanec S, Jiang D, Novoselov KS, Roth S, Geim AK. Raman spectrum of graphene and graphene layers. Phys Rev Lett. 2006;7:187401. doi: 10.1103/PhysRevLett.97.187401. [DOI] [PubMed] [Google Scholar]
- Malard LM, Pimenta MA, Dresselhaus G, Dresselhaus MS. Raman spectroscopy in graphene. Phys Rep. 2009;7:51–87. doi: 10.1016/j.physrep.2009.02.003. [DOI] [Google Scholar]
- Gao LB, Ren WC, Liu BL, Saito R, Wu ZS, Li SS, Jiang CB, Li F, Cheng HM. Surface and interference coenhanced Raman scattering of graphene. ACS Nano. 2009;7:933–939. doi: 10.1021/nn8008799. [DOI] [PubMed] [Google Scholar]
- Schedin F, Lidorikis E, Lombardo A, Kravets VG, Geim AK, Grigorenko AN, Novoselov KS, Ferrari AC. Surface-enhanced Raman spectroscopy of graphene. ACS Nano. 2010;7:5617–5626. doi: 10.1021/nn1010842. [DOI] [PubMed] [Google Scholar]
- Wu D, Zhang F, Liu P, Feng X. Two-dimensional nanocomposites based on chemically modified graphene. Chemistry. 2011;7:10804–10812. doi: 10.1002/chem.201101333. [DOI] [PubMed] [Google Scholar]
- Calizo I, Bao WZ, Miao F, Lau CN, Balandin AA. The effect of substrates on the Raman spectrum of graphene: graphene-on-sapphire and graphene-on-glass. Appl Phys Lett. 2007;7:201904. doi: 10.1063/1.2805024. [DOI] [Google Scholar]
- Calizo I, Miao F, Bao W, Lau CN, Balandin AA. Variable temperature Raman microscopy as a nanometrology tool for graphene layers and graphene-based devices. Appl Phys Lett. 2007;7:071913. doi: 10.1063/1.2771379. [DOI] [Google Scholar]
- Calizo I, Bejenari I, Rahman M, Liu G, Balandin AA. Ultraviolet Raman microscopy of single and multilayer graphene. J Appl Phys. 2009;7:043509. doi: 10.1063/1.3197065. [DOI] [Google Scholar]
- Novoselov KS, Geim AK, Morozov SV, Jiang D, Zhang Y, Dubonos SV, Grigorieva IV, Firsov AA. Electric field effect in atomically thin carbon films. Science. 2004;7:666–669. doi: 10.1126/science.1102896. [DOI] [PubMed] [Google Scholar]
- Geim AK, Novoselov KS. The rise of graphene. Nat Mater. 2007;7:183–191. doi: 10.1038/nmat1849. [DOI] [PubMed] [Google Scholar]
- Geim AK. Graphene: status and prospects. Science. 2009;7:1530–1534. doi: 10.1126/science.1158877. [DOI] [PubMed] [Google Scholar]
- Balandin AA. Thermal properties of graphene and nanostructured carbon materials. Nat Mater. 2011;7:569–581. doi: 10.1038/nmat3064. [DOI] [PubMed] [Google Scholar]
- Ghosh S, Nika DL, Pokatilov EP, Balandin AA. Heat conduction in graphene: experimental study and theoretical interpretation. New J Phys. 2009;7:095012. doi: 10.1088/1367-2630/11/9/095012. [DOI] [Google Scholar]
- Compagnini G, Forte G, Giannazzo F, Raineri V, La Magna A, Deretzis I. Ion beam induced defects in graphene: Raman spectroscopy and DFT calculations. J Mol Struct. 2011;7:506–509. doi: 10.1016/j.molstruc.2010.12.065. [DOI] [Google Scholar]
- Sahoo S, Palai R, Katiyar RS. Polarized Raman scattering in monolayer, bilayer, and suspended bilayer graphene. J Appl Phys. 2011;7:044320. doi: 10.1063/1.3627154. [DOI] [Google Scholar]
- Cancado LG, Jorio A, Ferreira EHM, Stavale F, Achete CA, Capaz RB, Moutinho MVO, Lombardo A, Kulmala TS, Ferrari AC. Quantifying defects in graphene via Raman spectroscopy at different excitation energies. Nano Lett. 2011;7:3190–3196. doi: 10.1021/nl201432g. [DOI] [PubMed] [Google Scholar]
- Castro Neto AH, Guinea F, Peres NMR, Novoselov KS, Geim AK. The electronic properties of graphene. Rev Mod Phys. 2009;7:109–162. doi: 10.1103/RevModPhys.81.109. [DOI] [Google Scholar]
- Huang MY, Yan HG, Heinz TF, Hone J. Probing strain-induced electronic structure change in graphene by Raman spectroscopy. Nano Lett. 2010;7:4074–4079. doi: 10.1021/nl102123c. [DOI] [PubMed] [Google Scholar]
- Pezzotti G. Spatially resolved Raman and cathodoluminescence probes in electronic materials: basics and applications. Phys Status Solidi A-Appl Mat. 2011;7:976–999. doi: 10.1002/pssa.201000785. [DOI] [Google Scholar]
- Ni ZH, Yu T, Lu YH, Wang YY, Feng YP, Shen ZX. Uniaxial strain on graphene: Raman spectroscopy study and band-gap opening. ACS Nano. 2008;7:2301–2305. doi: 10.1021/nn800459e. [DOI] [PubMed] [Google Scholar]
- Mohiuddin TMG, Lombardo A, Nair RR, Bonetti A, Savini G, Jalil R, Bonini N, Basko DM, Galiotis C, Marzari N, Novoselove KS, Geim AK, Ferrari AC. Uniaxial strain in graphene by Raman spectroscopy: G peak splitting, Gruneisen parameters, and sample orientation. Phys Rev B. 2009;7:205433. [Google Scholar]
- Huang MY, Yan HG, Chen CY, Song DH, Heinz TF, Hone J. Phonon softening and crystallographic orientation of strained graphene studied by Raman spectroscopy. Proc Natl Acad Sci USA. 2009;7:7304–7308. doi: 10.1073/pnas.0811754106. [DOI] [PMC free article] [PubMed] [Google Scholar]
- Sasaki K, Wakabayashi K, Enoki T. Polarization dependence of Raman spectra in strained graphene. Phys Rev B. 2010;7:205407. [Google Scholar]
- Yoon D, Son YW, Cheong H. Strain-dependent splitting of the double-resonance Raman scattering band in graphene. Phys Rev Lett. 2011;7:155502. doi: 10.1103/PhysRevLett.106.155502. [DOI] [PubMed] [Google Scholar]
- Yoon D, Moon H, Son YW, Samsonidze G, Park BH, Kim JB, Lee Y, Cheong H. Strong polarization dependence of double-resonant Raman intensities in graphene. Nano Lett. 2008;7:4270–4274. doi: 10.1021/nl8017498. [DOI] [PubMed] [Google Scholar]
- Yoon D, Son YW, Cheong H. Strain-dependent splitting of the double-resonance Raman scattering band in graphene. Phys Rev Lett. 2011;7 doi: 10.1103/PhysRevLett.106.155502. [DOI] [PubMed] [Google Scholar]
- Liu F, Ming PM, Li J. Ab initio calculation of ideal strength and phonon instability of graphene under tension. Phys Rev B. 2007;7:064120. [Google Scholar]
- Reich S, Jantoljak H, Thomsen C. Shear strain in carbon nanotubes under hydrostatic pressure. Phys Rev B. 2000;7:13389–13392. doi: 10.1103/PhysRevB.61.R13389. [DOI] [Google Scholar]


