Abstract
Iron is a biologically essential metal, but excess iron can cause damage to the cardiovascular and nervous systems. We examined the effects of extracellular Fe2+ on permeation and gating of CaV3.1 channels stably transfected in HEK293 cells, by using whole-cell recording. Precautions were taken to maintain iron in the Fe2+ state (e.g., use of extracellular ascorbate). With the use of instantaneous I-V currents (measured after strong depolarization) to isolate the effects on permeation, extracellular Fe2+ rapidly blocked currents with 2 mM extracellular Ca2+ in a voltage-dependent manner, as described by a Woodhull model with KD = 2.5 mM at 0 mV and apparent electrical distance δ = 0.17. Extracellular Fe2+ also shifted activation to more-depolarized voltages (by ∼10 mV with 1.8 mM extracellular Fe2+) somewhat more strongly than did extracellular Ca2+ or Mg2+, which is consistent with a Gouy-Chapman-Stern model with surface charge density σ = 1 e−/98 Å2 and KFe = 4.5 M−1 for extracellular Fe2+. In the absence of extracellular Ca2+ (and with extracellular Na+ replaced by TEA), Fe2+ carried detectable, whole-cell, inward currents at millimolar concentrations (73 ± 7 pA at −60 mV with 10 mM extracellular Fe2+). With a two-site/three-barrier Eyring model for permeation of CaV3.1 channels, we estimated a transport rate for Fe2+ of ∼20 ions/s for each open channel at −60 mV and pH 7.2, with 1 μM extracellular Fe2+ (with 2 mM extracellular Ca2+). Because CaV3.1 channels exhibit a significant “window current” at that voltage (open probability, ∼1%), CaV3.1 channels represent a likely pathway for Fe2+ entry into cells with clinically relevant concentrations of extracellular Fe2+.
Introduction
Iron enters cells not only through the well characterized transferrin receptor-endocytosis pathway for ferric iron but also through the poorly defined non–transferrin-bound iron (NTBI) mechanism for both ferric and ferrous iron entry (Anderson and Vulpe, 2009). Candidate mechanisms for NTBI involve divalent metal ion transporter 1 (Gunshin et al., 1997), Zrt- and Irt-like protein 14 (Liuzzi et al., 2006), the nonselective transient receptor potential canonical 6 channel (Mwanjewe and Grover, 2004), and voltage-gated calcium channels. Both L-type (Tsushima et al., 1999; Oudit et al., 2003) and T-type (Kumfu et al., 2011) calcium channels have been implicated in Fe2+ uptake through the use of selective blockers. Currents carried by Fe2+ were recorded electrophysiologically for L-type channels (Tsushima et al., 1999) but not T-type channels.
Iron overload typically is caused by excess dietary absorption of iron in genetic hemochromatosis (Clark et al., 2010) or repeated blood transfusions, when red blood cells are broken down and the heme-bound iron is released (Kwiatkowski, 2011). Plasma NTBI levels can reach ∼5 μM (Loréal et al., 2000). NTBI is highly reactive and can cause the formation of damaging free radicals. Excess iron accumulates mainly in the liver and the heart (Andrews, 1999). In myocardial cells, iron overload affects cellular structure (Iancu et al., 1987), gene expression (Parkes et al., 2000), Ca2+ handling (Kim et al., 1995), and ion channel properties (Kuryshev et al., 1999). Because Cav3.1 channels are widely expressed in excitable and nonexcitable cells, including brain, ovary, placenta, heart, liver, and vascular smooth muscle (Perez-Reyes, 2003; Yunker and McEnery, 2003; Rodman et al., 2005), understanding the mechanism of Fe2+ transport by these channels is necessary for understanding their role in organ damage in conditions associated with iron overload.
In addition to acting as a pore blocker and permeant ion (Winegar et al., 1991; Tsushima et al., 1999), Fe2+ might have significant effects on channel gating, as is the case for other divalent cations (Elinder and Arhem, 2003). Gating changes induced by divalent cations may arise from pore occupancy, allosteric effects of binding to sites outside the pore (Beedle et al., 2002; Kang et al., 2006; Traboulsie et al., 2007), or screening or binding to surface charges (Zhou and Jones, 1995).
We found that Fe2+ blocks currents carried by Ca2+ or Ba2+ through voltage-dependent block within the pore. Fe2+ also permeates, less well than Ca2+ or Ba2+. Effects of Fe2+ on gating are consistent with a surface charge mechanism, in which Fe2+ both screens and binds to surface charges. The effects of Fe2+ to block and to shift gating would be minimal at clinically observed concentrations of Fe2+. However, the estimated rates of Fe2+ permeation suggest that CaV3.1 may be a significant source of Fe2+ entry into cells even at the resting potential.
Materials and Methods
Electrophysiological Studies.
Patch-clamp experiments were performed in the whole-cell configuration by using HEK293 cells stably transfected with CaV3.1 (α1G) calcium channels, as described (Khan et al., 2008). Electrodes were made from borosilicate glass, with open-pipet resistances of 1.8 to 2.3 MΩ and access resistances of 5 ± 1 MΩ before compensation (80%). Currents were digitally sampled at 50 kHz, with 10-kHz analog filtering, by using an Axopatch 200 amplifier and pClamp 8.2 software (Molecular Devices, Sunnyvale, CA). Leak and capacitative currents were subtracted online by using a −P/4 protocol. Experiments were performed at room temperature (∼22°C).
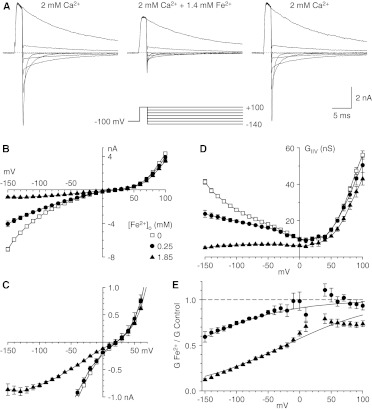
We evaluated the effects of Fe2+ by using two basic voltage protocols, i.e., direct depolarization to different voltages (I-V protocol) and preactivation of channels through strong brief depolarization, followed by steps to different voltages (II-V protocol) (Figs. 1 and 2). With the assumption that the effects of Fe2+ are effectively instantaneous (as we conclude below), this approach allows separation of effects on permeation versus gating (Hodgkin and Huxley, 1952; Serrano et al., 1999; Khan et al., 2008; Obejero-Paz et al., 2008; Lopin et al., 2012). Currents measured immediately after repolarization with the II-V protocol should be directly proportional to the current through a single open channel (Fig. 1A). Therefore, effects of Fe2+ on the II-V relationship would reflect the inhibition of currents through open channels. Effects on the I-V relationship, in contrast, would reflect the net effects of the ion on both permeation and gating.
Fig. 1.
Block by Fe2+ of currents carried by Ca2+ with the II-V protocol. A, sample currents recorded by using the protocols illustrated below the middle records, under control conditions (left), after the addition of Fe2+ (middle), and after washout of Fe2+ (right) (3-kHz Gaussian filter). Currents are shown in 40-mV increments. B, II-V relationships from the protocol used in A, under control conditions (0 mM Fe2+) and with two concentrations of Fe2+ (n = 4 for each concentration). C, expanded view of II-V relationships. D, chord conductances calculated for the data in B. E, inhibition by Fe2+, expressed as the ratio of the chord conductance with Fe2+ to the chord conductance under control conditions. Data are not shown near the reversal potential, where errors in conductance calculations can be large. Solid curves, fits to the model described by Woodhull (1973). Symbols shown in B apply to B to E.
Fig. 2.
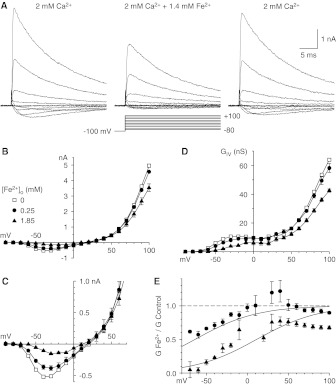
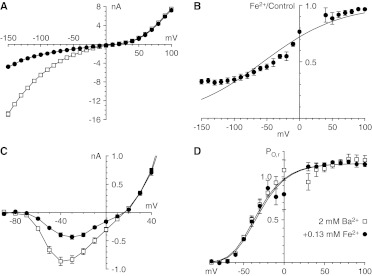
Block by Fe2+ of currents carried by Ca2+ with the I-V protocol. A, sample records, shown in 20-mV increments (3-kHz Gaussian filter). B, I-V relationships with the protocol used in A, with the same cells as in Fig. 1. C, I-V relationships on an expanded scale. D, chord conductances calculated from the data in B. E, inhibition by Fe2+, determined as chord conductance ratios and fitted to the model described by Woodhull (1973). Data near the reversal potential are not shown. Symbols shown in B apply to B to E.
Standard Recording Solutions.
The intracellular solution contained 2 mM CaCl2, 1 mM MgCl2, 120 mM NaCl, 10 mM HEPES, 4 mM MgATP, and 11 mM EGTA, adjusted to pH 7.2 with NaOH (total Na+ concentration, 145 mM; calculated free Ca2+ concentration, 70 nM). The normal extracellular solution contained 2 mM CaCl2, 128 mM NaCl, 5 mM ascorbic acid, 10 mM glucose, and 20 mM HEPES, adjusted to pH 7.2 with NaOH (total Na+ concentration, 145 mM). Where noted, CaCl2 was replaced by BaCl2.
Extracellular Solutions Containing Fe2+.
Extreme care must be taken to maintain iron in the soluble Fe2+ state. To do this, FeCl2 was added to the solution only after cell patches were prepared and control currents were being recorded, to reduce the amount of time Fe2+ could oxidize. Solutions were prepared 1 to 2 min before they were applied to the cells and were used within 6 min after preparation. Fe2+ was added to the final desired concentration from a 200 mM stock solution of FeCl2·4H2O in 1% (v/v) HCl. The free Fe2+ concentration in each solution was measured, by using the ferrozine method (Dorey et al., 1993; Viollier et al., 2000), while the electrophysiological experiments were being performed. To this end, a sample of the extracellular solution was diluted to a final concentration of 100 μM Fe2+ with a solution containing the same components (except FeCl2) or a solution containing 5 mM ascorbate (pH 3.3), to reduce all iron forms; 0.75 ml of those samples was mixed with the same volume of 2 mM ferrozine [3-(2-pyridyl)-5,6-diphenyl-1,2,4-triazine-4′,4″-disulfonic acid], and absorbance was measured (at 562 nm) with a Beckman DU640B spectrophotometer (Beckman Coulter, Fullerton, CA). Standard solutions in the range of 10 to 100 μM Fe2+ were prepared through dilution of a stock solution of 20 mM FeCl2·4H2O, with a final concentration of 5 mM ascorbic acid. Measured free Fe2+ concentrations ranged from 28 to 95% of the nominal value. Throughout this article, Fe2+ concentration values are the actual values measured with this procedure.
For experiments examining block by Fe2+, Fe2+ was added to the normal extracellular solutions (2 mM Ca2+ or 2 mM Ba2+). To investigate whether CaV3.1 currents allowed Fe2+ influx, we designed extracellular solutions in which Fe2+ was the only charge carrier. To this end, extracellular NaCl was replaced by TEA-Cl, Ca2+ was replaced by Fe2+, and solutions were maintained at pH 7.0 to reduce the rate of iron oxidation; pH values of 6.8 to 7.05 measured at the end of the experiment were considered acceptable. A control solution containing 2 mM Ca2+ was applied to the cell before and after the test solution. Because inward currents with Fe2+ were small, we performed experiments to evaluate the contributions of gating currents, by using an extracellular solution containing 140 mM NaCl, 2 mM CdCl2, and 1 mM LaCl3.
Data Analyses.
Most methods were as described (Lopin et al., 2012). Throughout the article, data are presented as mean ± S.E.M. We used the paired t test implemented in Origin 7.0 (OriginLab Corp., Northampton, MA) to assess differences between means when control values were from the same cell. We used one-way analysis of variance to investigate differences between means from different groups. Two-tailed p values of <0.05 were considered statistically significant.
Fe2+ Block.
The voltage dependence of block by Fe2+ was described with a model that assumed that Fe2+ binds within the electrical field of the membrane, with Fe2+ entry and exit exclusively from the extracellular solution (Woodhull, 1973),
where f is the fraction of peak tail current remaining in the presence of Fe2+ and KD,0 is the KD at 0 mV.
Permeation Model.
The classic two-site/three-barrier model of channel permeation (Almers and McCleskey, 1984; Hess and Tsien, 1984) was extended to Fe2+, as for Cd2+ (Lopin et al., 2010, 2012). Parameters for the energy profile of Fe2+ were chosen to minimize the sum of absolute errors attributable to Fe2+ block and permeation for recorded currents. The parameters for Ca2+, Ba2+, Mg2+, and Na+ were fixed to the values reported by Lopin et al. (2010), which were fit to a wide range of ionic conditions. The minimization procedure produced multiple parameter sets with similar errors (within 15%), all with qualitatively similar currents and energy profiles (all energy parameters varied in a 1-kT range across parameter sets). Because we use the model to predict Fe2+ transport rates, we chose the parameter set that best fit the currents carried by Fe2+. All other parameter sets predicted Fe2+ currents larger than those observed, as well as predicting Fe2+ transport rates up to twice as high as the rate observed with the chosen parameter set.
Because control currents in Fe2+ permeation experiments were significantly larger than control currents in the experiments reported by Khan et al. (2008), we assumed 18,000 channels/cell, rather than 8000 channels/cell. We expected that Fe2+ currents would be minimally affected by the 0.2-pH unit difference between solutions. Because it was not always possible to record control currents after application of the test solution, we used the first control current for normalization, a procedure that would underestimate iron currents in the presence of current rundown.
Gating.
To investigate the effects of Fe2+ on channel activation, we fitted simultaneously the relative open probability (Po,r) values measured under control conditions and with Fe2+ to a fourth-power Boltzmann function,
 |
where V0.5 is the half-point of activation for an individual voltage sensor, k is the voltage sensitivity, ΔV0.5 is the shift in V0.5 induced by Fe2+, and δ is the Kronecker δ function, which takes the value of 1 with Fe2+ and 0 for control conditions.
The effect of Fe2+ on the rate of channel opening was addressed indirectly by studying changes in the time to peak (TP). To this end, we simultaneously fitted data from control and Fe2+ experiments to eq. 3,
where V1−TP∞ is the voltage at which the time to peak is equal to 1 minus the asymptotic value of TP (TP∞), k is the voltage sensitivity, and ΔV1−TP∞ is the shift along the voltage axis.
The effect of Fe2+ on the closing rate was investigated by fitting simultaneously the deactivating time constants between −70 and −120 mV to eq. 4,
where Vτ2ms is the voltage at which the time constant (τ) equals 2 ms, ΔVτ2ms is the displacement induced by Fe2+ along the voltage axis, and k is the slope factor. Gating shifts were calculated by using the Minerr procedure (Mathcad; Adept Scientific, Letchworth Garden City, Herts, UK) to calculate the values of σt and KFe that minimized χ2 for ΔV0.5, ΔV1−TP∞, and ΔVτ2ms.
59Fe2+ Kinetic Transport Studies.
For cellular 59Fe2+ uptake experiments, 59Fe2+ was generated from 59FeCl3 [specific activity, >5 Ci (185 GBq)/g of FeCl3 in 0.5 M HCl; Perkin-Elmer, Rodgau, Germany] as described elsewhere (Garrick et al., 2006). 59Fe2+ uptake (18.5 kBq/ml 59FeCl2 in 200–400 μM FeSO4) was assessed with confluent monolayers of HEK293 cells or HEK293-CaV3.1 cells, with or without 25 μM (1S,2S)-2-(2-(N-[(3-benzimidazol-2-yl)propyl]-N-methylamino)ethyl)-6-fluoro-1,2,3,4-tetrahydro-1-isopropyl-2-naphtyl cyclopropanecarboxylate dihydrochloride (NNC 55-0396), a selective inhibitor of T-type calcium channels (Huang et al., 2004). Monolayers were washed with 2 mM desferrioxamine mesylate and solubilized with 1 N NaOH, and cellular radioactivity was measured with a gamma counter.
Results
Effects of Fe2+ on Permeation.
Extracellular application of Fe2+ reversibly inhibited currents through CaV3.1 channels that were evaluated by using the II-V protocol (Fig. 1A). Under these ionic conditions (2 mM extracellular Ca2+ and 145 mM intracellular and extracellular Na+ levels), CaV3.1 channels exhibited inward currents carried mostly by Ca2+ and outward currents carried by Na+. It should be noted that the inward tail currents were smaller and faster with Fe2+. Peak tail currents were reduced immediately after repolarization, which suggests that Fe2+ reached steady-state block rapidly. Block was concentration- and voltage-dependent, with strong inhibition at negative voltages but little effect on outward currents (Fig. 1B). Fe2+ had no clear effect on the reversal potential (Fig. 1C). The voltage dependence of block was best illustrated by chord conductances, especially near the reversal potential (Fig. 1D). The fractional inhibition determined from chord conductances was well described by the model reported by Woodhull (1973) (Fig. 1E), which suggests negligible relief of block with hyperpolarization. The data were fit best with KD = 2.5 mM at 0 mV and electrical distance δ = 0.17.
Effects of Fe2+ on Gating.
Fe2+ also inhibited currents that were examined by using the I-V protocol and evoking currents through direct depolarization from the holding potential (Fig. 2A). The peak current at each voltage is shown in Fig. 2B, on an expanded scale in Fig. 2C, and as chord conductances in Fig. 2D. With this protocol, inhibition by Fe2+ was voltage-dependent and stronger at more-negative voltages, and the voltage that produced the peak inward current was shifted to more-positive voltages (Fig. 2C). Inhibition of peak current also could be described with the model reported by Woodhull (1973), with KD = 1.4 mM at 0 mV and δ = 0.33.
Why does the effect of Fe2+ appear to be more potent and more voltage-dependent with the I-V protocol? The currents recorded in that manner are affected not only by permeation (e.g., channel block) but also by gating (e.g., surface charge effects of Fe2+).
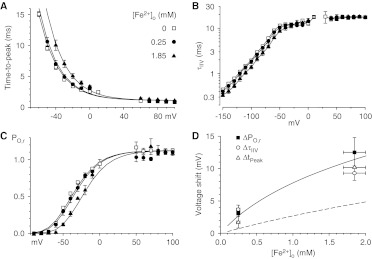
We examined the effects of Fe2+ on activation with three measures, i.e., effects on the time courses of channel activation (Fig. 3A) and deactivation (Fig. 3B) and on the voltage dependence of peak activation (Fig. 3C). Activation curves were measured as the relative open probability, calculated as the ratio of the peak current from the I-V protocol divided by the current at the same voltage from the II-V protocol (Fig. 3C) (Serrano et al., 1999; Khan et al., 2008). This parameter is a more-accurate reflection of channel open probability than is the more commonly used chord conductance, because the open-channel conductance is not constant with voltage (Fig. 1D) and thus the chord conductances measured with the I-V protocol (Fig. 2D) are not pure measures of channel activation (Khan et al., 2008). The three measures of the voltage dependence of channel gating were affected by Fe2+ in similar manners (Fig. 3D), demonstrating positive shifts along the voltage axis with Fe2+. It is noteworthy that Fe2+ did not affect the limiting rates for channel activation (Fig. 3A) or inactivation (Fig. 3B) at strongly depolarized voltages.
Fig. 3.
Effects of Fe2+ on gating. A, effects of Fe2+ on the time to peak currents with the I-V protocol. B, effects of Fe2+ on the time constants for deactivation with the II-V protocol. C, effects of Fe2+ on channel activation, determined as the ratio of the peak I-V current to the II-V current at the same voltage. D, voltage shifts for the data shown in A to C, for the activation curve (ΔPO,r), for deactivation (ΔτIIV), and for time to peak (ΔtPeak). Solid curve, fit to the Gouy-Chapman-Stern theory. Dashed curve, fit to voltage shifts induced by Ca2+, Ba2+, and Mg2+ (Khan et al., 2008). Symbols shown in A apply to A to C. Data near the reversal potential are not shown in A to C (same cells as Figs. 1 and 2).
Qualitatively, the observed voltage shifts were as expected on the basis of a surface charge mechanism, with cations screening a negative surface charge on the extracellular side. Quantitatively, the effect was approximately twice as large as those observed previously for Ca2+, Ba2+, and Mg2+ (Khan et al., 2008) (Fig. 3D). Because simple charge-screening (Gouy-Chapman theory) assumes that all divalent cations are equivalent, we considered the possibility that Fe2+ could bind to the surface charge as well as screening it (Gouy-Chapman-Stern theory), as observed for Cd2+ (Lopin et al., 2012). Figure 3D demonstrates that the data could be described well by using the surface charge density determined previously for the effects of Ca2+, Ba2+, and Mg2+ (σ = 1 e−/98 Å2) (Khan et al., 2008) but allowing binding of extracellular Fe2+ to the surface charge with KFe = 4.5 M−1.
Effects of Fe2+ with 2 mM Ba2+.
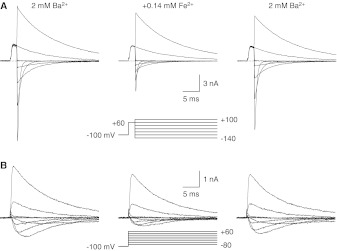
CaV3.1 calcium channels are selective for Ca2+ over Ba2+ on the basis of the classic criterion of permeability ratios, which reflects a more-positive reversal potential with Ca2+ and indicates greater selectivity versus monovalent cations (Serrano et al., 2000). Divalent and trivalent cations, e.g., Mg2+ (Serrano et al., 2000), Ni2+ (Obejero-Paz et al., 2008), Y3+ (Obejero-Paz et al., 2004), and Cd2+ (Lopin et al., 2012), block more rapidly and/or strongly when Ba2+ is the charge carrier, which reflects stronger competition versus the less-permeant Ba2+ ion; this was also observed for Fe2+ (Figs. 4 and 5). Fe2+ at 0.13 mM blocked strongly at hyperpolarized voltages, with either the II-V (Figs. 4A and 5A) or I-V (Figs. 4B and 5C) protocol. Inhibition measured from chord conductances determined by using the II-V protocol was described with a Woodhull model with KD = 0.33 mM at 0 mV and δ = 0.21 (Fig. 5B). Block was slightly overestimated with the model at the most negative voltages, which suggests relief of block through the exit of Fe2+ into the cell. That low concentration of Fe2+ had minimal effects on channel activation (Fig. 5D). The activation curve was shifted by 2.8 ± 1.0 mV and the time constants for activation and deactivation were shifted by 2.9 ± 0.5 mV and −1.0 ± 1.6 mV, respectively.
Fig. 4.
Effects of Fe2+ with 2 mM Ba2+ as the charge carrier. A, sample records with the II-V protocol, shown in 40-mV increments. B, sample records with the I-V protocol, shown in 20-mV increments (3-kHz Gaussian filter).
Fig. 5.
Analysis of effects of Fe2+ with 2 mM Ba2+. A, II-V relationships under control conditions and with 0.13 mM Fe2+. B, inhibition by Fe2+, determined as chord conductance ratios (Fe2+/control) and fitted to a Woodhull model. C, I-V relationships (currents from 50 to 100 mV not shown). D, activation curves determined from I-V/II-V current ratios. Data near the reversal potential are not shown in B and D (n = 4 for all panels).
Permeation by Fe2+.
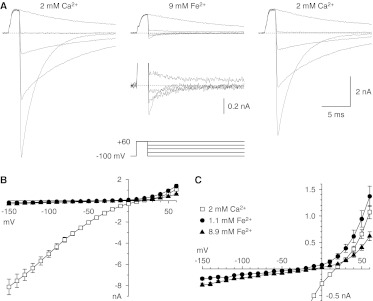
When extracellular Ca2+ and Na+ were replaced by Fe2+ and TEA (respectively), inward currents were small but clearly detectable (Fig. 6). Currents were larger with 9 mM Fe2+ than 1 mM Fe2+ (Fig. 6C), as expected for permeation by Fe2+. The chord conductance with 9 mM Fe2+ was 1.5 ± 0.2-fold larger than that with 1 mM Fe2+, averaged from −150 to −50 mV (p < 0.01).
Fig. 6.
Permeation by Fe2+. A, sample records with the II-V protocol, in 40-mV increments (3-kHz Gaussian filter). Inset below the middle record, currents from −100 to +20 mV, on a 5× expanded scale. B, II-V relationships. C, II-V relationships on an expanded scale. Symbols shown in C also apply to B. Data in B and C are from seven cells, four with 1.1 mM Fe2+, and five with 8.9 mM Fe2+.
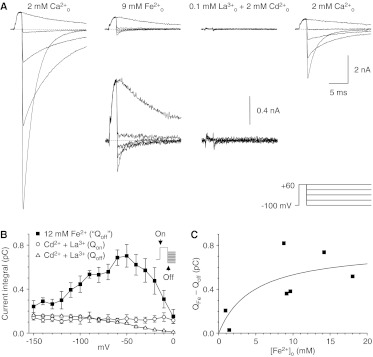
An alternative interpretation is that the inward currents observed with Fe2+ might be “off” gating currents. To evaluate that possibility, we compared the integrated tail current amplitudes with gating currents isolated by using a combination of 0.1 mM extracellular La3+ and 2 mM extracellular Cd2+ to block ionic currents (Fig. 7). Figure 7A, insets, shows that the inward currents were larger with extracellular Fe2+. Quantitatively, the integrated Fe2+ tail current greatly exceeded the gating currents at voltages at which tail currents were relatively large and slowly decaying (Fig. 7B). The amplitude of the integrated tail current increased with the extracellular Fe2+ concentration (Fig. 7C). There was considerable scatter in the data, which presumably reflects cell-to-cell variations in channel expression levels; therefore, the apparent KD of 4.7 mM for current saturation with extracellular Fe2+ should be considered an estimate.
Fig. 7.
Comparison of tail currents with Fe2+ with gating currents. A, sample records with the II-V protocol, in 40-mV increments. Partial recovery (right) after superfusion with the solution used to isolate gating currents (La3+ plus Cd2+) should be noted. Insets below the middle records, recordings on a 5× expanded scale, to show tail currents with Fe2+ and on- and off-gating currents with La3+ plus Cd2+ (3-kHz Gaussian filter). B, integrated tail currents with Fe2+, compared with the on-gating current (measured during depolarization to 60 mV) and off-gating current (measured after repolarization) (Fe2+ tails, n = 5; on- and off-gating currents, n = 4). C, portion of the integrated tail current amplitude attributable to Fe2+ entry, as a function of Fe2+, for the five cells in B and two cells tested with ∼1 mM Fe2+. Solid curve, fit to a single saturable binding site with a KD of 4.7 mM and a maximal current of 0.78 pC.
Reversal potentials were less positive with Fe2+ than with Ca2+ (Fig. 6C), i.e., −26.1 ± 4.7 mV (n = 4) with 1.1 mM Fe2+ and −9.0 ± 3.7 mV (n = 5) with 8.9 mM Fe2+. Those values correspond to Fe2+/Na+ permeability ratios of 16 and 5, respectively, which compare with a Ca2+/Na+ permeability ratio of 87 and a Ba2+/Na+ permeability ratio of 44 (Khan et al., 2008) and indicate a Fe2+/Ca2+ permeability ratio of 0.06 to 0.18. Incubation studies with 59Fe2+ showed a trend toward increased Fe2+ uptake by Cav3.1 channels, but results were inconclusive because of high background levels of Fe2+ uptake and increased cell death rates (data not shown).
Model for Fe2+ Permeation and Block.
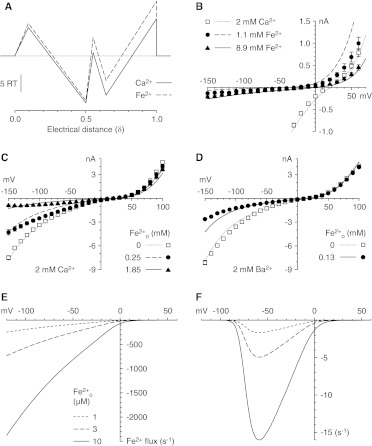
We fitted the data on Fe2+ permeation and block to a two-site/three-barrier Eyring rate theory model (Almers and McCleskey, 1984). The fit of the model to the data is shown for Fe2+ permeation (Fig. 8B) and for block of current carried by extracellular Ca2+ (Fig. 8C) or Ba2+ (Fig. 8D).
Fig. 8.
Two-site/three-barrier Eyring model for permeation and block by Fe2+. A, energy levels and electrical distances for barriers and wells for Ca2+ and Fe2+. Energy levels (outside to inside) were 9.32, −12.73, 5.26, −6.97, and 15.65 RT. The electrical distances and energy profiles for Na+, Mg2+, and Ba2+ are from the report by Lopin et al. (2010). B to D, fits of the model to experimental II-V data are shown for permeation (B), block of the current carried by 2 mM Ca2+ (C), and block with 2 mM Ba2+ (D). E, calculation of the rate of Fe2+ entry with the indicated extracellular Fe2+ concentrations, in the presence of 2 mM extracellular Ca2+, for a single open channel. F, calculation of the steady-state rate of Fe2+ entry by considering channel gating (activation and inactivation). The steady-state open probability-voltage relationship calculated with the model described by Serrano et al. (1999) was convolved with the curves in E.
We used the model to estimate the extent of Fe2+ permeation at concentrations more relevant to physiological or pathophysiological conditions (Fig. 8, E and F). Simulated addition of 1 to 10 μM Fe2+ (to extracellular solutions also containing 2 mM Ca2+) yielded predicted Fe2+ influx rates of up to several hundred ions per second through a single open channel (Fig. 8E). The mechanism of Fe2+ permeation predicted by the model is similar to the permeation of Ca2+, with quantitative differences. The two ions seem to enter the pore and to bind to the first site similarly; however, Fe2+ is slower to move to the second site and binds less tightly to the second site, and the energy barrier to Fe2+ exit from the pore is higher.
CaV3.1 channels inactivate rapidly and strongly but inactivation is incomplete, with 1 to 2% of channels remaining open even after 0.3 s, i.e., 20 times the time constant for inactivation (Serrano et al., 1999). This produces a “window current” that can potentially allow maintained entry of divalent cations into the cell even near the resting potential. When the two-site/three-barrier model for permeation was combined with the model described by Serrano et al. (1999) for gating of CaV3.1 channels, the predicted steady-state Fe2+ influx peaked at 6 ions/s near −60 mV, with 10 μM extracellular Fe2+ (Fig. 8F). Correction for slow inactivation would decrease these values by ∼35% (Hering et al., 2004).
Discussion
Overall Findings.
We conclude that Fe2+ affects currents through CaV3.1 channels through three mechanisms, i.e., block of the open pore by Fe2+, shifts in channel activation, and permeation by Fe2+. Fe2+ permeates CaV3.1 pores poorly, compared with Ca2+ or Ba2+ or even Cd2+ (Lopin et al., 2012), but the estimated rate of Fe2+ entry suggests that CaV3.1 is a strong candidate for Fe2+ influx under conditions in which free extracellular Fe2+ is present at micromolar concentrations. We discuss first the biophysical mechanisms of Fe2+ interactions with calcium channels and then the potential implications for iron overload.
Block by Fe2+.
The effect of Fe2+ on the II-V relationship was consistent with block through occupancy of the pore, presumably at the selectivity filter responsible for selectivity for Ca2+ and other divalent and trivalent cations. First, block was voltage-dependent and was well approximated with the model described by Woodhull (1973), with the assumption of binding to a site within the electrical field of the membrane. Second, block was ∼4-fold stronger when 2 mM Ba2+ was the charge carrier (compared with 2 mM Ca2+), which suggests ion-ion competition within the pore. Reduction of the current measured instantaneously indicates that Fe2+ equilibrates rapidly with the open pore, on the time scale of the voltage clamp (∼0.1 ms). For the lowest concentration used (0.13 mM Fe2+, for experiments with Ba2+), that indicates binding with a bimolecular rate constant of 108 M−1 s−1 or faster, near the diffusion limit.
Effects of Fe2+ on Gating.
The effect of Fe2+ on the peak current measured with the I-V protocol was stronger and more voltage-dependent than that observed with the II-V protocol. Because currents measured with the I-V protocol are affected by both permeation and gating (i.e., changes in the probability that a channel would be open at a particular voltage and time), this finding suggests that Fe2+ affects the response of the channel to voltage. Figure 3 shows that the effect of Fe2+ could be attributed to screening and binding to surface charge. We assumed a Guoy-Chapman-Stern model for simplicity, but the possibility of a specific binding site on the channel cannot be excluded.
Fe2+ Permeation.
In the absence of extracellular Ca2+ and Na+, Cav3.1 channels carry a significant Fe2+ current that is saturated in the millimolar range. The currents measured with Fe2+ were small (which indicates that Fe2+ is a poorly permeant ion) but were noticeably larger than could be attributed to gating charge movement (Fig. 7B). This current increased as the external Fe2+ concentration was increased, which suggests that the current was carried by Fe2+ and not contaminating cations.
CaV3.1 as Pathway for Fe2+ Entry.
To explain the effects of Fe2+ on permeation, we expanded a model of permeation for Cav3.1 channels to account for Fe2+. The model fit the data well, although block of outward currents with 1.1 mM Fe2+ was underestimated (Fig. 8B). The model could assess Fe2+ permeation when Ca2+ and Mg2+ were present at physiological concentrations. Figure 8, E and F, shows the calculated transport rates for Fe2+ at external concentrations in the range of 1 to 10 μM and the membrane potentials encountered at rest and during action potentials. Cav3.1 channels have a window current attributable to incomplete inactivation (Serrano et al., 1999) that leaves ∼1 to 2% of channels open at resting membrane potentials. Because channels are open even at resting membrane potentials, we used our model of Cav3.1 channel gating to calculate the fraction of channels expected to be open at steady state (Serrano et al., 1999). This value multiplied by the transport rate calculated for Fig. 8F is the number of Fe2+ ions transported per second per channel (Fig. 8D).
Comparison of Fe2+ with Other Divalent Cations.
We have examined the effects of several divalent cations, including Ca2+, Ba2+, Mg2+, Ni2+, and Cd2+, on the permeation and gating of CaV3.1 (Khan et al., 2008; Obejero-Paz et al., 2008; Lopin et al., 2012). To a surprising extent, the channel can easily distinguish between the ions. As previously established for L-type calcium channels, there is a spectrum from highly permeant ions to strong blockers. Ca2+ and Ba2+ are the most permeant at millimolar concentrations, although they potently block currents carried by Na+ at micromolar concentrations. Mg2+ is nearly impermeant but blocks currents carried by Ca2+ from either side of the membrane (Khan et al., 2008). Fe2+ appears to be a Mg2+-like blocker, but it can carry small inward currents. The classic calcium channel blocker Cd2+ produces surprisingly large inward currents and exhibits reversed voltage dependence of channel block (Lopin et al., 2012). Ni2+ seems to be unique in blocking rapidly at an extracellular site (that cannot distinguish Ca2+ from Ba2+), in addition to blocking slowly at the selectivity filter (Obejero-Paz et al., 2008). Except for the fast-block site for Ni2+, these effects can be explained with the two-site/three-barrier model as subtle quantitative changes in the energetic parameters of ion binding, as opposed to distinct biophysical mechanisms.
Iron Overload.
Iron levels normally are tightly regulated in the body (Zhang and Enns, 2009). Increased intracellular iron levels have been associated with disorders involving the heart (Horwitz and Rosenthal, 1999; Kremastinos and Farmakis, 2011) and the brain (Stankiewicz and Brass, 2009), including neurological disorders such as amyotrophic lateral sclerosis, Parkinson's disease, and Alzheimer's disease (Oshiro et al., 2011). Intracellular iron leads to the production of reactive oxygen species that cause oxidative damage to proteins, lipids, and DNA (Giorgio et al., 2007).
Pathways for NTBI Influx.
In neurons, voltage-gated calcium channels (Gaasch et al., 2007) and N-methyl-d-aspartate receptors (Pelizzoni et al., 2011) have been implicated in NTBI influx. Studies with calcium channel blockers implicated both L-type channels and non–L-type, high-voltage–activated channels in Fe2+ entry into hippocampal neurons (Pelizzoni et al., 2011). The cerebrospinal fluid has levels of iron that saturate transferrin, leaving ∼1 μM free iron (Bradbury, 1997). This iron should be maintained in its ferrous form (Fe2+) with high levels of ascorbate (Bradbury, 1997) and ferrireductases (Lane et al., 2010; Mills et al., 2010). In the case of cerebral hemorrhage, free iron levels were observed to peak at >10 μM and to remain above 5 μM for 28 days (Wan et al., 2006). Such levels could provide sufficient free Fe2+ for entry into neurons through calcium channels.
The mechanism of Fe2+ uptake into cardiomyocytes is still being debated (Chattipakorn et al., 2011). Block of L-type and T-type calcium channels in cardiomyocytes in vivo (Oudit et al., 2003; Kumfu et al., 2012) can decrease iron uptake into the heart, which is an indication that sufficient free Fe2+ for calcium channels is available in the plasma and it can permeate in the presence of physiological levels of Ca2+.
Although the main mechanism for preventing excess iron in cells is preventing iron uptake, cells have mechanisms to efflux excess iron out of the cell, with the main protein being ferroportin 1 (Donovan et al., 2000). To maintain iron homeostasis, the liver releases hepcidin when iron levels are increased (Park et al., 2001); hepcidin binds to ferroportin 1 and causes its endocytosis and degradation (Nemeth et al., 2004). Normally this reduces plasma iron levels by decreasing ferroportin 1 levels in intestinal cells, which decreases iron absorption from the diet (Ganz, 2011). Under conditions of iron overload, in which iron absorption is not regulated in this way because of repeated transfusions to treat a blood disorder, the mechanism involving hepcidin down-regulation of ferroportin 1 might cause iron-handling problems. In cells with unregulated Fe2+ entry, such as cardiomyocytes and neurons, which have large numbers of calcium channels, hepcidin release causes ferroportin 1 levels to decrease (Wang et al., 2010), which decreases the capacity of cells to export Fe2+, but calcium channels continue to allow unregulated Fe2+ entry. Our results indicate that Cav3.1 channels can constitute a pathway for iron entry at resting membrane potentials and possibly during the course of action potentials, when extracellular Fe2+ levels reach concentrations in the micromolar range.
Acknowledgments
We thank Dr. Ed Perez-Reyes (University of Virginia) for the HEK293 cell line stably transfected with CaV3.1.
This study was supported by the National Institutes of Health National Institute of Neurological Diseases and Stroke [Grant NS24471], the Deutsche Forschungsgemeinschaft [Grant TH345/11-1], and the Stiftung Westermann-Westdorp.
Article, publication date, and citation information can be found at http://molpharm.aspetjournals.org.
- NTBI
- non–transferrin-bound iron
- NNC 55-0396
- (1S,2S)-2-(2-(N-[(3-benzimidazol-2-yl)propyl]-N-methylamino)ethyl)-6-fluoro-1,2,3,4-tetrahydro-1-isopropyl-2-naphtyl cyclopropanecarboxylate dihydrochloride
- TP
- time to peak.
Authorship Contributions
Participated in research design: Lopin, Obejero-Paz, Thévenod, and Jones.
Conducted experiments: Lopin, Gray, Obejero-Paz, and Thévenod.
Performed data analysis: Lopin, Obejero-Paz, Thévenod, and Jones.
Wrote or contributed to the writing of the manuscript: Lopin, Obejero-Paz, Thévenod, and Jones.
References
- Almers W, McCleskey EW. (1984) Non-selective conductance in calcium channels of frog muscle: calcium selectivity in a single-file pore. J Physiol 353:585–608 [DOI] [PMC free article] [PubMed] [Google Scholar]
- Anderson GJ, Vulpe CD. (2009) Mammalian iron transport. Cell Mol Life Sci 66:3241–3261 [DOI] [PMC free article] [PubMed] [Google Scholar]
- Andrews NC. (1999) Disorders of iron metabolism. N Engl J Med 341:1986–1995 [DOI] [PubMed] [Google Scholar]
- Beedle AM, Hamid J, Zamponi GW. (2002) Inhibition of transiently expressed low- and high-voltage-activated calcium channels by trivalent metal cations. J Membr Biol 187:225–238 [DOI] [PubMed] [Google Scholar]
- Bradbury MW. (1997) Transport of iron in the blood-brain-cerebrospinal fluid system. J Neurochem 69:443–454 [DOI] [PubMed] [Google Scholar]
- Chattipakorn N, Kumfu S, Fucharoen S, Chattipakorn S. (2011) Calcium channels and iron uptake into the heart. World J Cardiol 3:215–218 [DOI] [PMC free article] [PubMed] [Google Scholar]
- Clark P, Britton LJ, Powell LW. (2010) The diagnosis and management of hereditary haemochromatosis. Clin Biochem Rev 31:3–8 [PMC free article] [PubMed] [Google Scholar]
- Donovan A, Brownlie A, Zhou Y, Shepard J, Pratt SJ, Moynihan J, Paw BH, Drejer A, Barut B, Zapata A, et al. (2000) Positional cloning of zebrafish ferroportin1 identifies a conserved vertebrate iron exporter. Nature 403:776–781 [DOI] [PubMed] [Google Scholar]
- Dorey C, Cooper C, Dickson DP, Gibson JF, Simpson RJ, Peters TJ. (1993) Iron speciation at physiological pH in media containing ascorbate and oxygen. Br J Nutr 70:157–169 [DOI] [PubMed] [Google Scholar]
- Elinder F, Arhem P. (2003) Metal ion effects on ion channel gating. Q Rev Biophys 36:373–427 [DOI] [PubMed] [Google Scholar]
- Gaasch JA, Geldenhuys WJ, Lockman PR, Allen DD, Van der Schyf CJ. (2007) Voltage-gated calcium channels provide an alternate route for iron uptake in neuronal cell cultures. Neurochem Res 32:1686–1693 [DOI] [PubMed] [Google Scholar]
- Ganz T. (2011) Hepcidin and iron regulation, 10 years later. Blood 117:4425–4433 [DOI] [PMC free article] [PubMed] [Google Scholar]
- Garrick MD, Kuo HC, Vargas F, Singleton S, Zhao L, Smith JJ, Paradkar P, Roth JA, Garrick LM. (2006) Comparison of mammalian cell lines expressing distinct isoforms of divalent metal transporter 1 in a tetracycline-regulated fashion. Biochem J 398:539–546 [DOI] [PMC free article] [PubMed] [Google Scholar]
- Giorgio M, Trinei M, Migliaccio E, Pelicci PG. (2007) Hydrogen peroxide: a metabolic by-product or a common mediator of ageing signals? Nat Rev Mol Cell Biol 8:722–728 [DOI] [PubMed] [Google Scholar]
- Gunshin H, Mackenzie B, Berger UV, Gunshin Y, Romero MF, Boron WF, Nussberger S, Gollan JL, Hediger MA. (1997) Cloning and characterization of a mammalian proton-coupled metal-ion transporter. Nature 388:482–488 [DOI] [PubMed] [Google Scholar]
- Hering J, Feltz A, Lambert RC. (2004) Slow inactivation of the CaV3.1 isotype of T- type calcium channels. J Physiol 555:331–344 [DOI] [PMC free article] [PubMed] [Google Scholar]
- Hess P, Tsien RW. (1984) Mechanism of ion permeation through calcium channels. Nature 309:453–456 [DOI] [PubMed] [Google Scholar]
- Hodgkin AL, Huxley AF. (1952) The components of membrane conductance in the giant axon of Loligo. J Physiol 116:473–496 [DOI] [PMC free article] [PubMed] [Google Scholar]
- Horwitz LD, Rosenthal EA. (1999) Iron-mediated cardiovascular injury. Vasc Med 4:93–99 [DOI] [PubMed] [Google Scholar]
- Huang L, Keyser BM, Tagmose TM, Hansen JB, Taylor JT, Zhuang H, Zhang M, Ragsdale DS, Li M. (2004) NNC 55-0396 [(1S,2S)-2-(2-(N-[(3-benzimidazol-2-yl)propyl]-N-methylamino)ethyl)-6-fluoro-1,2,3,4-tetrahydro-1-isopropyl-2-naphtyl cyclopropanecarboxylate dihydrochloride]: a new selective inhibitor of T-type calcium channels. J Pharmacol Exp Ther 309:193–199 [DOI] [PubMed] [Google Scholar]
- Iancu TC, Shiloh H, Link G, Bauminger ER, Pinson A, Hershko C. (1987) Ultrastructural pathology of iron-loaded rat myocardial cells in culture. Br J Exp Pathol 68:53–65 [PMC free article] [PubMed] [Google Scholar]
- Kang HW, Park JY, Jeong SW, Kim JA, Moon HJ, Perez-Reyes E, Lee JH. (2006) A molecular determinant of nickel inhibition in CaV3.2 T-type calcium channels. J Biol Chem 281:4823–4830 [DOI] [PubMed] [Google Scholar]
- Khan N, Gray IP, Obejero-Paz CA, Jones SW. (2008) Permeation and gating in CaV3.1 (α1G) T-type calcium channels effects of Ca2+, Ba2+, Mg2+, and Na+. J Gen Physiol 132:223–238 [DOI] [PMC free article] [PubMed] [Google Scholar]
- Kim E, Giri SN, Pessah IN. (1995) Iron(II) is a modulator of ryanodine-sensitive calcium channels of cardiac muscle sarcoplasmic reticulum. Toxicol Appl Pharmacol 130:57–66 [DOI] [PubMed] [Google Scholar]
- Kremastinos DT, Farmakis D. (2011) Iron overload cardiomyopathy in clinical practice. Circulation 124:2253–2263 [DOI] [PubMed] [Google Scholar]
- Kumfu S, Chattipakorn S, Chinda K, Fucharoen S, Chattipakorn N. (2012) T-type calcium channel blockade improves survival and cardiovascular function in thalassemic mice. Eur J Haematol 88:535–548 [DOI] [PubMed] [Google Scholar]
- Kumfu S, Chattipakorn S, Srichairatanakool S, Settakorn J, Fucharoen S, Chattipakorn N. (2011) T-type calcium channel as a portal of iron uptake into cardiomyocytes of β-thalassemic mice. Eur J Haematol 86:156–166 [DOI] [PubMed] [Google Scholar]
- Kuryshev YA, Brittenham GM, Fujioka H, Kannan P, Shieh CC, Cohen SA, Brown AM. (1999) Decreased sodium and increased transient outward potassium currents in iron-loaded cardiac myocytes: implications for the arrhythmogenesis of human siderotic heart disease. Circulation 100:675–683 [DOI] [PubMed] [Google Scholar]
- Kwiatkowski JL. (2011) Management of transfusional iron overload: differential properties and efficacy of iron chelating agents. J Blood Med 2:135–149 [DOI] [PMC free article] [PubMed] [Google Scholar]
- Lane DJ, Robinson SR, Czerwinska H, Bishop GM, Lawen A. (2010) Two routes of iron accumulation in astrocytes: ascorbate-dependent ferrous iron uptake via the divalent metal transporter (DMT1) plus an independent route for ferric iron. Biochem J 432:123–132 [DOI] [PubMed] [Google Scholar]
- Liuzzi JP, Aydemir F, Nam H, Knutson MD, Cousins RJ. (2006) Zip14 (Slc39a14) mediates non-transferrin-bound iron uptake into cells. Proc Natl Acad Sci USA 103:13612–13617 [DOI] [PMC free article] [PubMed] [Google Scholar]
- Lopin KV, Obejero-Paz CA, Jones SW. (2010) Evaluation of a two-site, three-barrier model for permeation in CaV3.1 (α1G) T-type calcium channels: Ca2+, Ba2+, Mg2+, and Na+. J Membr Biol 235:131–143 [DOI] [PubMed] [Google Scholar]
- Lopin KV, Thévenod F, Page JC, Jones SW. (2012) Cd2+ block and permeation of CaV3.1 (α1G) T-type calcium channels: candidate mechanism for Cd2+ influx. Mol Pharmacol 82:1183–1193 [DOI] [PubMed] [Google Scholar]
- Loréal O, Gosriwatana I, Guyader D, Porter J, Brissot P, Hider RC. (2000) Determination of non-transferrin-bound iron in genetic hemochromatosis using a new HPLC-based method. J Hepatol 32:727–733 [DOI] [PubMed] [Google Scholar]
- Mills E, Dong XP, Wang F, Xu H. (2010) Mechanisms of brain iron transport: insight into neurodegeneration and CNS disorders. Future Med Chem 2:51–64 [DOI] [PMC free article] [PubMed] [Google Scholar]
- Mwanjewe J, Grover AK. (2004) Role of transient receptor potential canonical 6 (TRPC6) in non-transferrin-bound iron uptake in neuronal phenotype PC12 cells. Biochem J 378:975–982 [DOI] [PMC free article] [PubMed] [Google Scholar]
- Nemeth E, Tuttle MS, Powelson J, Vaughn MB, Donovan A, Ward DM, Ganz T, Kaplan J. (2004) Hepcidin regulates cellular iron efflux by binding to ferroportin and inducing its internalization. Science 306:2090–2093 [DOI] [PubMed] [Google Scholar]
- Obejero-Paz CA, Gray IP, Jones SW. (2008) Ni2+ block of CaV3.1 (α1G) T-type calcium channels. J Gen Physiol 132:239–250 [DOI] [PMC free article] [PubMed] [Google Scholar]
- Obejero-Paz CA, Gray IP, Jones SW. (2004) Y3+ block demonstrates an intracellular activation gate for the α1G T-type Ca2+ channel. J Gen Physiol 124:631–640 [DOI] [PMC free article] [PubMed] [Google Scholar]
- Oshiro S, Morioka MS, Kikuchi M. (2011) Dysregulation of iron metabolism in Alzheimer's disease, Parkinson's disease, and amyotrophic lateral sclerosis. Adv Pharmacol Sci 2011:378278. [DOI] [PMC free article] [PubMed] [Google Scholar]
- Oudit GY, Sun H, Trivieri MG, Koch SE, Dawood F, Ackerley C, Yazdanpanah M, Wilson GJ, Schwartz A, Liu PP, et al. (2003) L-type Ca2+ channels provide a major pathway for iron entry into cardiomyocytes in iron-overload cardiomyopathy. Nat Med 9:1187–1194 [DOI] [PubMed] [Google Scholar]
- Park CH, Valore EV, Waring AJ, Ganz T. (2001) Hepcidin, a urinary antimicrobial peptide synthesized in the liver. J Biol Chem 276:7806–7810 [DOI] [PubMed] [Google Scholar]
- Parkes JG, Liu Y, Sirna JB, Templeton DM. (2000) Changes in gene expression with iron loading and chelation in cardiac myocytes and non-myocytic fibroblasts. J Mol Cell Cardiol 32:233–246 [DOI] [PubMed] [Google Scholar]
- Pelizzoni I, Macco R, Morini MF, Zacchetti D, Grohovaz F, Codazzi F. (2011) Iron handling in hippocampal neurons: activity-dependent iron entry and mitochondria-mediated neurotoxicity. Aging Cell 10:172–183 [DOI] [PubMed] [Google Scholar]
- Perez-Reyes E. (2003) Molecular physiology of low-voltage-activated T-type calcium channels. Physiol Rev 83:117–161 [DOI] [PubMed] [Google Scholar]
- Rodman DM, Reese K, Harral J, Fouty B, Wu S, West J, Hoedt-Miller M, Tada Y, Li KX, Cool C, et al. (2005) Low-voltage-activated (T-type) calcium channels control proliferation of human pulmonary artery myocytes. Circ Res 96:864–872 [DOI] [PubMed] [Google Scholar]
- Serrano JR, Dashti SR, Perez-Reyes E, Jones SW. (2000) Mg2+ block unmasks Ca2+/Ba2+ selectivity of α1G T-type calcium channels. Biophys J 79:3052–3062 [DOI] [PMC free article] [PubMed] [Google Scholar]
- Serrano JR, Perez-Reyes E, Jones SW. (1999) State-dependent inactivation of the α1G T-type calcium channel. J Gen Physiol 114:185–201 [DOI] [PMC free article] [PubMed] [Google Scholar]
- Stankiewicz JM, Brass SD. (2009) Role of iron in neurotoxicity: a cause for concern in the elderly? Curr Opin Clin Nutr Metab Care 12:22–29 [DOI] [PubMed] [Google Scholar]
- Traboulsie A, Chemin J, Chevalier M, Quignard JF, Nargeot J, Lory P. (2007) Subunit-specific modulation of T-type calcium channels by zinc. J Physiol 578:159–171 [DOI] [PMC free article] [PubMed] [Google Scholar]
- Tsushima RG, Wickenden AD, Bouchard RA, Oudit GY, Liu PP, Backx PH. (1999) Modulation of iron uptake in heart by L-type Ca2+ channel modifiers: possible implications in iron overload. Circ Res 84:1302–1309 [DOI] [PubMed] [Google Scholar]
- Viollier E, Inglett PW, Hunter K, Roychoudhury AN, Van Cappellen P. (2000) The ferrozine method revisited: Fe(II)/Fe(III) determination in natural waters. Appl Geochem 15:785–790 [Google Scholar]
- Wan S, Hua Y, Keep RF, Hoff JT, Xi G. (2006) Deferoxamine reduces CSF free iron levels following intracerebral hemorrhage. Acta Neurochir Suppl 96:199–202 [DOI] [PubMed] [Google Scholar]
- Wang SM, Fu LJ, Duan XL, Crooks DR, Yu P, Qian ZM, Di XJ, Li J, Rouault TA, Chang YZ. (2010) Role of hepcidin in murine brain iron metabolism. Cell Mol Life Sci 67:123–133 [DOI] [PMC free article] [PubMed] [Google Scholar]
- Winegar BD, Kelly R, Lansman JB. (1991) Block of current through single calcium channels by Fe, Co, and Ni: location of the transition metal binding site in the pore. J Gen Physiol 97:351–367 [DOI] [PMC free article] [PubMed] [Google Scholar]
- Woodhull AM. (1973) Ionic blockage of sodium channels in nerve. J Gen Physiol 61:687–708 [DOI] [PMC free article] [PubMed] [Google Scholar]
- Yunker AMR, McEnery MW. (2003) Low voltage-activated (“T-type”) calcium channels in review. J Bioenerg Biomembr 35:533–575 [DOI] [PubMed] [Google Scholar]
- Zhang AS, Enns CA. (2009) Molecular mechanisms of normal iron homeostasis. Hematology Am Soc Hematol Educ Program 207–214 [DOI] [PMC free article] [PubMed] [Google Scholar]
- Zhou W, Jones SW. (1995) Surface charge and calcium channel saturation in bullfrog sympathetic neurons. J Gen Physiol 105:441–462 [DOI] [PMC free article] [PubMed] [Google Scholar]


