

Abstract
Bioprocesses conducted under conditions with restricted O2 supply are increasingly exploited for the synthesis of reduced biochemicals using different biocatalysts. The model facultative anaerobe Escherichia coli has elaborate sensing and signal transduction mechanisms for redox control in response to the availability of O2 and other electron acceptors. The ArcBA two-component system consists of ArcB, a membrane-associated sensor kinase, and ArcA, the cognate response regulator. The tripartite hybrid kinase ArcB possesses a transmembrane, a PAS, a primary transmitter (H1), a receiver (D1), and a phosphotransfer (H2) domain. Metabolic fluxes were compared under anoxic conditions in a wild-type E. coli strain, its ΔarcB derivative, and two partial arcB deletion mutants in which ArcB lacked either the H1 domain or the PAS-H1-D1 domains. These analyses revealed that elimination of different segments in ArcB determines a distinctive distribution of d-glucose catabolic fluxes, different from that observed in the ΔarcB background. Metabolite profiles, enzyme activity levels, and gene expression patterns were also investigated in these strains. Relevant alterations were observed at the P-enol-pyruvate/pyruvate and acetyl coenzyme A metabolic nodes, and the formation of reduced fermentation metabolites, such as succinate, d-lactate, and ethanol, was favored in the mutant strains to different extents compared to the wild-type strain. These phenotypic traits were associated with altered levels of the enzymatic activities operating at these nodes, as well as with elevated NADH/NAD+ ratios. Thus, targeted modification of global regulators to obtain different metabolic flux distributions under anoxic conditions is emerging as an attractive tool for metabolic engineering purposes.
INTRODUCTION
Anoxic fermentation of different carbon sources by Escherichia coli is increasingly gaining momentum in biotechnological setups designed to obtain reduced biochemicals. Relevant examples in this sense include (but are certainly not limited to) the production of ethanol (31, 58, 69), succinate (64), d-lactate (45), and polyhydroxyalkanoates (24, 40), often by using redox and/or regulatory E. coli mutants as the biocatalyst. These metabolic engineering approaches underscore the need for a complete understanding of the cell physiology and metabolic network operativity under anoxic growth conditions. In fact, the relative lack of knowledge on the cellular wiring of these regulatory networks under conditions relevant to both laboratory and industrial applications represents a hurdle that has to be overcome for the efficient design of industrial processes. Metabolic fluxes through the central carbon pathways constitute the backbone of cell metabolism and represent the in vivo reaction rates of cognate enzymatic steps (62). The observed fluxome is the phenotypic consequence of both gene transcription and translation, as well as of the enzymatic activity and the regulation exerted at the metabolite level (48). Fluxome analysis is thus a useful approach to study the phenotype of global regulatory mutants and constitutes a helpful strategy to explore their biotechnological potential.
In E. coli, the metabolic regulation in response to changes in O2 availability is mainly orchestrated by the ArcBA (anoxic redox control) two-component system (1, 6, 9, 36, 59), composed of ArcB, the tripartite membrane-associated sensor kinase, and ArcA, the cognate response regulator. The ArcB sensor has a small transmembrane domain comprising 16 amino acid residues followed by a leucine zipper and a PAS domain that connects the transmembrane domain to the catalytic domains. PAS domains monitor changes in light, redox potential, and the overall energy state of cells (63). ArcB also possesses three catalytic domains (Fig. 1): a primary transmitter domain (H1), containing a conserved His292; a receiver domain (D1), containing a conserved Asp576; and a phosphotransfer (secondary transmitter) domain (H2), containing a conserved His717 (23, 28, 29). ArcA phosphorylation takes place through a phosphorelay process involving all three catalytic domains (34). Under microoxic conditions, ArcB undergoes autophosphorylation by using ATP as the phosphodonor (49), followed by intramolecular phosphate transfer and transphosphorylation of ArcA (22, 37). ArcA∼P modulates the expression of ca. 135 genes (54), mainly acting as a negative transcriptional regulator of genes encoding enzymes involved in aerobic pathways, such as the major dehydrogenase enzymes of the tricarboxylic acid (TCA) cycle and the glyoxylate shunt (60). Genes encoding enzymes related to fermentation pathways become activated by ArcA∼P under microoxic or anoxic conditions (36, 44, 50). Respiratory pathways are also affected by the ArcBA system, and the expression of cyoABCDE and cydAB is repressed and activated by ArcA∼P, respectively (36, 60). These rather complex transcriptional regulation patterns were elucidated based on genome-wide patterns of gene expression (52, 54). Unfortunately, and due to the diverse regulatory mechanisms that operate both at the posttranslational and enzymatic activity levels, it is frequently difficult to infer phenotypic traits in regulatory mutants from these analyses.
Fig 1.
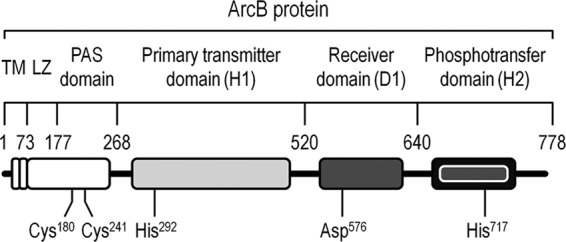
Schematic representation of the ArcB sensor of the ArcBA system. The different modules in the sensor protein are indicated with boxes, along with the amino acid coordinates they span. Individual amino acids relevant for the intramolecular phosphorelay that passes the phosphate residue among the different ArcB domains (and which ultimately leads to phosphorylation of ArcA) are shown below the corresponding modules in the protein. Note that the elements in this outline are not drawn to scale. TM, transmembrane domain; LZ, leucine zipper.
The biochemical mechanism of the ArcBA regulatory system has been deciphered in vitro (2, 21, 23). Quinones and menaquinones are responsible for transmitting the perceived redox state to the ArcB cytoplasmic domains. In their oxidized form, these membrane-associated electron carriers inhibit the autophosphorylation of ArcB (5). The silencing of the ArcB phosphorelay has also been elucidated. In this case, disulfide bridges between two ArcB monomers are formed under aerobic conditions by transferring one electron from Cys180 and Cys241, both within the PAS domain, to quinone acceptors, thus allowing the dephosphorylation of ArcA (21). More recently, Rolfe et al. (52) demonstrated that the ArcB phosphatase activity is also regulated by fermentation metabolites, adding a further level of complexity to the currently accepted model for ArcBA-mediated transcriptional regulation. Yet, very little is known about the in vivo effects of different arcB mutations on the central metabolic pathways of E. coli under anoxic growth conditions.
In this study, the phenotypic and metabolic effects of targeted arcB deletions on the central carbon metabolism of E. coli were systematically evaluated under anoxic growth conditions through the analysis of growth parameters and the patterns of fermentation metabolites. The incremental deletions implemented spanned both catalytic and structural parts of the ArcB sensor. The information was integrated into an in silico stoichiometric model of the central catabolic pathways and was further substantiated by studying the transcription patterns of selected genes as well as by in vitro measurements of relevant enzymatic activities. Taken together, the results show an incremental impact of partial deletions in ArcB on the distribution of metabolic fluxes under anoxic growth conditions that can be traced to the redox state. The incremental differences observed both in redox homeostasis and central carbon fluxes among the mutant strains make them attractive for biotechnological purposes.
MATERIALS AND METHODS
Bacterial strains, oligonucleotides, and plasmids.
All Escherichia coli strains used in this study are listed in Table 1, along with the oligonucleotides and plasmids used in this work.
Table 1.
E. coli strains, oligonucleotides, and plasmids used in this study
| Strain, oligonucleotide, or plasmid | Relevant characteristics or sequence (5′→3′) | Source or reference |
|---|---|---|
| E. coli strains | ||
| K1060a | Considered wild type in this study; F− fadE62 lacI60 tyrT58(AS) fabB5 mel-1 | 46 |
| GNB1061 | Same as K1060, but ArcB268–520; confined deletion between nt 802 and 1560 of arcB | This study |
| GNB1062 | Same as K1060, but ArcB177–640; confined deletion between nt 529 and 1920 of arcB | This study |
| GNB1063 | Same as K1060, but ΔarcB | This study |
| Oligonucleotidesb | ||
| ΔPAS-F | TCC TTG ATG CTT CAC CCG ACC TGG TTT TTT ATC GTA ACG AAG ATA AAG AGG TGT AGG CTG GAG CTG CTT C | This study |
| ΔD1-R | TCT TCT GTC GTC ACC GTA CTC TCC TCA TCA TCC TGG GTA TCC CAG AAT TTC ATA TGA ATA TCC TCC TTA G | This study |
| ΔH1-F | ACC GCG TGG GTA AAC GTC ACG GTT TGA TGG GCT TTG GTC GCG ACA TTA CCG TGT AGG CTG GAG CTG CTT C | This study |
| ΔH1-R | TTC AGT TCA ATG TCT TCC ACC AGC AGC ACA TTC AGC GCC GGT AAA GGC ATC ATA TGA ATA TCC TCC TTA G | This study |
| ΔarcB-F | AAC GTA ACT GTC AGA ATT GGG TAT TAT TGG GGC AGG TTG TCG TGA AGG AAG TGT AGG CGT GAG CTG CTT C | This study |
| ΔarcB-R | ATA ATA ATT TAC GGC CGA GCC AAG ATT TCC CTG GTG TTG GCG CAG TAT TCC ATA TGA ATA TCC TCC TTA G | This study |
| arcB1-C-F | GGG TAT TAT TGG GGC AGG TT | This study |
| arcB1-C-R | GTC TAG CCG GGG TCA TTT TT | This study |
| arcB2-C-F | AAT GAT TCG CCA TAC GCC AC | This study |
| arcB2-C-R | GTG CTG TGC CCT TGT AAC TC | This study |
| PDH-C-F | GAG CAA CTG GAG GAG TCA CG | This study |
| PAS-C-R | GCA AGG AAG CTG GTG AAA TC | This study |
| H1-C-R | GGT GAT CAG CTT CGG TCC TA | This study |
| D1-C-R | CGG AAG GTC AGG AGA CTG AA | This study |
| rrsA-RT-F | AGG CCT TCG GGT TGT AAA GT | This study |
| rrsA-RT-R | ATT CCG ATT AAC GCT TGC AC | This study |
| pfkA-RT-F | GGT GCC TTA CGA CCG TAT TC | This study |
| pfkA-RT-R | GGA CGC TTC ATG TTT TCG AT | This study |
| ldhA-RT-F | AGT CCG TGT TCC AGC CTA TG | This study |
| ldhA-RT-R | CGG TCA GAC CTT CCA GAG AG | This study |
| pflB-RT-F | GCG AAA TAC GGC TAC GAC AT | This study |
| pflB-RT-R | CAT CCA GGA AGG TGG AGG TA | This study |
| ackA-RT-F | CGT TGA CGC AAT CAA CAA AC | This study |
| ackA-RT-R | GGT GGC AGT AAA CG TCC ATT | This study |
| adhE-RT-F | CTG GCA GGC TTC TCT GTA CC | This study |
| adhE-RT-R | TAC CGC GTC TTC GAA ATC TT | This study |
| frdA-RT-F | CGA TAA GAC CGG CTT CCA TA | This study |
| frdA-RT-R | CCT TCC ATC ATG TTC ATT GCT | This study |
| arcA-RT-F | TGT TTT CGA AGC GAC AGA TG | This study |
| arcA-RT-R | GAA CAT CAA CGC AAC ATT CG | This study |
| Plasmids | ||
| pKD46 | Vector containing λ Red (γ, β, and exo) recombination functions under control of ParaB promoter; oriR101 repA101(Ts); Apr | 14 |
| pKD4 | Vector used as template for amplification of FRT-aphA-FRT; oriR6Kγ; Apr Kmr | 14 |
| pCP20 | Vector expressing FLP recombinase from S. cerevisiae; λ cI857 λ PR FLP repA(Ts); Apr Cmr | 12 |
Strain obtained through the E. coli Genetic Stock Center, University of Yale, CT.
Sequences with homology to FRT-aphA-FRT in the template plasmid pKD4 are shown in boldface. Oligonucleotides used for deletions are preceded by the symbol Δ, and those used to check deletions are followed by the letter C. Oligonucleotides used for quantitative RT-PCR experiments are codified as target gene-RT-F or -R.
DNA manipulations and mutant construction.
Standard DNA procedures followed well-established protocols (55) and specific recommendations from manufacturers. Different protein domains in ArcB were eliminated by using the λ Red recombination technology (14) in wild-type E. coli K1060. E. coli GNB1061, GNB1062, and GNB1063 were generated using amplification products (i.e., FRT-aphA-FRT) obtained by PCR with oligonucleotides ΔH1-F and ΔH1-R, ΔPAS-F and ΔD1-R, and ΔarcB-F and ΔarcB-R, respectively, and plasmid pKD4 as the template. A DNA fragment encompassing nucleotides 802 to 1560 of arcB was deleted in E. coli GNB1061, resulting in an ArcB derivative in which the entire H1 domain was removed (i.e., ArcB268–520). In E. coli GNB1062, the PAS, H1, and D1 domains (i.e., ArcB177–640) were eliminated by deletion of the DNA segment between nucleotides 529 and 1920 of arcB (Fig. 1). Both partial deletion mutants have an intact transmembrane domain to ensure that the corresponding ArcB variants are located within the cell membrane. An arcB deletion mutant termed E. coli GNB1063 was also constructed using the same methodology. Antibiotic resistance determinants were eliminated by FLP-mediated recombination with plasmid pCP20 (13). A suitable pairwise combination of the oligonucleotides arcB1-C-F, arcB1-C-R, arcB2-C-F, arcB2-C-R, PDH-C-F, PAS-C-R, H1-C-R, and D1-C-R (Table 1), followed by DNA sequencing of the corresponding amplicons, was used to confirm that the correct deletions were introduced into the arcB locus.
Growth media and culture conditions.
All cultures were incubated at 37°C at the indicated rotary agitation. During mutant constructions and for inoculum preparation, cells were grown in LB medium (55) under aerobic conditions. Precultures and working cultures were grown under anoxic conditions in 100-ml bottles containing 90 ml of M9 minimal medium (pH 7.2 ± 0.2) containing 3% (wt/vol) d-glucose as the sole carbon source and supplemented with 1 g/liter Na2S as a reducing agent. Addition of Na2S did not translate into significant differences in the kinetic and growth properties of the strains under study (data not shown). Bottles were incubated with shaking at 125 rpm to avoid biomass sedimentation, and anoxic conditions were qualitatively checked by adding 50 μg/liter resazurin to the culture medium. Whenever needed, antibiotics were used at the following concentrations: ampicillin, 100 μg/ml; kanamycin, 50 μg/ml; and chloramphenicol, 30 μg/ml. The dye phenotype of the strains, when growing under aerobic conditions on toluidine blue O agar medium, was evaluated as previously described (11, 53).
Analytical procedures.
Biomass concentration was determined as the cell dry weight (CDW) fraction of washed pellets from appropriate broth aliquots dried at 65°C to constant weight. Dried samples were allowed to cool and held in vacuo until weighed.
Extracellular metabolic products and residual d-glucose in culture supernatants were determined by high-performance liquid chromatography (HPX-87H column; Bio-Rad Laboratories, Hercules, CA) as previously described (15). In some experiments, H2 evolution was measured by headspace gas chromatography using a column packed with a divinylbenzene porous polymer (HayeSep DB; HayeSeparations Inc., Bandera, TX) and a thermal conductivity detector in a Varian3000 gas chromatograph and a 4000MS ion trap mass spectrometer (Bruker Daltonik GmbH, Bremen, Germany).
The intracellular content of NADH, NADPH, NAD+, and NADP+ was estimated by using in vitro procedures based on rapid inactivation of the metabolism of growing cells followed by acid or alkaline extraction of nucleotides. Nucleotide content was determined by spectrophotometric cycling assays with 3-(4,5-dimethylthiazol-2-yl)-2,5-diphenyltetrazolium bromide as the final electron acceptor (7, 41).
Metabolic flux analysis based on metabolic pathway balances.
A metabolic network designed for anaerobic E. coli cells was drafted, including the biochemical reactions corresponding to the Embden-Meyerhof-Parnas pathway, biomass generation from d-glucose-6-P, and fermentation pathways from P-enol-pyruvate, pyruvate, and acetyl coenzyme A (CoA) (Fig. 2). Fermentation stoichiometry was derived from metabolic pathway balances. Cell composition was assumed to be the same in all experimental strains, and it was derived from the data reported by Neidhardt et al. (38). Time-averaged concentrations in batch cultures, in which the specific rates of synthesis vary between two successive sampling periods (t and t + Δt), were estimated based on the average cell density according to the procedure described by Aristidou et al. (4). This methodology provides a good estimate when the specific rate of synthesis and the specific growth rate are more or less constant during consecutive sampling points, conditions which are assumed to be met under balanced growth (67). Metabolic fluxes (in mmol/g/h) were calculated from time-averaged concentrations of secretion metabolites and carbon source and represent the averages of 4 to 5 independent sampling points at about the mid-exponential growth phase (i.e., within balanced growth). Calculations that spanned the entire fermentation period indicated that indeed the time dependency of the fluxes was smallest during this interval (data not shown). The metabolic matrix was constructed based on the law of mass conservation and on the pseudo-steady-state hypothesis for the intracellular intermediate metabolites (42, 56, 65). This formulation results in a set of linear equations that can be expressed as a stoichiometric matrix A of dimensions m by n, which is in turn related to vectors for net accumulation, r(m × 1), and for metabolic fluxes, v(n × 1). Considering the 13 reactions of the metabolic network (Fig. 2), and based solely on the measured extracellular metabolites and pseudo-steady-state hypothetical balances of the intracellular intermediate metabolites, A becomes a square matrix (m = v = 13). The number of degrees of freedom equals the number of variables that are actually measured to describe the system or, in some cases, are derived from experimental measurements. Standard mathematical methods were applied for the resolution of A · v = r = 0, and all fluxes within the network were derived from these stoichiometric constraints. Carbon balances were calculated from all the experimental and in silico-calculated fluxes, as well as the specific rate of CO2 evolution and biomass synthesis.
Fig 2.
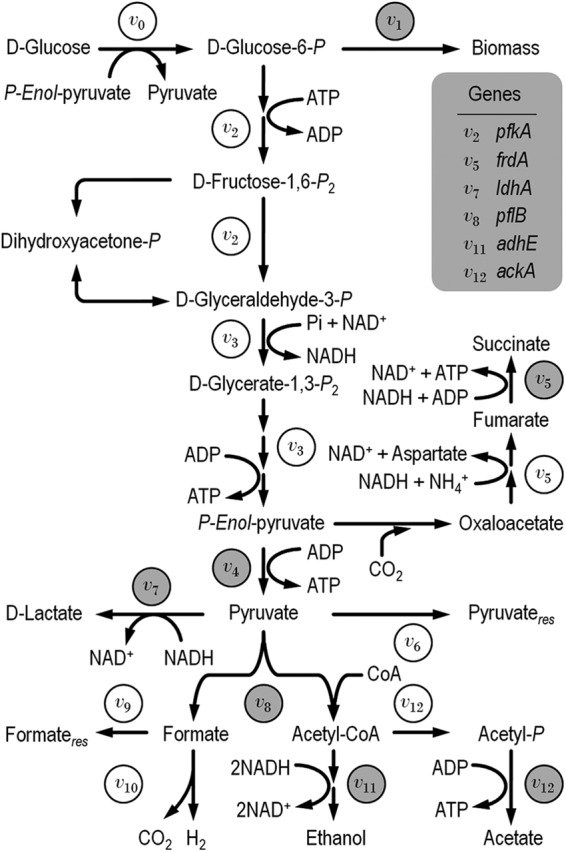
Metabolic network used to study central catabolism of d-glucose in different E. coli arcB mutants under anoxic conditions. Fluxes within the network are codified as v0 (which corresponds to the specific rate of d-glucose consumption) to v12. Note that in this representation some biochemical reactions (e.g., those generating biomass precursors from d-glucose-6-P) are lumped into a single flux in order to simplify the representation of the biochemical network. Enzymes that were assayed in vitro are highlighted in gray in the corresponding flux at which they are involved, and genes quantified at the transcriptional level are shown in a gray box beside their associated flux. The subscript res indicates accumulation of either residual pyruvate or formate in the culture medium.
qRT-PCR.
Genes studied in this work and the oligonucleotides used to analyze their expression are listed in Table 1. Culture samples were centrifuged at 10,000 × g for 5 min at 4°C, washed once in ice-cold 50 mM Tris-HCl buffer (pH 7.5), and then pelleted by centrifugation under the same conditions before total RNA was isolated using a commercially available kit (TRIzol Max bacterial RNA isolation kit; Life Technologies, Grand Island, NY). Quantitative reverse transcription-PCRs (qRT-PCRs) were carried out in an Applied Biosystems 7900HT Fast real-time PCR system (Life Technologies) using the Promega (Madison, WI) reverse transcription system. In RT reactions, the reaction mixture (containing 1 μg of RNA in 60-μl reaction mixtures) was incubated for 10 min at room temperature, followed by 30 min at 50°C for reverse transcription, 5 min at 94°C, and 10 min at 65°C for reverse transcriptase inactivation. Amplification controls (containing RNA but not reverse transcriptase) were included in each run. The first-strand cDNA was diluted to 250 μl with nuclease-free H2O and further diluted 10-fold as needed. Quantitative PCRs were carried out in 96-well plates; each well contained 20 μl of a reaction mixture consisting of 2 μl diluted cDNA, 2 μl premixed primers (1.25 pmol/μl), 10 μl SYBR green PCR master mix, and 6 μl nuclease-free H2O. Reaction mixtures were incubated for 2 min at 50°C and 10 min at 94°C (Taq DNA polymerase activation), followed by 40 cycles of 15 s at 94°C (denaturation), and 1 min at 60°C (annealing and extension). Each plate included amplification controls as well as samples without template. The comparative threshold cycle method (ΔΔCT) was applied for relative quantification of gene expression, and rrsA, encoding the 16S subunit of rRNA, was used as the control gene.
Enzyme activity measurements.
Cells were harvested at an optical density at 600 nm of 0.5 to 0.7 by centrifugation at 10,000 × g for 15 min at 4°C, washed twice with ice-cold 50 mM Tris-HCl buffer (pH 7.5) containing 20 mM KCl, 5 mM MgSO4, 2 mM 1,4-dithio-d-threitol, and 0.1 mM EDTA, and finally resuspended in the same buffer (ca. 0.5 g [wet weight] of cells in 1 ml of buffer solution). The resulting cell suspension was stored at −20°C for 3 h, thawed in an ice bath, and disrupted by sonication. Cell extracts were obtained by centrifugation at 15,000 × g for 30 min and 4°C. Crude enzyme extracts were immediately used for determinations as well as to measure protein concentrations by means of the Bradford method (8). Enzyme activities were assayed spectrophotometrically in a thermostated recording Beckman DU 650 spectrophotometer (Beckman Coulter Inc., Fullerton, CA). The components of the reaction mixtures were pipetted into a cuvette with a 1-cm light path, and the reaction was initiated by adding the cell extract or the appropriate substrate to give a final volume of 1 ml. Standard in vitro protocols for pyruvate kinase (61), d-glucose-6-P 1-dehydrogenase (20), pyruvate-formate lyase (33), d-lactate dehydrogenase (10), succinate dehydrogenase (68), citrate synthase (17), alcohol dehydrogenase (35), and acetate kinase (19) were used to estimate the enzymatic activities at stake. The extinction coefficient at 340 nm used for NADH and NADPH was 6.22 mM−1 cm−1, and 1 unit of the specific enzyme activity was defined as the amount of enzyme required to convert 1 μmol of the substrate into the specific product per minute per milligram of protein.
Statistical analysis.
All reported experiments were independently repeated at least twice, and the mean values of the corresponding parameter ± standard deviation (and, in the case of metabolic flux analysis, 90% confidence interval) are presented. Determination of statistical significance between multiple comparisons was assessed using analysis of variance (ANOVA; with α = 0.01 and 0.05) followed by a Bonferroni posttest using transformed data whenever necessary.
RESULTS
Evaluation of the dye phenotype in E. coli strains expressing different ArcB variants.
The dye phenotype, i.e., sensitivity to the redox dye toluidine blue O (3, 53), was analyzed as a coarse estimation of the phenotypic effects caused by the deletions implemented in arcB. This phenotype has been shown to reflect the overall physiology of the cells as a consequence of the multitiered regulation exerted by the ArcBA system both on redox homeostasis and the distribution of central carbon fluxes (3, 30, 39, 53). Cultures of E. coli K1060 (wild-type strain), GNB1061 (ArcB268–520), GNB1062 (ArcB177–640), and GNB1063 (ΔarcB) were spotted onto plates containing toluidine blue O, and their growth was scored after overnight incubation. E. coli K1060 grew well in the presence of this dye, whereas the ΔarcB strain formed much smaller colonies. However, E. coli GNB1061 and GNB1062 differed noticeably in their ability to grow on this medium (data not shown). While E. coli GNB1061 formed colonies somewhat bigger than those of the ΔarcB strain (yet smaller than those of the wild-type strain), E. coli GNB1062 exhibited a phenotype similar to that observed for the ΔarcB strain. These traits prompted us to further evaluate the metabolic properties in the mutants that caused the alterations in colony size.
E. coli strains expressing different ArcB variants exhibited incremental phenotypic features.
Growth kinetic parameters of the strains under study were next analyzed in anoxic batch cultures. All experiments were conducted in M9 minimal medium supplemented with 3% (wt/vol) d-glucose in the absence of O2, as the ArcBA two-component system is known to be active under these culture conditions (9). Interestingly, biomass concentration obtained after 24 h of cultivation was lower for mutants expressing the ArcB variants in comparison with the wild-type strain (i.e., 36% and 60% lower for E. coli GNB1061 and GNB1062, respectively; Table 2). We also observed a reduction in the specific growth rate (μmax) of the mutant strains (i.e., 21% and 53% for GNB1061 and GNB1062, respectively; P < 0.05). As expected, E. coli GNB1063 showed the highest reduction in both final biomass concentration and μmax (i.e., 72% and 68% lower, respectively, compared to the wild-type strain; P < 0.05), which was much lower than that observed in the strains bearing ArcB variants. The extension of the exponential phase of growth was between 1.1- and 1.6-fold shorter for the arcB mutants than for the wild-type strain, in a similar fashion to that observed in the distribution of specific growth rates.
Table 2.
Fermentation and growth parametersa for 24-h anoxic batch cultures in M9 minimal medium with 3% (wt/vol) d-glucose as carbon source
| E. coli strain | Relevant characteristic | Biomass (g/liter) | μmaxb (h−1) | Sp rate of d-glucose consumptionb (mmol/g/h) | YX/S (mg/g) |
|---|---|---|---|---|---|
| K1060 | Wild-type strain | 0.65 ± 0.08 | 0.34 ± 0.02 | 7.22 ± 0.05 | 79 ± 2 |
| GNB1061 | ArcB268–520 | 0.43 ± 0.04 | 0.27 ± 0.03 | 6.07 ± 0.04 | 54 ± 2 |
| GNB1062 | ArcB177–640 | 0.26 ± 0.03 | 0.16 ± 0.01 | 5.31 ± 0.08 | 27 ± 1 |
| GNB1063 | ΔarcB | 0.18 ± 0.02 | 0.11 ± 0.02 | 4.85 ± 0.06 | 21 ± 3 |
Reported results represent means ± standard deviations of triplicate measurements from at least two independent cultures.
The specific growth rate and the specific rate of d-glucose consumption were determined during balanced growth.
Specific rates of d-glucose consumption and yields of biomass on d-glucose (YX/S) were also determined in these cultures. All strains carrying ArcB variants showed a reduction in both parameters that qualitatively correlated with the results obtained for the specific growth rates and final biomass concentrations (Table 2). The more marked differences among the partial mutants were observed in E. coli GNB1062, which showed a 27% and 62% reduction in both the specific rate of d-glucose consumption and YX/S, respectively, compared to E. coli K1060 (P < 0.05). The ΔarcB strain exhibited a 40% and 73% reduction in the specific rate of d-glucose consumption and YX/S, respectively, compared to the wild-type strain (P < 0.01).
In order to evaluate the metabolic state of the cells, the concentrations of key fermentation metabolites were analyzed in culture supernatants of E. coli K1060 and the arcB mutant strains growing during 24 h under anoxic conditions, and the corresponding yields on the carbon substrate were calculated. Metabolites detected in all cultures were formate, d-lactate, succinate, ethanol, and acetate. Higher concentrations of metabolic products in which carbon atoms are more reduced than in d-glucose were observed in cultures of the arcB strains compared to those of E. coli K1060. The most significant differences in terms of yields on d-glucose were observed in acetate and ethanol. The acetate yield on d-glucose in the wild-type strain reached 0.89 ± 0.07 mol/mol. While E. coli GNB1061 had a similar acetate yield (0.91 ± 0.07 mol/mol), E. coli GNB1062 and GNB1063 had significantly lower values for this parameter than the wild-type strain (0.68 ± 0.05 and 0.59 ± 0.04 mol/mol, respectively; P < 0.01). On the other hand, the yield of ethanol (the most reduced metabolite) on d-glucose followed the opposite trend. While in E. coli K1060 it reached 0.52 ± 0.02 mol/mol, the values for E. coli GNB1061, GNB1062, and GNB1063 were, respectively, 0.59 ± 0.01, 0.81 ± 0.04, and 0.89 ± 0.03 mol/mol.
The patterns of secreted fermentation metabolites correlate with differences in the redox state in the arcB mutants.
As the fate of carbon atoms at the acetyl-CoA node seemed to be markedly different in the strains analyzed, we next studied the ethanol/acetate molar ratios under anoxic growth conditions. Given the difference in the oxidation state of carbon atoms in these fermentation products, their molar ratios provide a good estimation of the redox state of the cell (42, 59). All arcB mutant strains showed significantly higher ethanol/acetate ratios than that obtained for E. coli K1060 (Table 3), which offered a strong indication of an altered redox metabolism in the mutants. Among the partial deletion strains studied, E. coli GNB1062 had the highest ethanol/acetate ratio (i.e., 40% higher than that of the wild-type strain). The ΔarcB strain was the most severely affected in terms of redox balance, with an ethanol/acetate ratio 53% higher than that of the wild-type strain. In order to further correlate the synthesis of oxidized and reduced fermentation metabolites with the redox state, we measured the actual cellular content of nicotinamide dinucleotides (Table 3). In full accordance with the ethanol/acetate ratios, a significant bias toward elevated NADH/NAD+ ratios was observed in the arcB mutants. In particular, E. coli GNB1062 and GNB1063 had similar NADH/NAD+ ratios, which were 44% and 69% higher than that of the wild-type strain, respectively. Interestingly, the NAD+ plus NADH content of the cells remained almost constant among the strains under study (ca. 6 μmol/g).
Table 3.
Redox parametersa for 24-h anoxic batch cultures in M9 minimal medium with 3% (wt/vol) d-glucose as carbon source
| E. coli strain | Relevant characteristic | Intracellular content (μmol/g) of: |
NADH/NAD+ ratio (mol/mol) | Ethanol/acetate ratio (mol/mol) | |
|---|---|---|---|---|---|
| NADH | NAD+ | ||||
| K1060 | Wild-type strain | 2.03 ± 0.09 | 3.96 ± 0.07 | 0.51 ± 0.05 | 0.53 ± 0.05 |
| GNB1061 | ArcB268–520 | 2.14 ± 0.08 | 3.45 ± 0.21 | 0.62 ± 0.04 | 0.63 ± 0.03 |
| GNB1062 | ArcB177–640 | 2.91 ± 0.12 | 3.93 ± 0.15 | 0.74 ± 0.08 | 0.74 ± 0.03 |
| GNB1063 | ΔarcB | 2.61 ± 0.05 | 3.02 ± 0.09 | 0.86 ± 0.06 | 0.81 ± 0.02 |
Reported results represent means ± standard deviations of duplicate measurements from at least two independent cultures.
Metabolic flux distribution in central catabolic pathways was differentially affected by the redox state in the arcB mutants.
Metabolic flux analysis based on stoichiometric constraints constitutes a straightforward way to visualize the operativity of the entire metabolic network in anaerobic E. coli cells (4, 56, 67). Under these growth conditions, the carbon source is mostly converted into fermentation products and, to a lesser extent, into biomass (13, 38). We applied this methodology to study the distribution of metabolic fluxes in the arcB deletion mutants derived from wild-type K1060, using extracellular fluxes and specific rates of d-glucose consumption as input for a simplified stoichiometric model of central carbon catabolism (Fig. 2). The actual flux values were normalized to the specific rate of d-glucose consumption of each strain, allowing us to establish comparisons between different strains (Table 4). The values of the carbon balance for each set of fluxes was close to the unit, suggesting a balanced closure between the carbon source consumed by the cells and the formation of biomass, end fermentation products, and CO2.
Table 4.
Metabolic flux distribution in anoxic batch cultures of E. coli K1060 and its arcB mutant derivatives during balanced growth in M9 minimal medium with 3% (wt/vol) d-glucose as carbon source
| Flux | Flux to: | Relative fluxa for E. coli strain |
|||
|---|---|---|---|---|---|
| K1060 (wild-type strain) | GNB1061 (ArcB268–520) | GNB1062 (ArcB177–640) | GNB1063 (ΔarcB) | ||
| v0b | d-Glucose-6-P | 100 | 100 | 100 | 100 |
| v1 | Biomass | 21.1 ± 0.9 | 19.9 ± 0.2 | 16.7 ± 0.4 | 13.8 ± 0.6 |
| v2 | d-Glyceraldehyde-3-P | 78.9 ± 1.3 | 80.1 ± 1.4 | 83.3 ± 1.5 | 86.2 ± 1.9 |
| v3 | P-enol-pyruvate | 157.8 ± 2.5 | 160.3 ± 2.9 | 166.7 ± 1.8 | 172.4 ± 3.6 |
| v4 | Pyruvate | 152.9 ± 0.8 | 153.1 ± 0.9 | 156.5 ± 0.9 | 159.2 ± 0.4 |
| v5 | Succinate | 4.8 ± 0.5 | 7.2 ± 0.6 | 10.2 ± 0.7 | 13.2 ± 0.3 |
| v6 | Residual pyruvate | 1.7 ± 0.3 | 1.8 ± 0.1 | 0.0 ± 0.1 | 0.0 ± 0.2 |
| v7 | d-Lactate | 3.2 ± 0.4 | 4.6 ± 0.5 | 6.6 ± 0.4 | 8.5 ± 0.1 |
| v8 | Acetyl-CoA | 148.1 ± 0.7 | 148.4 ± 0.3 | 149.9 ± 0.9 | 150.7 ± 0.9 |
| v9 | Residual formate | 79.5 ± 0.9 | 86.7 ± 1.1 | 91.3 ± 0.7 | 91.5 ± 1.2 |
| v10 | H2 | 68.6 ± 1.2 | 61.8 ± 0.9 | 58.6 ± 1.4 | 59.2 ± 0.6 |
| v11 | Ethanol | 65.9 ± 0.8 | 68.7 ± 0.4 | 76.3 ± 0.5 | 81.6 ± 0.3 |
| v12 | Acetate | 82.1 ± 0.7 | 79.7 ± 0.7 | 73.6 ± 0.2 | 69.1 ± 0.2 |
| Carbon balancec | 0.93 ± 0.04 | 0.96 ± 0.02 | 0.91 ± 0.12 | 0.92 ± 0.09 | |
The relative flux values were normalized to the specific rate of d-glucose consumption in each strain (v0), and the reported results represent means ± 90% confidence intervals, calculated using triplicate measurements of extracellular fluxes in at least two independent cultures. Fluxes were codified according to the biochemical reactions shown in Fig. 2.
Absolute flux values for v0 are shown in Table 2.
Carbon balances were calculated from experimental fluxes to extracellular metabolites, the inferred rate of CO2 evolution, and biomass generation. The reported results represent means ± standard deviations calculated from the flux values within the metabolic network.
In agreement with the experimental YX/S values (Table 2), the flux toward biomass (from d-glucose-6-P) was consistently lower in all mutant strains than in E. coli K1060 (P < 0.05). Fluxes through the Embden-Meyerhof-Parnas pathway up to P-enol-pyruvate (v2 and v3) were higher in the arcB mutants (in particular for E. coli GNB1062 and GNB1063) than in E. coli K1060. Significant differences were also observed with the fluxes at the P-enol-pyruvate/pyruvate and acetyl-CoA metabolic nodes (see below). The NADH-dependent conversion of P-enol-pyruvate into succinate through the reductive branch of the TCA cycle (lumped in a single flux in the stoichiometric model, v5) was significantly higher in the arcB mutants than in the wild-type strain. The increment in this flux in the mutants with respect to the wild-type strain ranged between 1.5-fold in E. coli GNB1061 to 2.8-fold in E. coli GNB1063 (P < 0.01). Considering that several genes of the TCA cycle are regulated by the ArcBA system (6, 47, 60), and as citrate is the first intermediate of this metabolic pathway, we also quantified its concentration as a coarse estimation of the TCA cycle operativity toward the oxidative branch. As expected for anoxic cultures, the oxidative activity of the TCA cycle was almost null. Citrate concentrations were 0.18 ± 0.01 and 0.37 ± 0.02 mM for E. coli GNB1061 and GNB1062, respectively, compared to <0.05 mM for the parental strain. In contrast, the citrate concentration in culture supernatants of the ΔarcB strain attained 0.69 ± 0.08 mM.
Pyruvate can be either converted into acetyl-CoA and formate through the activity of pyruvate-formate lyase (PflB) or transformed into d-lactate by the fermentative, NADH-dependent d-lactate dehydrogenase (LdhA) (13). Surprisingly, we detected a small but clearly discernible rate of pyruvate secretion (v6) in the wild-type strain and E. coli GNB1061, which in both cases accounted for <2% of the specific rate of d-glucose consumption, probably indicating limited processing of this metabolic intermediate via PflB/LdhA under anoxic conditions. d-Lactate synthesis was higher in all arcB strains, in good agreement with their unregulated redox state, which favors NADH oxidation. In particular, the flux through LdhA (v7) was the highest for E. coli GNB1063, the ΔarcB strain, closely followed by that of E. coli GNB1062, and represented a 2.9- and 2.1-fold increase, respectively, compared to the same flux in the wild-type strain (P < 0.01). The rate of pyruvate conversion into acetyl-CoA was similar in all strains, although the corresponding PflB flux (v8) was slightly higher in the arcB mutants than in E. coli K1060, in particular for E. coli GNB1062 and GNB1063. Subsequent formate processing steps from this reaction were also markedly different among the experimental strains. The evolution of H2 in these cultures was measured as a direct estimation of the formate-hydrogen lyase activity, which converts formate into H2 and CO2 (13). Judging by the values of the v10 flux derived from these measurements, the formate-hydrogen lyase activity was the highest in the wild-type strain and decreased significantly in all the mutant strains. The lowest v10 value was observed in E. coli GNB1062 and was 1.2-fold lower than the flux in the wild-type strain (P < 0.05).
The distributions of fluxes between acetate and ethanol formation reflect the need to reoxidize reducing equivalents formed through the Embden-Meyerhof-Parnas pathway in order to achieve both redox and carbon balances. Ethanol synthesis was favored over acetate accumulation in all the mutants (P < 0.05), qualitatively corresponding to the high ethanol/acetate and NADH/NAD+ ratios measured in these strains (Table 3). The more evident differences were observed in E. coli GNB1062 and GNB1063. As a quantitative estimation of the molar fraction of carbon diverted from acetyl-CoA toward acetate and ethanol (f), the corresponding split ratios were calculated as fethanol = v11/(v11 + v12) and facetate = v12/(v11 + v12). In E. coli K1060, the values for fethanol and facetate were 44.5 and 55.5, whereas the split ratios were 50.9 and 49.1 for GNB1062 and 54.2 and 45.8 for GNB1063. In contrast, the acetyl-CoA split ratios for ethanol in E. coli GNB1061 were similar to those of the wild-type strain.
The availability of reducing power was also deduced at the fluxome level by considering the overall molar NADH availability per equivalent of d-glucose consumed, i.e., fNADH/G = (2v5 + v7 + 2v11)/v0. The experimental value obtained for this parameter in the wild-type strain was 1.45 ± 0.08, and the increment for fNADH/G in the mutants ranged from 1.1-fold for E. coli GNB1061 to 1.4-fold for E. coli GNB1063, thus confirming the in vitro measurements of nucleotide content.
Transcriptional analysis and measurement of key enzymatic activities supported the observed differences at the fluxome level.
In order to study the incremental effects of these deletions on cell physiology at different regulatory levels, we next determined the transcriptional activity of relevant genes by quantitative RT-PCR, as well as the activities of selected enzymes that showed significant differences by the metabolic flux analysis approach (Fig. 3) under the same growth conditions used for the other experiments. These two levels of regulation were investigated at key points in different metabolic blocks within the proposed anoxic biochemical network (i.e., the Embden-Meyerhof-Parnas pathway, pentose phosphate pathway, TCA cycle, and fermentation pathways) to provide a complete snapshot of the metabolic landscape for each strain.
Fig 3.
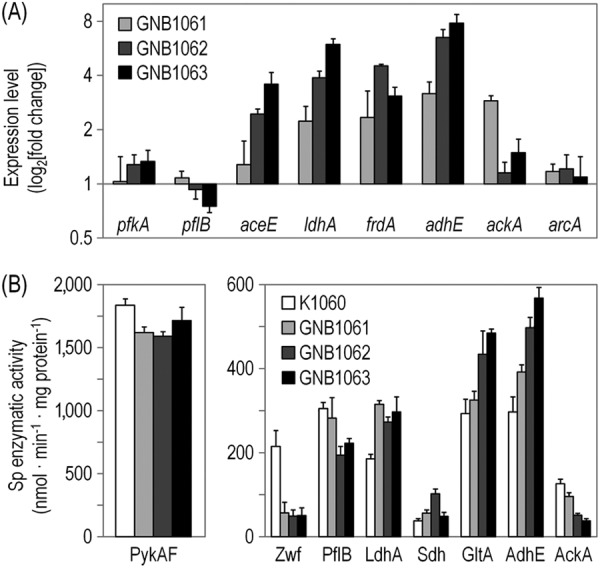
Transcriptional analysis of relevant genes and in vitro enzymatic activity measurements during exponential growth of E. coli K1060 (wild-type strain) and its arcB mutant derivatives [GNB1061 (ArcB268–520), GNB1062 (ArcB177–640), and GNB1063 (ΔarcB)] in anoxic batch cultures developed in M9 minimal medium with 3% (wt/vol) d-glucose as carbon source. (A) Results from quantitative RT-PCR analysis in the mutant strains, normalized to the corresponding transcript levels in E. coli K1060. Values represent means ± standard deviations of sextuplicate measurements from at least three independent cultures. (B) Results from determinations of specific enzymatic activities represent the means ± standard deviations of triplicate measurements from at least two independent cultures. Note that the activity of pyruvate kinase (PykAF) is separately represented, because the corresponding values were much higher than those obtained for the rest of the enzymes assayed. Sp, specific.
d-Glucose is split into glycolysis and the pentose phosphate pathway at the d-glucose-6-P branching point (Fig. 2). A slight but consistent increase in the expression of pfkA (encoding the glycolytic enzyme 6-phosphofructokinase I) was observed for E. coli GNB1062 and GNB1063 (P < 0.05) (Fig. 3A), suggesting a higher activity through the initial steps in d-glucose catabolism in the mutant strains than for E. coli K1060, and in good agreement with the experimental values of v3. The activity of pyruvate kinase (PykAF, which converts P-enol-pyruvate into pyruvate) was analyzed to estimate carbon routing through the lower Embden-Meyerhof-Parnas pathway (Fig. 3B). No significant differences were observed in the specific PykAF activity among the strains, which correlated well with the flux values through v4 (Table 4). In stark contrast, the activity of d-glucose-6-P 1-dehydrogenase (encoded by zwf; the key enzyme of the oxidative pentose phosphate pathway) was >74% lower in all the mutant strains than in E. coli K1060 (Fig. 3B), demonstrating that the flux toward pentose formation was very low in these strains. Moreover, the enzymatic activity observed in the wild-type strain was <50% than that observed in cultures of E. coli under aerobic conditions (data not shown).
The next metabolic node studied was the pyruvate branching point. In accordance with the expected transcriptional activation of focA-pflB by the ArcBA system during the transition from aerobic to microoxic conditions (18, 54, 57), the level of pflB mRNA in E. coli GNB1063 was 26% lower than that of E. coli K1060 (P < 0.05) (Fig. 3A). The difference in this parameter for the other mutants and the wild-type strain was not significant. In vitro enzymatic activity of PflB demonstrated that this activity was indeed affected by the different arcB mutations tested (Fig. 3B). In particular, the PflB activity was 36% and 27% lower in E. coli GNB1062 and GNB1063, respectively, than in E. coli K1060 (P < 0.05). The levels of activity detected in E. coli GNB1061 and E. coli K1060 were very similar. To also evaluate the contribution of the pyruvate dehydrogenase complex in the flux conducive to acetyl-CoA formation, we measured the transcriptional activity of aceE, which encodes the E1 component of this enzymatic complex (Fig. 3A). While no differences were observed for E. coli GNB1061 compared to the wild-type strain, the transcriptional level of aceE was incrased incrementally 2.4- and 3.6-fold in E. coli GNB1062 and GNB1063, respectively (P < 0.01). Even though it is known that pyruvate dehydrogenase can contribute to acetyl-CoA formation under microoxic conditions (32), no significant enzymatic activity was detected in cell extracts of any of the strains under study (data not shown).
Fermentation pathways that operate at the P-enol-pyruvate/pyruvate metabolic node also showed significant differences among the mutants. Both ldhA (encoding d-lactate dehydrogenase) and frdA (encoding one of the fumarate reductase subunits, the enzymatic complex that converts fumarate into succinate) were strongly upregulated in all arcB mutants (Fig. 3A), attaining mRNA levels >2-fold higher than those observed in E. coli K1060 (P < 0.01). In the ΔarcB mutant, ldhA expression peaked ca. 6-fold higher than in the wild-type strain. In contrast, frdA expression was the highest in E. coli GNB1062 (4.5-fold increase; P < 0.01). LdhA activity followed the same trend as that observed at the transcriptional level, being higher in all arcB mutants than in E. coli K1060 (P < 0.05) (Fig. 3B). However, at least at this level of regulation, no significant differences were observed among mutant strains. Total succinate dehydrogenase (Sdh) activity was also higher in the mutants than in E. coli K1060, and the highest activity was observed in E. coli GNB1062, in accordance with the transcriptional regulation results obtained by means of quantitative RT-PCR. The behavior in the strain expressing ArcB177–640, quantitatively different from that observed in the ΔarcB mutant, might suggest a particular regulation pattern on the reductive branch of the TCA cycle in that context.
The in vitro activity of citrate synthase was also evaluated under anoxic conditions to substantiate the results for citrate synthesis discussed above. GltA activity was higher in E. coli GNB1062 and GNB1063 than in the wild-type strain and in E. coli GNB1061, qualitatively reproducing the results obtained based on the extracellular citrate concentration. Although some residual activity of the oxidative branch of the TCA cycle is present in the arcB backgrounds analyzed in this study under anoxic conditions, our results clearly showed a much higher activity toward succinate formation (i.e., the reducing branch).
The regulation at the acetyl-CoA branching point was then assessed by measuring the expression of adhE and ackA, as well as the corresponding alcohol dehydrogenase and acetate kinase activities. A good correlation between transcriptional regulation and enzymatic activity was observed for adhE. Indeed, a significant increment in both parameters was observed in the mutant strains in comparison with wild-type K1060 (P < 0.05), which was even more evident for E. coli GNB1062 and GNB1063 compared to E. coli GNB1061. In particular, adhE transcription levels attained the maximum fold change among all the genes evaluated, ca. 8-fold higher in E. coli GNB1063 than in E. coli K1060. While in E. coli GNB1062 and GNB1063 the levels of ackA did not differ significantly from those in wild-type K1060, ackA expression had a ca. 2.9-fold increment in E. coli GNB1061 (Fig. 3A). These sharp differences at the transcriptional level did not translate into a similar pattern at the enzymatic activity level, probably because of the regulation exerted by the overall energy of the cell on the activity of AckA (16, 19). Moreover, the activity of AckA was lower in all the arcB mutants than in E. coli K1060, which fit well with the observed fluxes through this pathway (Fig. 3B). Both AdhE and AckA showed a regulatory pattern that qualitatively correlated with the changes observed at the flux level, thus reflecting the crucial competence between the corresponding pathways at the acetyl-CoA branching point in terms of both precursors and reducing power availability.
The transcriptional level of arcA was also evaluated, and no significant differences were observed in its transcription level among the experimental strains, suggesting that the pattern of transcriptional regulation of arcA is not significantly affected by the different deletions introduced in arcB.
DISCUSSION
Metabolic manipulations to enhance the synthesis of metabolic products include several approaches to increase the availability of substrates needed for their formation or to eliminate competing pathways, which sometimes lead to undesired phenotypes. An alternative strategy that has been scarcely exploited is the network-wide manipulation of metabolic fluxes by means of mutations in global regulators. In this sense, the modularity of the ArcB sensor of the ArcBA two-component system (6, 26), a prototypal member of the bacterial global regulatory network in the model facultative anaerobe E. coli, affords an ideal model to explore this approach. The present study analyzed some of the complex genotype-phenotype relationships in mutants of this regulatory system under anoxic growth conditions, which also permitted us to foresee their potential applicability for the synthesis of reduced biochemicals. The combined approach used in this work is relevant, since deletion of global regulatory genes has been observed to affect the entire cellular and metabolic landscape in a rather difficult-to-predict fashion (25, 70).
The dye phenotype served as an a priori indication of differences at the metabolic level among the mutants. Indeed, the overall colony morphology under these growth conditions was in good agreement with the altered metabolic patterns observed in each strain; while E. coli GNB1062 showed a dye phenotype compatible with that of the ΔarcB strain, E. coli GNB1061 presented an intermediate phenotype, somewhat closer to that of the wild-type strain. These morphological alterations likely arise from differences in the redox homeostasis and the distribution of central carbon fluxes (3, 30, 39, 53). As several levels of genetic and metabolic regulation are involved in the macroscopic differences observed, the dye phenotype provides valuable information on overall cell physiology. In line with this hypothesis, all the mutants had a high NADH/NAD+ ratio, with the most significant differences in the NADH content, as the NAD+ content did not show changes among the different strains. In close connection with this trait, the split of acetyl-CoA between ethanol and acetate was predictably affected by the redox state measured in each strain (see below). The consequences of such a redox regulation were also reflected in the pattern of central carbon fluxes. For instance, as the pentose phosphate pathway provides reducing power (i.e., NADPH) and its activity is downregulated when the intracellular redox state is highly reduced (38), the low Zwf activity observed in the mutants correlated well with their elevated NADH/NAD+ ratios. Similarly, the differences observed in the flux through formate-hydrogen lyase could arise from the overall metabolic state of the cells rather than by a direct effect of the ArcBA system on fdhF expression.
The regulatory pattern of some fluxes (also observed at both the transcriptional and enzymatic activity levels) significantly departs from that reported for arcA mutants under conditions with restricted O2 supply (42, 73), providing evidence that elimination of the entire arcB coding sequence (or sequences encoding different ArcB domains) has a different effect on cell physiology than does the absence of the cognate response regulator. Cases in point include the pattern of regulation at the pyruvate metabolic node and the split of acetyl-CoA between ethanol and acetate fluxes (see below). It is also worth noticing that an arcB deletion derivative of E. coli BW25113 was essentially silent in terms of overall cell physiology and metabolic flux distribution under fully aerobic conditions (50), supporting the notion that the main effects of deletions in arcB are relevant under conditions with restricted O2 supply.
The high glycolytic fluxes observed in the mutants (especially in E. coli GNB1062 and GNB1063) result in an elevated NADH generation rate, which cells need to recycle to efficiently continue d-glucose catabolism; therefore, anoxic fermentation pathways have to fulfill the requirement for NADH regeneration under these culture conditions (13). Although the increase in NADH in the mutants can be mostly attributed to the activity of the Embden-Meyerhof-Parnas pathway, it is worth considering that it can also arise from either a high activity of the TCA cycle enzymes and/or a low activity of the electron transfer chain. Our results from transcriptomic analysis as well as enzymatic activity measurements supported some residual contribution of the TCA cycle to the redox balance, and the repression of cyoABCDE (which encodes cytochrome o) by the ArcBA system is well known (66). However, the activity of the oxidative branch of the TCA cycle under the experimental conditions explored here is expected to be low, considering the inhibition exerted by the high NADH/NAD+ ratios themselves on both GltA and 2-ketoglutarate dehydrogenase activities (47, 71).
The pyruvate/acetyl-CoA branching points showed the most striking alterations among the mutant strains. PflB is known to convert pyruvate into acetyl-CoA under conditions with restricted O2 supply (1), but recent studies have suggested that some activity of the pyruvate dehydrogenase complex also contributes to anoxic acetyl-CoA formation (32). Under the working conditions tested in this study, pyruvate produced during glycolysis seemed to be mainly processed by pyruvate-formate lyase to generate acetyl-CoA. Since the activity of the pyruvate dehydrogenase complex (the other source of acetyl-CoA from pyruvate besides PflB) is inhibited by NADH (32) and higher ethanol/acetate and NADH/NAD+ redox ratios were detected in all arcB strains compared to the wild-type strain, the flux through pyruvate dehydrogenase would contribute to acetyl-CoA only marginally. Also, if the differences in this activity among the mutants are subtle, they might not be captured with the assay employed herein. The higher fluxes conducive to extracellular formate (Table 4) strongly support the notion that pyruvate is mostly processed by PflB under these conditions. In turn, the acetyl-CoA metabolic node, at which carbon atoms from d-glucose catabolism can be either converted into an oxidized or a reduced fermentation metabolite (i.e., acetate or ethanol, respectively), is of paramount interest for the synthesis of various heterologous metabolites with industrial applications. By evaluating the flux values conducive to ethanol and acetate formation, as well as the flux split ratios for these two metabolites, it can be seen that the synthesis of reduced biochemicals is favored in all the mutants.
At this point, it is relevant to consider that the actual phenotype of each strain (i.e., the macroscopic distribution of metabolic fluxes and other phenotypic traits) is the final consequence of multiple (and very complex) regulatory processes that act hierarchically at different levels (25, 48, 50). Several fine-tuning mechanisms for metabolic modulation, such as allosteric regulation of enzyme activity, might well operate differently in the strains analyzed. However, one can safely assume that the gross regulatory mechanisms, other than that exerted by the ArcBA system itself, are similar in the parental strain and its arcB derivatives. The mechanism underlying the phenotypic differences observed could lie beyond the known phosphorelay process described in vitro for the cellular signaling mediated by the ArcBA system (34, 37). As some of the relevant catalytic residues are still intact in the ArcB variants, some degree of phosphotransfer activity (i.e., ArcB-to-ArcA communication) is most probably present under the experimental conditions we tested. Moreover, as previously hinted by Yamamoto et al. (72) and Groban et al. (27), possible cross talk mechanisms between two-component systems could also contribute to the complex biochemical signalization in our system, in which ArcB is expected to be only partially active; and modulation of the Arc signalization by different levels of fermentation metabolites cannot be ruled out (51, 52). The possibility that similar (or radically different) effects on the central metabolism could be observed in partial deletion mutants of genes encoding components of other signal transduction systems in E. coli is an exciting scenario that remains to be explored.
Different types of mutations in components of global regulatory systems, such as arcA and creB (39–41, 43), have been shown to influence both carbon and redox balances in E. coli, mainly under microoxic growth conditions. The current study focused on the manipulation of global regulators as a relevant tool to modulate central metabolic fluxes under anoxic conditions and harnessing the reducing power availability for biotechnological purposes. The unregulated redox state of the mutant strains provides diverse metabolic backgrounds for the synthesis of reduced biochemicals both native to E. coli, such as ethanol, d-lactate, and succinate, and those resulting from heterologous pathways, such as poly(3-hydroxybutyrate). The partial mutants described could be also useful for anoxic biocatalysis processes that take advantage of metabolic activities in nongrowing cells. Finally, the use of targeted deletions in the ArcB tripartite sensor protein enabled us to obtain increasing phenotypic effects that could be exploited for the synthesis of reduced biochemicals, such as those mentioned above.
ACKNOWLEDGMENTS
We thank D. Georgellis and V. de Lorenzo for sharing research materials and for inspiring discussions. We are also indebted to M. Julia Pettinari for her critical advice while drafting the manuscript.
J.A.R., A.D.A, B.S.M., and P.I.N. are career investigators from Consejo Nacional de Investigaciones Científicas y Técnicas (CONICET, Argentina).
Footnotes
Published ahead of print 12 October 2012
REFERENCES
- 1. Alexeeva S, de Kort B, Sawers G, Hellingwerf KJ, Teixeira de Mattos MJ. 2000. Effects of limited aeration and of the ArcAB system on intermediary pyruvate catabolism in Escherichia coli. J. Bacteriol. 182:4934–4940 [DOI] [PMC free article] [PubMed] [Google Scholar]
- 2. Alvarez AF, Georgellis D. 2010. In vitro and in vivo analysis of the ArcB/A redox signaling pathway. Methods Enzymol. 471:205–228 [DOI] [PubMed] [Google Scholar]
- 3. Alvarez AF, Malpica R, Contreras M, Escamilla E, Georgellis D. 2010. Cytochrome d but not cytochrome o rescues the toluidine blue growth sensitivity of arc mutants of Escherichia coli. J. Bacteriol. 192:391–399 [DOI] [PMC free article] [PubMed] [Google Scholar]
- 4. Aristidou AA, San KY, Bennett GN. 1999. Metabolic flux analysis of Escherichia coli expressing the Bacillus subtilis acetolactate synthase in batch and continuous cultures. Biotechnol. Bioeng. 63:737–749 [DOI] [PubMed] [Google Scholar]
- 5. Bekker M, et al. 2010. The ArcBA two-component system of Escherichia coli is regulated by the redox state of both the ubiquinone and the menaquinone pool. J. Bacteriol. 192:746–754 [DOI] [PMC free article] [PubMed] [Google Scholar]
- 6. Bekker M, Teixeira de Mattos MJ, Hellingwerf KJ. 2006. The role of two-component regulation systems in the physiology of the bacterial cell. Sci. Prog. 89:213–242 [DOI] [PMC free article] [PubMed] [Google Scholar]
- 7. Bernofsky C, Swan M. 1973. An improved cycling assay for nicotinamide adenine dinucleotide. Anal. Biochem. 53:452–458 [DOI] [PubMed] [Google Scholar]
- 8. Bradford MM. 1976. A rapid and sensitive method for the quantitation of microgram quantities of protein utilizing the principle of protein-dye binding. Anal. Biochem. 72:248–254 [DOI] [PubMed] [Google Scholar]
- 9. Bueno E, Mesa S, Bedmar EJ, Richardson DJ, Delgado MJ. 2012. Bacterial adaptation of respiration from oxic to microoxic and anoxic conditions: redox control. Antioxid. Redox Signal. 16:819–852 [DOI] [PMC free article] [PubMed] [Google Scholar]
- 10. Bunch PK, Mat-Jan F, Lee N, Clark DP. 1997. The ldhA gene encoding the fermentative lactate dehydrogenase of Escherichia coli. Microbiology 143:187–195 [DOI] [PubMed] [Google Scholar]
- 11. Buxton RS, Drury LS. 1983. Cloning and insertional inactivation of the dye (sfrA) gene, mutation of which affects sex factor F expression and dye sensitivity of Escherichia coli K-12. J. Bacteriol. 154:1309–1314 [DOI] [PMC free article] [PubMed] [Google Scholar]
- 12. Cherepanov PP, Wackernagel W. 1995. Gene disruption in Escherichia coli: Tcr and Kmr cassettes with the option of Flp-catalyzed excision of the antibiotic-resistance determinant. Gene 158:9–14 [DOI] [PubMed] [Google Scholar]
- 13. Clark DP. 1989. The fermentation pathways of Escherichia coli. FEMS Microbiol. Rev. 5:223–234 [DOI] [PubMed] [Google Scholar]
- 14. Datsenko K, Wanner BL. 2000. One-step inactivation of chromosomal genes in Escherichia coli K-12 using PCR products. Proc. Natl. Acad. Sci. U. S. A. 97:6640–6645 [DOI] [PMC free article] [PubMed] [Google Scholar]
- 15. de Almeida A, Giordano AM, Nikel PI, Pettinari MJ. 2010. Effects of aeration on the synthesis of poly(3-hydroxybutyrate) from glycerol and glucose in recombinant Escherichia coli. Appl. Environ. Microbiol. 76:2036–2040 [DOI] [PMC free article] [PubMed] [Google Scholar]
- 16. Dittrich CR, Bennett GN, San KY. 2005. Characterization of the acetate-producing pathways in Escherichia coli. Biotechnol. Prog. 21:1062–1067 [DOI] [PubMed] [Google Scholar]
- 17. Dixon GH, Kornberg HL. 1959. Assay methods for key enzymes of the glyoxylate cycle. Biochem. J. 73:3–10 [Google Scholar]
- 18. Drapal N, Sawers G. 1995. Promoter 7 of the Escherichia coli pfl operon is a major determinant in the anaerobic regulation of expression by ArcA. J. Bacteriol. 177:5338–5341 [DOI] [PMC free article] [PubMed] [Google Scholar]
- 19. Ferry JG. 2011. Acetate kinase and phosphotransacetylase. Methods Enzymol. 494:219–231 [DOI] [PubMed] [Google Scholar]
- 20. Fraenkel DG, Horecker BL. 1964. Pathways of D-glucose metabolism in Salmonella typhimurium. A study of a mutant lacking phosphoglucose isomerase. J. Biol. Chem. 239:2765–2771 [PubMed] [Google Scholar]
- 21. Georgellis D, Kwon O, De Wulf P, Lin ECC. 1998. Signal decay through a reverse phosphorelay in the Arc two-component signal transduction system. J. Biol. Chem. 273:32864–32869 [DOI] [PubMed] [Google Scholar]
- 22. Georgellis D, Kwon O, Lin ECC. 2001. Quinones as the redox signal for the arc two-component system of bacteria. Science 292:2314–2316 [DOI] [PubMed] [Google Scholar]
- 23. Georgellis D, Lynch AS, Lin ECC. 1997. In vitro phosphorylation study of the arc two-component signal transduction system of Escherichia coli. J. Bacteriol. 179:5429–5435 [DOI] [PMC free article] [PubMed] [Google Scholar]
- 24. Gomez JGC, et al. 2012. Making green polymers even greener: towards sustainable production of polyhydroxyalkanoates from agroindustrial by-products, p 41–62 In Petre M. (ed), Advances in applied biotechnology. InTech, Rijeka, Croatia [Google Scholar]
- 25. Gottesman S. 1984. Bacterial regulation: global regulatory networks. Annu. Rev. Genet. 18:415–441 [DOI] [PubMed] [Google Scholar]
- 26. Green J, Paget MS. 2004. Bacterial redox sensors. Nat. Rev. Microbiol. 2:954–966 [DOI] [PubMed] [Google Scholar]
- 27. Groban ES, Clarke EJ, Salis HM, Miller SM, Voigt CA. 2009. Kinetic buffering of cross talk between bacterial two-component sensors. J. Mol. Biol. 390:380–393 [DOI] [PMC free article] [PubMed] [Google Scholar]
- 28. Iuchi S, Lin ECC. 1992. Mutational analysis of signal transduction by ArcB, a membrane sensor protein responsible for anaerobic repression of operons involved in the central aerobic pathways in Escherichia coli. J. Bacteriol. 174:3972–3980 [DOI] [PMC free article] [PubMed] [Google Scholar]
- 29. Iuchi S, Lin ECC. 1992. Purification and phosphorylation of the Arc regulatory components of Escherichia coli. J. Bacteriol. 174:5617–5623 [DOI] [PMC free article] [PubMed] [Google Scholar]
- 30. Iuchi S, Matsuda Z, Fujiwara T, Lin ECC. 1990. The arcB gene of Escherichia coli encodes a sensor-regulator protein for anaerobic repression of the arc modulon. Mol. Microbiol. 4:715–727 [DOI] [PubMed] [Google Scholar]
- 31. Jarboe LR, et al. 2010. Metabolic engineering for production of biorenewable fuels and chemicals: contributions of synthetic biology. J. Biomed. Biotechnol. 2010:761042 doi:10.1155/2010/761042 [DOI] [PMC free article] [PubMed] [Google Scholar]
- 32. Kim Y, Ingram LO, Shanmugam KT. 2008. Dihydrolipoamide dehydrogenase mutation alters the NADH sensitivity of pyruvate dehydrogenase complex of Escherichia coli K-12. J. Bacteriol. 190:3851–3858 [DOI] [PMC free article] [PubMed] [Google Scholar]
- 33. Knappe J, Blaschkowski HP, Gröbner P, Schmitt T. 1974. Pyruvate formate-lyase of Escherichia coli: the acetyl-enzyme intermediate. Eur. J. Biochem. 50:253–263 [DOI] [PubMed] [Google Scholar]
- 34. Kwon O, Georgellis D, Lin ECC. 2000. Phosphorelay as the sole physiological route of signal transmission by the arc two-component system of Escherichia coli. J. Bacteriol. 182:3858–3862 [DOI] [PMC free article] [PubMed] [Google Scholar]
- 35. Leonardo MR, Dailly Y, Clark DP. 1996. Role of NAD in regulating the adhE gene of Escherichia coli. J. Bacteriol. 178:6013–6018 [DOI] [PMC free article] [PubMed] [Google Scholar]
- 36. Lynch AS, Lin ECC. 1996. Responses to molecular oxygen, p 1526–1538 In Neidhardt FC, et al. (ed), Escherichia coli and Salmonella: cellular and molecular biology, 2nd ed, vol 1 ASM Press, Washington DC [Google Scholar]
- 37. Malpica R, Sandoval GR, Rodríguez C, Franco B, Georgellis D. 2006. Signaling by the arc two-component system provides a link between the redox state of the quinone pool and gene expression. Antioxid. Redox Signal. 8:781–795 [DOI] [PubMed] [Google Scholar]
- 38. Neidhardt FC, Ingraham JL, Schaechter M. 1990. Physiology of the bacterial cell: a molecular approach. Sinauer Associates, Sunderland, MA [Google Scholar]
- 39. Nikel PI, de Almeida A, Pettinari MJ, Méndez BS. 2008. The legacy of HfrH: mutations in the two-component system CreBC are responsible for the unusual phenotype of an Escherichia coli arcA mutant. J. Bacteriol. 190:3404–3407 [DOI] [PMC free article] [PubMed] [Google Scholar]
- 40. Nikel PI, Pettinari MJ, Galvagno MA, Méndez BS. 2008. Poly(3-hydroxybutyrate) synthesis from glycerol by a recombinant Escherichia coli arcA mutant in fed-batch microaerobic cultures. Appl. Microbiol. Biotechnol. 77:1337–1343 [DOI] [PubMed] [Google Scholar]
- 41. Nikel PI, Pettinari MJ, Ramirez MC, Galvagno MA, Méndez BS. 2008. Escherichia coli arcA mutants: metabolic profile characterization of microaerobic cultures using glycerol as a carbon source. J. Mol. Microbiol. Biotechnol. 15:48–54 [DOI] [PubMed] [Google Scholar]
- 42. Nikel PI, Zhu J, San KY, Méndez BS, Bennett GN. 2009. Metabolic flux analysis of Escherichia coli creB and arcA mutants reveals shared control of carbon catabolism under microaerobic growth conditions. J. Bacteriol. 191:5538–5548 [DOI] [PMC free article] [PubMed] [Google Scholar]
- 43. Nizam SA, Shimizu K. 2008. Effects of arcA and arcB genes knockout on the metabolism in Escherichia coli under anaerobic and microaerobic conditions. Biochem. Eng. J. 42:229–236 [Google Scholar]
- 44. Nizam SA, Zhu J, Ho PY, Shimizu K. 2009. Effects of arcA and arcB genes knockout on the metabolism in Escherichia coli under aerobic condition. Biochem. Eng. J. 44:240–250 [Google Scholar]
- 45. Okano K, Tanaka T, Ogino C, Fukuda H, Kondo A. 2010. Biotechnological production of enantiomeric pure lactic acid from renewable resources: recent achievements, perspectives, and limits. Appl. Microbiol. Biotechnol. 85:413–423 [DOI] [PubMed] [Google Scholar]
- 46. Overath P, Schairer HU, Stoffel W. 1970. Correlation of in vivo and in vitro phase transitions of membrane lipids in Escherichia coli. Proc. Natl. Acad. Sci. U. S. A. 67:606–612 [DOI] [PMC free article] [PubMed] [Google Scholar]
- 47. Park SJ, McCabe J, Turna J, Gunsalus RP. 1994. Regulation of the citrate synthase (gltA) gene of Escherichia coli in response to anaerobiosis and carbon supply: role of the arcA gene product. J. Bacteriol. 176:5086–5092 [DOI] [PMC free article] [PubMed] [Google Scholar]
- 48. Patil KR, Bapat PM, Nielsen J. 2010. Structure and flux analysis of metabolic networks, p 17.11–17.18 In Smolke CD. (ed), The metabolic pathway engineering book: fundamentals, vol 1 CRC Press, Boca Raton, FL [Google Scholar]
- 49. Peña-Sandoval GR, Georgellis D. 2010. The ArcB sensor kinase of Escherichia coli autophosphorylates by an intramolecular reaction. J. Bacteriol. 192:1735–1739 [DOI] [PMC free article] [PubMed] [Google Scholar]
- 50. Perrenoud A, Sauer U. 2005. Impact of global transcriptional regulation by ArcA, ArcB, Cra, Crp, Cya, Fnr, and Mlc on glucose catabolism in Escherichia coli. J. Bacteriol. 187:3171–3179 [DOI] [PMC free article] [PubMed] [Google Scholar]
- 51. Rodriguez C, Kwon O, Georgellis D. 2004. Effect of D-lactate on the physiological activity of the ArcB sensor kinase in Escherichia coli. J. Bacteriol. 186:2085–2090 [DOI] [PMC free article] [PubMed] [Google Scholar]
- 52. Rolfe MD, et al. 2011. Transcript profiling and inference of Escherichia coli K-12 ArcA activity across the range of physiologically relevant oxygen concentrations. J. Biol. Chem. 286:10147–10154 [DOI] [PMC free article] [PubMed] [Google Scholar]
- 53. Ruiz JA, Fernández RO, Nikel PI, Méndez BS, Pettinari MJ. 2006. dye (arc) mutants: insights into an unexplained phenotype and its suppression by the synthesis of poly(3-hydroxybutyrate) in Escherichia coli recombinants. FEMS Microbiol. Lett. 258:55–60 [DOI] [PubMed] [Google Scholar]
- 54. Salmon KA, et al. 2005. Global gene expression profiling in Escherichia coli K-12: effects of oxygen availability and ArcA. J. Biol. Chem. 280:15084–15096 [DOI] [PubMed] [Google Scholar]
- 55. Sambrook J, Russell DW. 2001. Molecular cloning: a laboratory manual, 3rd ed Cold Spring Harbor Laboratory, Cold Spring Harbor, NY [Google Scholar]
- 56. Sánchez AM, Bennett GN, San KY. 2006. Batch culture characterization and metabolic flux analysis of succinate-producing Escherichia coli strains. Metab. Eng. 8:209–226 [DOI] [PubMed] [Google Scholar]
- 57. Sawers G. 1993. Specific transcriptional requirements for positive regulation of the anaerobically inducible pfl operon by ArcA and FNR. Mol. Microbiol. 10:737–747 [DOI] [PubMed] [Google Scholar]
- 58. Schwalbach MS, et al. 2012. Complex physiology and compound stress responses during fermentation of alkali-pretreated corn stover hydrolysate by an Escherichia coli ethanologen. Appl. Environ. Microbiol. 78:3442–3457 [DOI] [PMC free article] [PubMed] [Google Scholar]
- 59. Shalel-Levanon S, San KY, Bennett GN. 2005. Effect of oxygen on the Escherichia coli ArcA and FNR regulation systems and metabolic responses. Biotechnol. Bioeng. 89:556–564 [DOI] [PubMed] [Google Scholar]
- 60. Shalel-Levanon S, San KY, Bennett GN. 2005. Effect of oxygen, and ArcA and FNR regulators on the expression of genes related to the electron transfer chain and the TCA cycle in Escherichia coli. Metab. Eng. 7:364–374 [DOI] [PubMed] [Google Scholar]
- 61. Steiner P, Fussenegger M, Bailey JE, Sauer U. 1998. Cloning and expression of the Zymomonas mobilis pyruvate kinase gene in Escherichia coli. Gene 220:31–38 [DOI] [PubMed] [Google Scholar]
- 62. Stephanopoulos G. 1999. Metabolic fluxes and metabolic engineering. Metab. Eng. 1:1–11 [DOI] [PubMed] [Google Scholar]
- 63. Taylor BL, Zhulin IB. 1999. PAS domains: internal sensors of oxygen, redox potential, and light. Microbiol. Mol. Biol. Rev. 63:479–506 [DOI] [PMC free article] [PubMed] [Google Scholar]
- 64. Thakker C, Martínez I, San KY, Bennett GN. 2012. Succinate production in Escherichia coli. Biotechnol. J. 7:213–224 [DOI] [PMC free article] [PubMed] [Google Scholar]
- 65. Tsai SP, Lee YH. 1988. Application of metabolic pathway stoichiometry to statistical analysis of bioreactor measurement data. Biotechnol. Bioeng. 32:713–715 [DOI] [PubMed] [Google Scholar]
- 66. Tseng CP, Albrecht J, Gunsalus RP. 1996. Effect of microaerophilic cell growth conditions on expression of the aerobic (cyoABCDE and cydAB) and anaerobic (narGHJI, frdABCD, and dmsABC) respiratory pathway genes in Escherichia coli. J. Bacteriol. 178:1094–1098 [DOI] [PMC free article] [PubMed] [Google Scholar]
- 67. Varma A, Palsson BØ. 1994. Stoichiometric flux balance models quantitatively predict growth and metabolic by-product secretion in wild-type Escherichia coli W3110. Appl. Environ. Microbiol. 60:3724–3731 [DOI] [PMC free article] [PubMed] [Google Scholar]
- 68. Veeger C, DerVartanian DV, Zeylemaker WP. 1969. Succinate dehydrogenase. Methods Enzymol. 13:81–90 [Google Scholar]
- 69. Vickers CE, Klein-Marcuschamer D, Krömer JO. 2012. Examining the feasibility of bulk commodity production in Escherichia coli. Biotechnol. Lett. 34:585–596 [DOI] [PubMed] [Google Scholar]
- 70. Wang L, et al. 2010. Divergence involving global regulatory gene mutations in an Escherichia coli population evolving under phosphate limitation. Genome Biol. Evol. 2:478–487 [DOI] [PMC free article] [PubMed] [Google Scholar]
- 71. Weitzman PDJ. 1969. Citrate synthase from Escherichia coli. Methods Enzymol. 13:22–26 [Google Scholar]
- 72. Yamamoto K, et al. 2005. Functional characterization in vitro of all two-component signal transduction systems from Escherichia coli. J. Biol. Chem. 280:1448–1456 [DOI] [PubMed] [Google Scholar]
- 73. Zhu J, Shalel-Levanon S, Bennett GN, San KY. 2006. Effect of the global redox sensing/regulation networks on Escherichia coli and metabolic flux distribution based on C-13 labeling experiments. Metab. Eng. 8:619–627 [DOI] [PubMed] [Google Scholar]