

Abstract
In this study, we examined the capacities of non-antigen-presenting cell types to propagate antiviral signals following infection with recombinant adenovirus or by direct nucleic acid transfection. Three murine cell lines (RAW264.7 macrophages as a positive control, FL83B hepatocytes, and MS1 endothelial cells) were assessed following exposure to adenovirus, DNA, or RNA ligands. Based on primary (interferon response factor 3 [IRF3] phosphorylation) and secondary (STAT1/2 phosphorylation) response markers, we found each cell line presented a unique response profile: RAW cells were highly responsive, MS1 cells were modified in their response, and FL83B cells were essentially nonresponsive. Comparative reverse transcription-quantitative PCR (RT-qPCR) of nucleic acid sensing components revealed major differences between the three cell types. A prominent difference was at the level of adaptor molecules; TRIF, MyD88, MAVS, and STING. TRIF was absent in MS1 and FL83B cells, whereas MyD88 levels were diminished in FL83B hepatocytes. These differences resulted in compromised TLR-mediated activation. While the cytosolic adaptor MAVS was well represented in all cell lines, the DNA adaptor STING was deficient in FL83B hepatocytes (down by nearly 3 log units). The absence of STING provides an explanation for the lack of DNA responsiveness in these cells. This hypothesis was confirmed by acquisition of IRF3 activation in Flag-STING FL83B cells following DNA transfection. To consolidate the central role of adaptors in MS1 endothelial cells, short hairpin RNA (shRNA) knockdown of STING and MAVS resulted in a ligand-specific loss of IRF3 responsiveness. In contrast to the requirement for specific adaptor proteins, a requirement for a specific DNA sensor (AIM2, DDx41, or p204) in the IRF3 activation response was not detected by shRNA knockdown in MS1 cells. The data reveal that cell-specific regulation of nucleic acid sensing cascade components influences antiviral recognition responses, that controlling levels of adaptor molecules is a recurring strategy in regulating antiviral recognition response functions, and that comparative RT-qPCR has predictive value for antiviral/innate response functions in these cells.
INTRODUCTION
Infection with recombinant replication-defective adenoviral vectors provides an excellent model for characterizing early antiviral response pathways to DNA viruses. Murine antigen-presenting cells (APCs) (conventional macrophages or dendritic cells) are not highly permissive to virus infection (17) but undergo an antiviral activation/maturation characterized by a dominant type I interferon expression profile (6, 14, 15, 22). Activation of interferon response factor 3 (IRF3) provides a valuable marker for early antiviral recognition by APCs. IRF3 undergoes C-terminal phosphorylation as a primary response to adenovirus (Ad) uptake. Activation occurs in a MyD88/TRIF-independent manner; it requires integrin-dependent endosomal entry and escape and presentation of viral DNA (vDNA) to the cytosolic compartment (15). Viral nucleic acids are a dominant pathogen-associated molecular pattern (PAMP), and a variety of pattern recognition receptors (PRRs) that contribute to early antiviral recognition have been identified (reviewed in reference 20).
Nucleic acid recognition receptors (sensors) are divided into RNA (RIG-I, MDA5, and TLR3, -7, and -8) and DNA [TLR9, DAI, AIM2, DDx41, and p204(IFI-16)] sensors, which are further classified as membrane/endosome associated (TLRs) or cytosolic. Typically, the antiviral recognition response involves sensor binding to a target ligand or sensor signaling through an adaptor molecule (MAVS, STING, MyD88, or TRIF), which triggers stimulation cascades that activate transcription factors, such as NF-κB, AP1, IRF3, or IRF7. In the RAW264.7 macrophage-like cell line, we have shown that phosphorylation of the IRF3 transcription factor (pser388IRF3) occurs through a TBK1/STING cascade, where two DNA sensors, AIM2 and DDX41, were found to influence IRF3 activation (18). The events stimulated by virus entry and DNA presentation represent the primary antiviral response to infection. Subsequent expression of chemokines and cytokines, including type I interferons, tumor necrosis factor (TNF), and interleukin 1 (IL-1), results in autocrine/paracrine secondary signaling, essential to the establishment of a mature antiviral host cell response.
Although APCs are critically important to the antiviral innate and adaptive immune responses, they are not the only cell type exposed to viruses. The host response to recombinant adenovirus vector (rAdV) infection reflects the amalgamated response of virus interaction with a variety of cell types. Recent studies have shown that following systemic virus administration, virus predominantly localizes to hepatic endothelial cells and hepatic macrophages and minimally to hepatocytes (7).
In contrast to APCs, the role of DNA sensing in non-APCs is not well established. In the current study, we have compared the antiviral responses of murine MS1 endothelial cells and FL83B hepatocytes to that of RAW264.7 macrophage-like cells. Infection with rAd vectors or exposure to nucleic acids revealed a unique response pattern in each cell line. Using comparative reverse transcription-quantitative PCR (RT-qPCR) analysis of nucleic acid sensing cascades, we demonstrate how regulation of both nucleic acid sensors and molecular adaptors participates in establishing a cell-type-specific antiviral recognition response.
MATERIALS AND METHODS
Viruses and AdV DNA.
Ad5CiG, an E1/E3-deficient replication-defective vector containing a cytomegalovirus (CMV)-chloramphenical acetyltransferase (CAT) internal ribosome entry site (IRES) green fluorescent protein (GFP) reporter transcript inserted in the E1 domain (17), was previously described. Virus was grown on a large scale in 293 cells, followed by 2 rounds of CsCl banding, dialysis against 4% sucrose, 50 mM Tris, pH 8.0, 2 mM MgCl2, and stored at −80°C. Viral-particle numbers were determined by spectrophotometric detection of intact virions at an optical density at 260 nm (OD260) (1012 particles [p]/OD260 unit). AdV DNA was purified by standard procedures (17).
Cells.
RAW264.7 macrophage-like cells were maintained in Dulbecco's modified Eagle's medium (DMEM) (Cellgro) with 5% fetal bovine serum (FBS) (characterized; HyClone), and MS1 endothelial cells were maintained in DMEM containing 10% FBS. FL83B cells were maintained in F12K (Cellgro) with 5 to 10% FBS. All media were supplemented with 1% penicillin/streptomycin (Gibco).
Overexpressing cell lines.
STING was cloned by reverse transcription of total RNA isolated from primary murine bone marrow-derived macrophages (a kind gift from Marcelo Nociari) using the AccuScript High Fidelity RT-PCR system (Stratagene 600180). All clones were confirmed by DNA sequencing. FL83B cells were transfected with the expression plasmids using Lipofectamine 2000 (Invitrogen catalog no. 11668), and plasmid-expressing cells were selected with 400 μg/ml G418 (Gemini Bioproducts; 400-111P, 100 mg active drug/ml sterile distilled water [dH2O]). STING-FLAG single-cell clones were isolated, tested for expression, kept under drug selection, and used in experiments as indicated.
Cell treatment.
Cells (5 × 10⁵ per well) were plated in 2 ml medium in 6-well plates 48 h before treatment. At time 0, cells were either infected with virus in the indicated amounts or transfected with AdV DNA, poly(dA-dT), or poly(I·C) (Invivogen; LMW, tlrc-picw) using Lipofectamine (LF) 2000 (Invitrogen) at a ratio of 1 μg nucleic acid/2.5 μl LF2000/125 μl Opti-MEM (Invitrogen). Lipopolysaccharide (LPS) (LPS-EB Ultrapure; Invivogen) was added to a final concentration of 100 ng/ml from a stock solution of 100 μg/ml. Equal volumes of Opti-MEM were also used for mock treatment and as a dilution medium for the virus.
Western blots.
Whole-cell extracts were prepared by washing cells twice with ice-cold phosphate-buffered saline (PBS) and incubating them in lysis buffer (50 mM Tris, pH 7.5, 150 mM NaCl, 1 mM EDTA, 1% NP-40) with addition of phosphatase inhibitor cocktails 1 and 2 (Sigma; P2850 and P5726) and protease inhibitors (30 mM sodium fluoride, 1 mM phenylmethylsulfonyl fluoride, 10 μg/ml aprotinin, 10 μg/ml leupeptin, 1 μg/ml pepstatin, 1 mM benzamidine) for 30 min at 4°C on a rocking platform before being scraped and transferred to tubes. The lysates were cleared by centrifugation at 13,000 × g for 20 min at 4°C, and protein quantification was performed with a DC protein assay kit (Bio-Rad Laboratories).
For Western blot analysis, 20 μg total protein was separated using standard 10% SDS-polyacrylamide gels and transferred to polyvinylidene difluoride (PVDF) membranes (Immobilon P; Millipore). All blots were blocked in 5% skim milk in Tris-buffered saline (TBS)-Tween (0.1%) at room temperature for 1 h. Phospho-IRF3 (Ser396; no. 4961), phospho-STAT1 (no. 58D6) (Homo sapiens Tyr701; no. 9167), beta-actin (no. 4967), and horseradish peroxidase (HRP)-linked anti-rabbit IgG (no. 7074) antibodies were from Cell Signaling. Total IRF3 antibody was from Santa Cruz Laboratories (no. SC-9082). pSTAT2 (Mus musculus Tyr689; no. 07-224) antibody was from Millipore. HRP-linked donkey anti-goat IgG (no. A50-201P) was from Bethyl Laboratories. HRP-linked anti-mouse IgG (no. NA931V) was from Amersham. All primary antibodies were used at a dilution of 1:1,000 in 5% bovine serum albumin (BSA) in TBS, except beta-actin, hemagglutinin (HA) tag, and pSTAT2 antibodies, which were used at a dilution of 1:2,000. Signals were visualized with an ECLplus kit (Amersham Biosciences).
sh knockdown.
Short-hairpin (sh)S constructs for SCR, AIM2, p204, DAI, STING, and DDX41were previously described (18). Briefly, DAI Sh constructs targeting DDX41 were purchased from OpenBiosystems through Thermo Scientific (TRCN0000104010 to TRCN0000104014). Sh constructs for knockdown of DAI and TBK1 were generated by cloning published target sequences (19) into pLKO.1 (13) (Addgene plasmid 10878) using primer extension with phi29 to generate the double-stranded hairpin insert (11). Target sequences for MAVS were identified with the small interfering RNA (siRNA) at the Whitehead Institute siRNA selection server website (21) and cloned as described previously. The constructs were used to generate lentiviral particles in 293T cells following cotransfection with vesicular stomatitis virus G protein (VSVG) and Δ8.9 packaging plasmids according to standard protocols. Cells targeted for knockdown were infected with sh-lentivirus and, at 48 h postinfection (p.i.), selected with puromycin for approximately 7 days, at which point there was no survival of control cells lacking the puromycin cassette. The puromycin-selected sh cells were used in experiments as described above.
SYBR green I qPCR/RT-qPCR.
Total cell DNA was purified using a Qiagen DNeasy Tissue purification kit following the manufacturer's instructions. DNA concentrations (OD260/280) were determined using a Nanodrop system. For each assay, 30 ng of cellular DNA was used in amplifications carried out in a total volume of 20 μl by using Maxima SYBR green/Rox qPCR Master Mix (Fermentas) in an Applied Biosystems Prism 7900H Sequence Detection System with SDS 2.1 software. For RT-qPCR, total cellular RNA was isolated using Tri-Reagent, Tri-Reagent RT, or RNAzol RT (Molecular Research Center) as instructed by the manufacturer. Purified RNA was treated with the Ambion Turbo DNA-Free Kit (Applied Biosystems) to remove residual genomic DNA. For RT-qPCR, a two-step protocol was employed. First, cDNA was synthesized from 1 μg total RNA in a volume of 20 μl using the Maxima First Strand cDNA Synthesis Kit (Fermentas). Second, amplifications were carried out in a total volume of 15 μl by using the Maxima SYBR green/Rox qPCR Master Mix (Fermentas) in an Applied Biosystems Prism 7900H Sequence Detection System with SDS 2.1 software. The cycles consisted of initial incubation at 95°C for 10 min; 40 cycles at 95°C for 15 s, 60°C for 30 s, and 72°C for 30 s; and a melting-curve analysis cycle. Data acquisition was performed during the extension step. All determinations were performed in technical triplicate. Nontemplate and non-RT controls were run with every assay and had cycle thresholds (CT) that were significantly higher than those of experimental samples or undetermined. The relative abundance of each mRNA was calculated by the ΔΔCT method (10, 16) normalizing to hypoxanthine phosphoribosyltransferase (HPRT) expression and comparing to one reference sample, as indicated on the graph. The sequences of primers are available on request.
Statistical analysis.
Data were expressed as means ± the standard error of the mean. Statistical analysis was performed with Student's t test. A P value of less than 0.05 was considered significant.
RESULTS
Cell-specific antiviral response to rAdV infection.
Three cell lines, murine hepatocyte FL83B cells, endothelial MS1 cells, and macrophage-like RAW264.7 cells, were exposed to 20,000 p/cell of the replication-defective Ad5CiG (CATiresGFP reporter gene driven by a CMV promoter) vector and characterized for transduction efficiency 24 h postinfection. At the level of delivery of the vector genome (Fig. 1A), GFP reporter gene expression (Fig. 1B), and virus-derived mRNA expression (Fig. 1C), these cells reveal distinct transduction phenotypes: while FL83B cells are highly permissive, MS1 cells are approximately a log unit less permissive, and RAW264.7 cells are the least permissive. Using phosphorylation of IRF3 as a marker, we next asked if the antiviral innate response established in APCs is also induced in these diverse cell types (Fig. 2A). We examined an early time point (6 h posttreatment) as an indicator of primary antiviral response patterns and a late-stage time point (24 h posttreatment) to assess the mature antiviral response resulting from primary and secondary antiviral transactions. A strong early activation of IRF3 occurs in RAW264.7 cells, a variable and weaker response was detected in MS1 cells, and there was no evidence for IRF3 activation by Ad5CiG in FL83B cells. At the 24-hour time point, both RAW264.7 cells and MS1 cells maintained IRF3 activation, which was still lacking in FL83B cells. IRF3 activation leads to transcriptional activation of several genes, including beta interferon (IFN-β). Secretion of IFN-β results in autocrine/paracrine secondary signaling through IFNRI/2 and Jak/Tyk2 and is revealed by phosphorylation of STAT1 and STAT2 (Stat1 pTyr701 and Stat 2-pTyr689). Consistent with IRF3 activation, phospho-STAT1/2 was prominent in RAW264.7 cells; however, induction was less pronounced in MS1 cells and absent in FL83B cells. Therefore, each cell type presents distinct primary and secondary antiviral responses.
Fig 1.

rAdV transduction efficiency and DNA uptake in diverse cell lines. (A) qPCR of total DNA from mock- or rAd5CiG-infected (2 × 10⁴ p/cell) Raw264.7, FL83B, and MS1 cells (harvested 24 h p.i.) using primer pairs for cellular control ISG56. Virus-associated CAT and VAI genes were normalized to an HPRT control as described in Materials and Methods. RAW264.7 sample 1 was assigned an arbitrary value of 100 for comparative analysis. nd, not detectable. The error bars indicate the standard errors of the mean. (B) Infections carried out as described above were harvested at 24 h p.i., analyzed by flow cytometry for GFP expression (the percentage GFP positive and the average mean fluorescence intensity [aveMFI] of 3 samples are indicated). (C) Two-step RT-qPCR using 24-h p.i. total RNA from the indicated samples. The primer pairs for the cellular transcript TBP-1 and viral transcripts CAT and VAI are shown. Normalization of all samples to HPRT using the ΔΔCT method was carried out as described in Materials and Methods.
Fig 2.
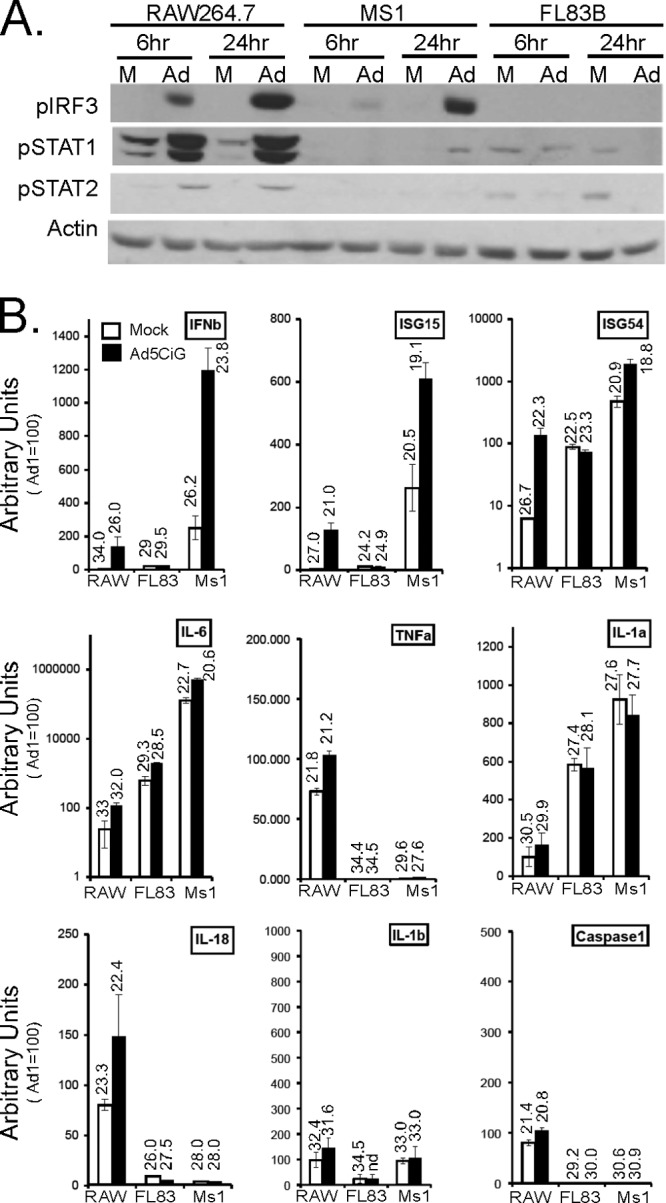
Antiviral responses to rAdV in diverse cell lines. (A) RAW 264.7, MS1, and FL83B cells mock treated (M) or infected with 20,000 p/cell of Ad5CiG were harvested at 6 and 24 h postinfection and analyzed by Western blotting (probed with phosphospecific antibodies p-ser388IRF3, p-tyr701STAT1, and p-tyr689STAT2 and an actin-specific antibody as a total-protein control. (B) Two-step RT-qPCR of RNA isolated from mock- or 24-h Ad5CiG-infected cells characterizing IRF3-dependent inducible transcripts (IFN-β, ISG15, and ISG54), inflammation-related transcripts (IL-6, TNF-α, and IL-1α), and inflammasome-related transcripts (IL-18, IL-1β, and caspase 1). All samples were normalized to HPRT using the ΔΔCT method as described in Materials and Methods. Ad5CiG RAW264.7 sample 1 was set to an arbitrary value of 100. The numbers above the bars represent the unnormalized average CT values from biological triplicates for each transcript. The error bars indicate the standard errors of the mean.
To assess the nature of the antiviral state for these cells, RT-qPCR of IRF3-inducible transcripts (IFN-β, ISG15, and ISG54), inflammation-related transcripts (IL-6, TNF-α, and IL-1α), and inflammasome-related transcripts (IL-18, IL-1β, and caspase 1) was carried out on total RNA isolated from untreated and virus-infected cells (24 h postinfection) (Fig. 2B). HPRT was used for normalization of all RT-qPCR assays, where the RAW Ad5CiG 1 sample was given an arbitrary value of 100, allowing direct comparison to all other samples. To provide a reference indicator of the transcript amount, the unnormalized average CT number from 3 biological replicates is shown above each bar (where 3.3 CT units represents an approximately 1-log-unit difference in yield). CT values of 30 or greater represent extremely low levels of steady-state transcript, and levels too low to be reliably determined were assessed as not detectable (nd).
Prior to infection, each cell has a distinct profile, which may impact the endpoint of an antiviral response. Cell line to cell line differences for key antiviral transcripts were varied over several orders of magnitude (IFN-β, ISG15, IL-6, and TNF). Following virus treatment, the change in expression was consistent with changes found through Western analysis (Fig. 2A). Upregulation of IRF3-dependent transcripts occurred in RAW and MS1 cells, but not in FL83B cells. Inflammatory response transcripts were modestly induced in both MS1 and RAW264.7 cells, but only IL-6 was induced in FL83B cells. Virus infection had the least overall effect on inflammasome-related transcripts, where only RAW cells had a very modest change in expression due to virus exposure. These data are consistent with previous studies that have identified the antiadenovirus response in primary APCs as biased toward a type I IFN response (6, 14, 15, 22). Using RAW264.7 cells as a standard for antiviral response, MS1 endothelial cells reveal a modified response, whereas FL83B hepatocytes are largely inert.
To extend examination of the antiviral response in MS1 and FL83B cells, direct transfection was used to introduce nucleic acid into each cell line. Equal masses (2 μg) of adenoviral DNA, the DNA analogue poly(dA-dT), or the double-stranded RNA (dsRNA) analogue poly(I·C) was transfected into each cell line using Lipofectamine 2000. LPS treatment provided a nucleic acid-independent ligand for IRF3 induction. Consistent with previous observations (18), RAW264.7 cells underwent IRF3 activation by all treatments and also presented a strong STAT1/2 phosphorylation profile (Fig. 3A). Transfection of MS1 cells (Fig. 3B) produced a strong IRF3 activation profile with each of the nucleic acid treatments; however, the lack of IRF3 activation following LPS treatment was unexpected. vDNA and poly(dA-dT) treatments also produced strong STAT1/2 phosphorylation in MS1 cells.
Fig 3.

Cell-specific IRF3 activation response to DNA/RNA stimulatory ligands. Shown is Western analysis of lysates harvested at the indicated time points comparing RAW 264.7 cells (A), MS1 endothelial cells (B), and FL83B hepatocytes (C) exposed to 20,000 p/cell of Ad5CiG and transfected with 2 μg of Ad5CiG DNA (vDNA), poly(dA-dT), or poly(I·C). Exposure to bacterial endotoxin (LPS; 100 ng/ml) was included as a non-nucleic acid positive control; mock and LF treatments were corresponding negative controls. The Western blot was probed with the phosphospecific antibody p-ser388IRF3, p-tyr701STAT1, or p-tyr689STAT2, as well as actin-specific antibodies as a total-protein control. (D) Each cell type was treated with rAd5CiG, LPS, and poly(IC) (without Lipofectamine) and probed as previously described, with the addition of a phosphospecific antibody targeting NF-κB–p65. All experiments were done a minimum of three times. M, mock.
In contrast to MS1 and RAW 264.7 cells, FL83B cells were nonresponsive to virus and transfected vDNA but responsive to poly(I·C) transfection (Fig. 3C). A weak response was also detected following poly(dA-dT) transfection. Since these cells were refractory to vDNA, the response elicited by poly(dA-dT) may reflect RNA polymerase III (which operates with short dA-dT-rich DNA templates [1, 8]) transcripts engaging the RIG-I–MDA5/MAVS RNA sensor pathway. Although poly(I·C)-dependent IRF3 phosphorylation occurs, the secondary response targets STAT1/2 were not strongly activated.
The lack of IRF3 activation in MS1 and FL83 cells treated with LPS was further examined using a shortened time course and assessing NF-κB phosphorylation following cell treatment (Fig. 3D). Each cell line was mock treated or exposed to rAd5CiG, LPS, or poly(I·C) (without Lipofectamine). LPS stimulated NF-κB, IRF3, and STAT1/2 phosphorylation in RAW cells; however, only NF-κB p65 phosphorylation was above background in MS1 cells, and none of these markers were detected following LPS treatment of FL83B cells. Poly(I·C) treatment induced an NF-κB, IRF3, and STAT1/2 response in RAW cells, but not in MS1 or FL83B cells. These experiments demonstrate cell-specific responses to the membrane TLR ligands LPS and poly(I·C) without transfection. Overall, the studies demonstrate that the primary cytosolic RNA sensing machinery is functional in all cell lines, whereas the DNA sensing apparatus is inactive in FL83B cells.
Comparative RT-qPCR of nucleic acid sensor components. (i) Downstream cascade components.
Cell-specific differences in the recognition/response to rAd5CiG led us to characterize nucleic acid sensor/cascade components in each cell type and to determine how virus infection alters expression patterns. Total RNA harvested from untreated cells was compared to RNA isolated 24 h postinfection using RT-qPCR (Fig. 4). Normalization to HPRT was as previously described, and for each primer pair, we used the RAW Ad1 sample to establish an arbitrary value of 100, and unnormalized average CT values are provided as reference indicators of transcript amounts.
Fig 4.

Comparative RT-qPCR of downstream nucleic acid sensing cascade components. Two-step RT-qPCR of RNA isolated from mock- or Ad5CiG-infected RAW264.7, FL83B, or MS1 cells harvested 24 h p.i. was performed. The results from PCR primers corresponding to IRF3, -5, and -7; cascade kinases TBK1 and IKKe; and adaptor molecules MyD88, TRIF, MAVS, and STING are shown. All samples were normalized to HPRT using the ΔΔCT method as described in Materials and Methods. RAW264.7 sample 1 was set to an arbitrary value of 100. The numbers above the bars represent unnormalized average CT values from biological triplicates for each transcript. The error bars indicate the standard errors of the mean.
Transcripts of critical downstream nucleic acid sensing components, TBK1 and IRF3, were well represented in each cell line, and virus infection did not impact the levels of these transcripts (the TBK1-like kinase IKKe was also present in each cell line). Levels of STAT1 and IRF7 were also represented, with the highest steady-state level present in MS1 cells. Following virus infection, STAT1 and IRF7 were strongly induced in RAW264.7 cells and modestly induced in MS1 cells, and levels in FL83B cells were not influenced by infection. IRF5 was well represented in RAW 264.7 cells, reduced by over 1 log unit in MS1 cells, and essentially absent in FL83B cells. Modest IRF5 induction was observed in RAW and MS1 cells following infection. IRF7 is a target of the endosomal TLR9 pathway (MyD88/TRAF6) (9), whereas IRF5 is strongly activated by the NOD2/RIP2 cascade (2).
(ii) Nucleic acid adaptor molecules.
Adaptor molecules provide the bridge between nucleic acid sensors and effector kinases (TBK1/IKKe). Cytosolic RNA sensors utilize MAVS (IPS), whereas STING (MITA) is an established adaptor for cytosolic DNA sensors. Endosomally associated TLR signaling depends on MyD88, the adaptor for most TLRs, with the exception of TLR3, which utilizes TRIF. MyD88 was present in all cell types (Fig. 4); however, levels in FL83B cells were an order of magnitude below those found in RAW cells. Although differences in MyD88 were revealed, the cell-specific differences in TRIF expression were extreme. In comparison to RAW 264.7 cells, levels in MS1 and FL83B cells were essentially nonexistent (down approximately 3 log units). Ad5CiG had minimal impact on the expression levels of these transcripts. The low levels of TRIF correlate with the lack of IRF3 activation by LPS in these cell types (Fig. 3).
Equivalent expression of MAVS between cell lines (Fig. 4) is consistent with the similar pser388IRF3 responses following poly(I·C) transfection (Fig. 3). Ad5CiG infection did not produce dramatic alterations in MAVS levels. In contrast to MAVS, high levels of STING were present in RAW 264.7 and MS1 cells but essentially nonexistent in FL83B cells (reduced by greater than 3 log units). The extremely low level of STING in FL83B cells provides an explanation for the lack of DNA responsiveness in the cell line.
To test the hypothesis that STING deficiency accounts for the non-DNA-responsive FL83B phenotype, a cell line expressing a Flag-tagged version of STING was produced (Fig. 5A). FL83B and FLAG-STING-FL83B cells were infected with rAd5CiG or transfected with vDNA. IRF3 phosphorylation was detected in FLAG-STING-FL83B cells, supporting the hypothesis that IRF3 activation through DNA recognition requires the STING adaptor. To establish a universal role for STING in DNA-dependent activation of IRF3, we applied a short hairpin RNA (shRNA) knockdown strategy (18) to MS1 cells. Three MS1 knockdown pools were generated using pLKO lentiviral vectors expressing either a scrambled shRNA, a STING-shRNA, or a MAVS-shRNA. Following RT-qPCR assessment of knockdown efficiency in MS1 cell pools (Fig. 5B), cells from each pool were treated with LF alone, LF-vDNA, or LF-poly(IC) and harvested over the indicated 6-h time course (Fig. 5C). Knockdown of STING abrogates IRF3 activation by vDNA but does not affect poly(I·C) induction of pIRF3. Conversely, MAVS knockdown eliminates poly(I·C)-dependent IRF3 phosphorylation but does not impact vDNA-dependent activation. Consistent with the observations made with nucleic acid transfection, rAd5CiG infection induces IRF3 phosphorylation in both the scrambled and MAVS shRNA knockdown cell pools, but Ad5CiG-induced IRF3 phosphorylation is absent in the shSTING knockdown cell pool (Fig. 5D). These data support a model in which regulation of adaptor molecules (STING, TRIF, and MyD88) is an effective general strategy for defining cell-specific antiviral signaling. It is noteworthy that the adaptor transcripts characterized in these assays (STING, MAVS,TRIF, and MyD88), were not inducible by Ad5CiG infection.
Fig 5.

Adaptor proteins as control elements of cell-specific nucleic acid sensing. (A) Wild-type (wt) and G418-selected FL83B cells stably expressing N-terminally FLAG-tagged STING were mock treated, infected with 20,000 particles of Ad5CiG, or transfected (LF/DNA) with 4 μg of Ad5CiG DNA or poly(I·C). Cells were harvested for protein at the indicated time points (2, 4, and 6 h), and analyzed by Western blotting with antibodies as indicated. (B) RNA isolated from MS1 cells infected with scrambled, anti-STING, or anti-MAVS shRNA lentiviral vectors and puromycin selected for 7 days was characterized for knockdown of STING or MAVS mRNA by RT-qPCR. RNAs were normalized against HPRT and compared to the scrambled 1 sample, which was set to 100. The error bars indicate the standard errors of the mean. (C) Scrambled, anti-STING, or anti-MAVS shRNA MS1 cells were used in a standard IRF3 activation assay following vDNA or poly(I·C) transfection and harvested at the indicated time points for Western blot analysis. (D) Scrambled, anti-STING, or anti-MAVS shRNA MS1 cells were mock treated or infected with 20,000 particles of Ad5CiG and harvested at 6 and 24 h postinfection for Western blot analysis.
(iii) Nucleic acid sensors.
Interestingly, when transcript levels corresponding to the RNA sensors TLR3, RIG-I, and MDA5 were compared (Fig. 6), RAW264.7 cells expressed the lowest overall levels, MS1 cells expressed the highest level, and FL83B hepatocytes were intermediate. Treatment with rAd5CiG generated a virus-dependent upregulation of RNA sensors in both RAW264.7 and MS1 cells, but not in FL83B cells. At the level of RNA sensors, the antiviral vRNA response network is present in each cell type and is inducible in Ad-responsive cells.
Fig 6.

Comparative RT-qPCR of nucleic acid sensors. Two-step RT-qPCR of RNA isolated from mock- or Ad5CiG-infected RAW264.7, FL83B, or MS1 cells harvested 24 h p.i. was performed. PCR primers corresponding to the RNA sensors Mda5, RIG-I, and TLR3 and the DNA sensors AIM2, DDx41, p204, Lrrfip1 var3, DAI(ZBP1), and TLR9 are shown. All samples were normalized to HPRT using the ΔΔCT method as described in Materials and Methods. RAW264.7 sample 1 was set to an arbitrary value of 100. The numbers above the bars represent unnormalized average CT values from biological triplicates for each transcript. nd, samples were not detectable. The error bars indicate the standard errors of the mean.
DNA sensors are a diverse population of proteins that engage a variety of stress response targets, including inflammasome activation, NF-κB-dependent signaling, and the IRF3/IFN-β cascade. RT-qPCR quantification of DNA sensor transcripts revealed cell-specific expression/induction profiles as follows. (i) Aim2 and DDx41 were well expressed in all cell types and not influenced by rAd5CiG infection. (ii) Lrrfip1 var 3 was expressed in all cell types, but the lowest level was found in RAW264.7 cells and was not inducible by rAd5CiG infection. (iii) Both p204 and DAI (ZBP1) were induced by rAd5CiG in RAW264.7 and MS1 cells but not in FL83B cells. In RAW 264.7 cells, DAI was extremely low or not reliably detectable without induction by rAd5CiG. (iv) Finally, the endosomal DNA sensor TLR9 was not detectable in FL83B or MS1 cells but was expressed in RAW264.7 cells.
In RAW 264.7 cells, shRNA knockdown of AIM2, and to a lesser extent DDX41, was found to impact rAd activation of IRF3 (18). To assess the cytosolic DNA sensor(s) linked to IRF3 activation in MS1 cells, the same shRNA knockdown strategy was employed. MS1 cells were infected with shRNA-lentiviral vectors expressing a scrambled SC-shRNA-, DDX41-shRNA-, p204-shRNA-, or AIM2-shRNA-targeting vector. Following puromycin selection, total RNA was harvested from each cell line and assayed for shRNA knockdown efficiency (Fig. 7A). Cell pools from each knockdown were transfected with vDNA, and proteins were harvested over a 6-h time course for Western analysis (Fig. 7B). These treatments had little influence on IRF3 activation in MS1 cells. Clearly, shRNA knockdowns were not 100%, and residual expression may be sufficient for DNA-dependent activation; however, similar treatment of RAW264.7 cells revealed a pronounced effect (reference 18 and data not shown).
Fig 7.
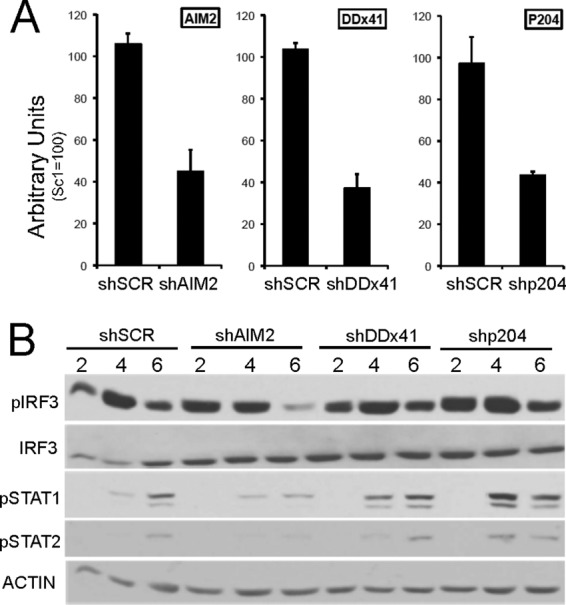
IRF3 activation following shRNA knockdown of DNA sensors. (A) RNA isolated from MS1 cells infected with shSCR, shDDx41, shp204, and shAim2 lentiviral vectors and puromycin selected for 7 days was characterized for knockdown of each mRNA by RT-qPCR. The RNAs were normalized against HPRT and compared to the scrambled 1 sample, which was set to 100. (B) shRNA knockdown pools were treated with vDNA as previously described and harvested at 2, 4, and 6 h posttreatment for analysis by Western blot screening.
DISCUSSION
We have characterized cell-specific nucleic acid recognition response pathways in three diverse cell types, using IRF3 activation as a marker for a primary response and STAT1/2 activation as a marker for secondary signaling. Comparative RT-qPCR was used to assess cascade components in naïve and adenovirus-infected cells. Differences in expression of cascade components are proposed to shape antiviral responses in a cell-specific manner. FL83B hepatocytes are essentially nonresponsive to adenoviral infection, RAW macrophages are fully responsive, and MS1 endothelial cells demonstrate a modified scope of antiviral response. The data support a model where adaptor molecules operate as critical regulatory nodes for functional nucleic acid sensing. By restricting expression of adaptor molecules, particularly those targeting TBK1/IRF3, the cell has effectively restricted/redirected the impact of DNA/RNA recognition away from an IRF3 activation response.
This study focused on adenovirus infection as a model for antiviral response through DNA detection mechanisms. The lack of a DNA response in FL83B cells was primarily attributed to the absence of STING expression in these cells. Control of PAMP recognition responses by regulating adaptor expression was not limited to DNA detection pathways. In our studies, different nucleic acids and LPS treatments were included, signaling through pathways independent of DNA sensing mechanisms. The lack of IRF3 phosphorylation in both FL83B and MS1 cells following LPS treatment was unexpected. RT-qPCR revealed that FL83B hepatocytes were devoid not only of STING, but also of TRIF, and expressed low levels of MyD88. The scarcity of TRIF and MyD88 in FL83B cells accounts for the lack of response to LPS or exogenous poly(IC) (TLR3 mediated). The unresponsiveness of these cells to DNA eliminates the potential for inadvertent signaling from all sources (host/bacterial/viral). The only fully operative nucleic acid sensor cascade in FL83B hepatocytes operates through the MAVS adaptor pathway. Since RNA sensing through RIG-I and MDA-5/MAVS was represented in each cell type, the RNA/MAVS intracellular signaling may be a minimal default nucleic acid sensing cascade operating in all cells.
Interestingly, in contrast to FL83B cells, MS1 cells lacked TRIF but expressed MyD88. These cells presented with a muted LPS response at the level of IRF3 phosphorylation, but MyD88-dependent activation of NF-κB p65 was intact. In RAW cells, LPS stimulates both IRF3 and NF-κB p65 activation. Therefore, three LPS response phenotypes that are determined by cell-specific expression of the adaptor population have been identified. Antiviral transcripts are often IFN inducible; however, we found no evidence that the adaptor molecules were induced by rAd5CiG infection. Therefore, adaptor transcript expression was dependent on cellular determinants and not inducible by stress stimuli. The data are consistent with PAMP adaptor proteins operating as anchoring lynchpins to the cell-specific antiviral phenotype.
Where adaptor molecules provide cell-specific platforms for nucleic acid sensing cascades, nucleic acid sensors contribute both flexibility and functionality. The modest early response to virus infection in MS1 cells may indicate that endothelial cells operate with a higher threshold for antiviral activation in comparison to APCs. DNA sensor availability, organization, and redundancy of function are possible modes of controlling responsiveness to DNA. Based on the data, redundancy may be the key feature in understanding the cell-specific operation of DNA sensors. TLR9 does not signal through IRF3. Due to the accumulated data on DAI, we do not consider it to be involved in the early response to rAd5CiG leading to IRF3 phosphorylation. However, they are both inducible following rAdV infection, which we believe speaks to their participation in secondary stages of antiviral stress response pathways. In contrast, AIM2 and DDx41 were uniformly present in each cell line, and transcript levels were unchanged following Ad5CiG infection. In contrast, p204 was present and inducible by Ad5CiG. Both AIM2 and p204 are classified as IFN-inducible transcripts (3, 4), so the difference in response to rAd5CiG infection indicates that possible novel regulatory mechanisms are operating with these hin200 genes. At the level of DNA sensor expression, there was no overt deficiency in the cell lines examined. DNA sensor knockdowns using shRNA strategies contrast with the observations made with adaptor knockdowns. Where adaptor knockdowns (STING or MAVS) in MS1 cells yielded a clear loss in response to virus or DNA, the influence of DNA sensor knockdowns was less convincing. We have previously found that a knockdown of AIM2 and DDx41 had an effect on IRF3 phosphorylation in RAW cells (18), and when this strategy was applied to MS1 endothelial cells, a clear impact on IRF3 activation was not detected with any of the knockdown assays, illustrating one more difference between cell types. Multiple sensors may be available in MS1, limiting the effect of a single knockdown. Future studies targeting multiple transcripts for shRNA or siRNA knockdown strategies may be useful in establishing DNA sensor redundancy.
All cell lines expressed the RNA sensors RIG-I, MDA-5, and TLR3, and in DNA-responsive cells, all RNA sensors were inducible following infection. Interestingly, where DNA detection triggers a primary recognition response, upregulation of RNA sensor pathways may provide a backup amplification response ultimately triggered by viral transcript. The availability of redundant nucleic acid sensing pathways complements the well-established dsRNA PKR antiviral pathway (5, 12).
Finally, the simple presence of known sensing components may not be sufficient to orchestrate a robust antiviral DNA recognition response. The highly permissive FL83B hepatocytes are nonresponsive at the level of IRF3 activation. We have proposed STING deficiency as a major reason for the lack of DNA responsiveness in these cells. However, even when STING has been provided and DNA recognition has been established (as evidenced by IRF3 phosphorylation following DNA transfection), the antiviral recognition response (IRF3 activation) following Ad5CiG infection was still not detected. Therefore, although STING is proposed as a necessary adaptor for DNA-mediated activation of IRF3, it is not sufficient to establish an antiviral response in these cells. Other factors must contribute to generating an optimal antiviral response to viral infection. We consider the mode of virus entry and the management of virions through distinct endocytic compartments to be possible factors that may influence the ability of viral DNA to be delivered to specific DNA sensing networks. We also recognized that the simple addition of STING might not accurately/fully reproduce the sensing complex, as has been established in the more responsive APCs. Further characterization will be required to assess how virus entry and delivery may influence antiviral recognition cascades. In recent years, an appreciation of the complexity of nucleic acid sensing cascades has grown, first with RNA response cascades and, more recently, with DNA response cascades. With the discovery of new sensors or pathway components, questions of organization and control are raised. We have found simple control of adaptor molecule expression to be a central component in regulating cell-specific antiviral recognition pathways.
ACKNOWLEDGMENTS
E.F.-P. is the recipient of a Hearst Foundation Award. This work was supported by Public Health Service grant RO1 AI094050 to E.F.-P.
We thank Tyler Janovitz for critical reading of the manuscript.
Footnotes
Published ahead of print 26 September 2012
REFERENCES
- 1. Ablasser A, et al. 2009. RIG-I-dependent sensing of poly(dA:dT) through the induction of an RNA polymerase III-transcribed RNA intermediate. Nat. Immunol. 10:1065–1072 [DOI] [PMC free article] [PubMed] [Google Scholar]
- 2. Chang Foreman HC, Van Scoy S, Cheng TF, Reich NC. 2012. Activation of interferon regulatory factor 5 by site specific phosphorylation. PLoS One 7:e33098 doi:10.1371/journal.pone.0033098 [DOI] [PMC free article] [PubMed] [Google Scholar]
- 3. Choubey D, et al. 2010. Interferon-Inducible p200-Family Proteins as Novel Sensors of Cytoplasmic DNA: Role in Inflammation and Autoimmunity. J. Interferon Cytokine Res. 30:371–380 [DOI] [PMC free article] [PubMed] [Google Scholar]
- 4. Choubey D, Walter S, Geng Y, Xin H. 2000. Cytoplasmic localization of the interferon-inducible protein that is encoded by the AIM2 (absent in melanoma) gene from the 200-gene family. FEBS Lett. 474:38–42 [DOI] [PubMed] [Google Scholar]
- 5. Clemens MJ, Elia A. 1997. The double-stranded RNA-dependent protein kinase PKR: structure and function. J. Interferon Cytokine Res. 17:503–524 [DOI] [PubMed] [Google Scholar]
- 6. Fejer G, et al. 2008. Key role of splenic myeloid DCs in the IFN-alphabeta response to adenoviruses in vivo. PLoS Pathog. 4:e1000208 doi:10.1371/journal.ppat.1000208 [DOI] [PMC free article] [PubMed] [Google Scholar]
- 7. Ganesan LP, et al. 2011. Rapid and efficient clearance of blood-borne virus by liver sinusoidal endothelium. PLoS Pathog. 7:e1002281 doi:10.1371/journal.ppat.1002281 [DOI] [PMC free article] [PubMed] [Google Scholar]
- 8. Goodfellow SJ, White RJ. 2007. Regulation of RNA polymerase III transcription during mammalian cell growth. Cell Cycle 6:2323–2326 [DOI] [PubMed] [Google Scholar]
- 9. Kawai T, et al. 2004. Interferon-alpha induction through Toll-like receptors involves a direct interaction of IRF7 with MyD88 and TRAF6. Nat. Immunol. 5:1061–1068 [DOI] [PubMed] [Google Scholar]
- 10. Livak KJ, Schmittgen TD. 2001. Analysis of relative gene expression data using real-time quantitative PCR and the 2(-Delta Delta C(T)) method. Methods 25:402–408 [DOI] [PubMed] [Google Scholar]
- 11. McIntyre GJ, Fanning GC. 2006. Design and cloning strategies for constructing shRNA expression vectors. BMC Biotechnol. 6:1. [DOI] [PMC free article] [PubMed] [Google Scholar]
- 12. McKenna SA, Lindhout DA, Shimoike T, Puglisi JD. 2007. Biophysical and biochemical investigations of dsRNA-activated kinase PKR. Methods Enzymol. 430:373–396 [DOI] [PubMed] [Google Scholar]
- 13. Moffat J, et al. 2006. A lentiviral RNAi library for human and mouse genes applied to an arrayed viral high-content screen. Cell 124:1283–1298 [DOI] [PubMed] [Google Scholar]
- 14. Nociari M, Ocheretina O, Murphy M, Falck-Pedersen E. 2009. Adenovirus induction of IRF3 occurs through a binary trigger targeting JNK and TBK-1 kinase cascades and type I IFN autocrine signaling. J. Virol. 83:4081–4091 [DOI] [PMC free article] [PubMed] [Google Scholar]
- 15. Nociari M, Ocheretina O, Schoggins JW, Falck-Pedersen E. 2007. Sensing infection by adenovirus: Toll-like receptor-independent viral DNA recognition signals activation of the interferon regulatory factor 3 master regulator. J. Virol. 81:4145–4157 [DOI] [PMC free article] [PubMed] [Google Scholar]
- 16. Schmittgen TD, Livak KJ. 2008. Analyzing real-time PCR data by the comparative C(T) method. Nat. Protoc. 3:1101–1108 [DOI] [PubMed] [Google Scholar]
- 17. Schoggins JW, Falck-Pedersen E. 2006. Fiber and penton base capsid modifications yield diminished Ad5 transduction and proinflammatory gene expression with retention of antigen specific humoral immunity. J. Virol. 80:10634–10637 [DOI] [PMC free article] [PubMed] [Google Scholar]
- 18. Stein SC, Falck-Pedersen E. 2012. Sensing adenovirus infection: activation of interferon regulatory factor 3 in RAW 264.7 cells. J. Virol. 86:4527–4537 [DOI] [PMC free article] [PubMed] [Google Scholar]
- 19. Takaoka A, et al. 2007. DAI (DLM-1/ZBP1) is a cytosolic DNA sensor and an activator of innate immune response. Nature 448:501–505 [DOI] [PubMed] [Google Scholar]
- 20. Thompson MR, Kaminski JJ, Kurt-Jones EA, Fitzgerald KA. 2011. Pattern recognition receptors and the innate immune response to viral infection. Viruses 3:920–940 [DOI] [PMC free article] [PubMed] [Google Scholar]
- 21. Yuan B, Latek R, Hossbach M, Tuschl T, Lewitter F. 2004. siRNA Selection Server: an automated siRNA oligonucleotide prediction server. Nucleic Acids Res. 32:W130–W134 [DOI] [PMC free article] [PubMed] [Google Scholar]
- 22. Zhu J, Huang X, Yang Y. 2007. Innate immune response to adenoviral vectors is mediated by both Toll-like receptor-dependent and -independent pathways. J. Virol. 81:3170–3180 [DOI] [PMC free article] [PubMed] [Google Scholar]