Abstract
Membrane binding of the HIV-1 group-specific antigen (Gag) structural protein, a critical step in viral assembly at the plasma membrane, is mediated by the myristoylated, highly basic matrix (MA) domain, which interacts with negatively charged lipids in the inner leaflet. According to a popular model, virus particles bud from membrane rafts, microdomains enriched in cholesterol and high-melting phospholipids with higher order than found outside rafts. How Gag might recognize membrane rafts, if they exist in the inner leaflet, is unknown. Using a liposome flotation assay with proteins translated in vitro, we investigated whether Gag can sense the composition of the hydrophobic part of the bilayer, by fixing lipid head group composition and varying hydrophobic properties. In liposomes composed solely of phosphatidylserine and phosphatidylcholine, and with the same overall membrane negative charge, Gag strongly preferred lipids with both acyl chains unsaturated over those with only one chain unsaturated. Adding cholesterol increased Gag binding and led to closer packing of phospholipids. However, higher membrane order, as measured by electron spin resonance, was not correlated with increased Gag binding. Gag proteins from two other retroviruses gave similar results. These liposome binding preferences were qualitatively recapitulated by purified myristoylated HIV-1 MA. Phosphatidylinositol 4,5-bisphosphate and cholesterol enhanced binding in an additive manner. Taken together, these results show that Gag is sensitive both to the acyl chains of phosphatidylserine and to cholesterol concentration and other details of the membrane environment. These observations may help explain how retroviruses acquire a raft-like lipid composition.
Keywords: lipid raft, phase diagram, virus assembly
The retroviral structural polyprotein group-specific antigen (Gag) drives virus assembly at the plasma membrane (PM). Gag molecules bind to the PM, then through protein–protein interactions form a curved lattice that bulges out and eventually leads to budding and release of the enveloped virus particles. HIV-1 Gag interacts with the negatively charged inner leaflet of the PM, primarily via its N-terminal matrix (MA) domain. Three features of MA underlie HIV-1 Gag membrane binding: an N-terminal myristate, a highly basic patch, and a pocket for the minor lipid phosphatidylinositol bisphosphate PI(4,5)P2 (1). Multimerization and vesicular trafficking also play roles in membrane interaction in vivo. PI(4,5)P2 is important in vivo, based on the observations that its depletion by an overexpressed phosphatase compromises budding (2) and that it is enriched in the HIV-1 envelope (3). In vitro and biochemical assays qualitatively support the conclusions about Gag–PM interaction in vivo: In vitro flotation assays show HIV-1 Gag binding to liposomes to be dependent on negatively charged lipids, particularly phosphatidylserine (PS) (4), which is enriched in the inner leaflet of the PM. Liposome binding is enhanced by the addition of PI(4,5)P2 (5), although without great specificity for this particular phosphoinositide (5, 6).
HIV-1 is said to bud from rafts (reviewed in (7)). Diverse strands of evidence support this model. First, cellular proteins found in rafts are often associated with viral particles (8). Second, the envelopes of retroviruses such as HIV-1 (3, 9, 10) and Rous sarcoma virus (RSV) (11, 12) are enriched with sphingomyelin (SM) and cholesterol, compared with the PM. Third, two retroviral proteins—Nef for HIV-1 and Glycogag for murine leukemia virus (MLV)—promote cholesterol incorporation into virus particles and raft association of Gag (13, 14). Fourth, cholesterol depletion from cells reduces HIV-1 release (15). However, how virus particles acquire the observed high cholesterol content is unknown. For example, Gag might prefer to bind to raft-like microdomains, or the lattice of Gag molecules might induce raft formation de novo, or Gag might cause coalescence of preexisting raft domains (16). Few studies have addressed such questions in vitro. In chemically simple, lipid-only models of the PM outer leaflet, a large region of compositions is found in which two phases coexist, the liquid-disordered (Ld) phase and the liquid-ordered (Lo) phase. This compositional region may be termed the raft region. The minimal lipid requirement for Ld + Lo coexistence in a mixture is a high–melting temperature (Tm) lipid, such as SM or distearoyl phosphatidylcholine (DSPC); a low-Tm lipid, such as dioleoyl phosphatidylcholine (DOPC) or palmitoyl, oleoyl phosphatidylcholine (POPC); and cholesterol. Compared with the Ld phase, the Lo phase is enriched in the high-Tm lipid and in cholesterol in these simple mixtures.
A major challenge to understanding how HIV-1 acquires a raft-like lipid composition is that rafts are known only for the outer leaflet of the PM, yet Gag interacts directly with the inner leaflet. By composition, the inner leaflet has no high-Tm lipid, has lower concentrations of phosphatidylcholine (PC), and has high concentrations of phosphatidylethanolamine, PS, and cholesterol (17). No Ld + Lo coexistence has been observed in bilayer models representing the composition of the inner leaflet (18).
Here, we investigated how cholesterol and phospholipid acyl chain type affect HIV-1 Gag binding to liposomes in vitro, as measured by Gag flotation in sucrose gradients. Although they still are not a good mimic of the properties of the inner leaflet, we chose simplified model mixtures of PS/PC or PS/PC/cholesterol, because the phase behaviors of similar mixtures are relatively well understood and accurate phase diagrams might be used to guide mixture choices (19). Results show that Gag–membrane interactions depend on phospholipid head group type, as known previously, but notably also on cholesterol concentration and on acyl chain saturation.
Results and Discussion
We examined how membrane negative charge, cholesterol concentration, and phospholipid acyl chain properties affect HIV-1 Gag membrane binding. Radiolabeled Gag was synthesized in vitro in a reticulocyte translation system. Binding to 100-nm large unilamellar vesicles (LUVs) was measured by flotation in a sucrose gradient (5, 6, 20, 21).
Effects of Acyl Chain Saturation on HIV-1 Gag Binding.
Increasing the ratio of PS to PC is known to increase the binding of Gag to LUVs (4–6, 20). To test whether Gag is sensitive to acyl chain length and saturation, PC- and PS-containing LUVs were prepared with three acyl chain types: DOPC/DOPS, in which both lipids have two 18:1 (oleoyl) chains; POPC/POPS, in which one fatty acid is 16:0 and the other is 18:1 (palmitoyl, oleoyl); and egg PC/brain PS, a natural mixture, with the PC being 32% 16:0, 32% 18:1, 12% 18:0, and 17% 18:2, and the PS being dominated by 18:0, 18:1 chains. By keeping the PS and PC chains identical or nearly so, comparisons of each mixture focus on the behavior of the particular PS chains, rather than on the way disparate PS and PC chains might mix.
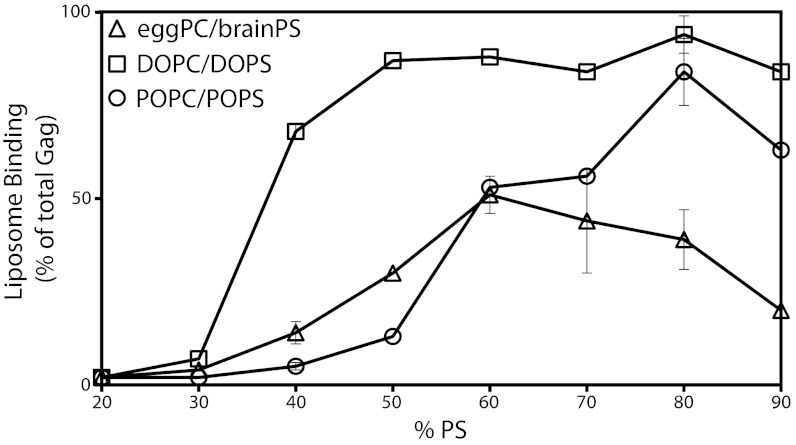
As PS concentration increased from 20% to 90%, binding of HIV-1 Gag to LUVs with mixtures of the three acyl chain types differed (Fig. 1). Gag binding to DOPC/DOPS increased steeply at ∼30% PS, reaching a maximum at ∼50% PS. Gag binding to POPC/POPS increased only gradually, starting at ∼30% PS and reaching a somewhat lower maximum. Finally, Gag binding to natural PC/PS again increased gradually starting at ∼30% PS, reached a maximum at ∼65% PS, and then gradually decreased at higher PS concentrations. The membrane charge seen by Gag does not differ among these mixtures at any given PS concentration (22). However, surprisingly, Gag behaves as though it experiences a greater effective PS concentration in the DOPC/DOPC mixtures.
Fig. 1.
Acyl chain saturation influences PS-driven HIV-1 Gag liposome binding. [35S]methionine-labeled HIV-1 Gag synthesized in a reticulocyte extract was incubated with liposomes composed of one of the following three mixtures of two phospholipids: DOPC and DOPS; POPC and POPS; or egg PC and brain PS. [The oleoyl acyl chain has one double bond (18:1), whereas the palmitoyl acyl chain has no double bonds (16:0)]. The percentage of Gag that floated with the liposomes in a sucrose gradient, as determined by SDS/PAGE and fluorography, was plotted as a function of increasing concentration of the negatively charged lipid PS. Error bars indicate SD for replicas done at 40% and 80% PS for all three lipid compositions and at 60% and 70% PS for the natural phospholipids.
Cholesterol-Enhanced Binding of Gag.
The effect of cholesterol on membrane binding of retroviral Gag proteins in vitro has not been investigated systematically. We measured Gag binding to LUVs with increasing cholesterol content in four different phospholipid environments, including one that mimics Lo and Ld compositions: DSPC (18:0, 18:0-PC)/DOPC/DOPS, DOPC/DOPS, POPC/POPS, and egg PC/brain PS. In each different lipid mixture, the percentage of cholesterol was increased whereas the percentage of PC was decreased, keeping PS unchanged at 30%. The maximum cholesterol content, 63%, is near its solubility limit in PC mixtures (23). The resulting cholesterol concentrations cover the cholesterol concentration of plasma membranes, which may be as high as 50% (17).
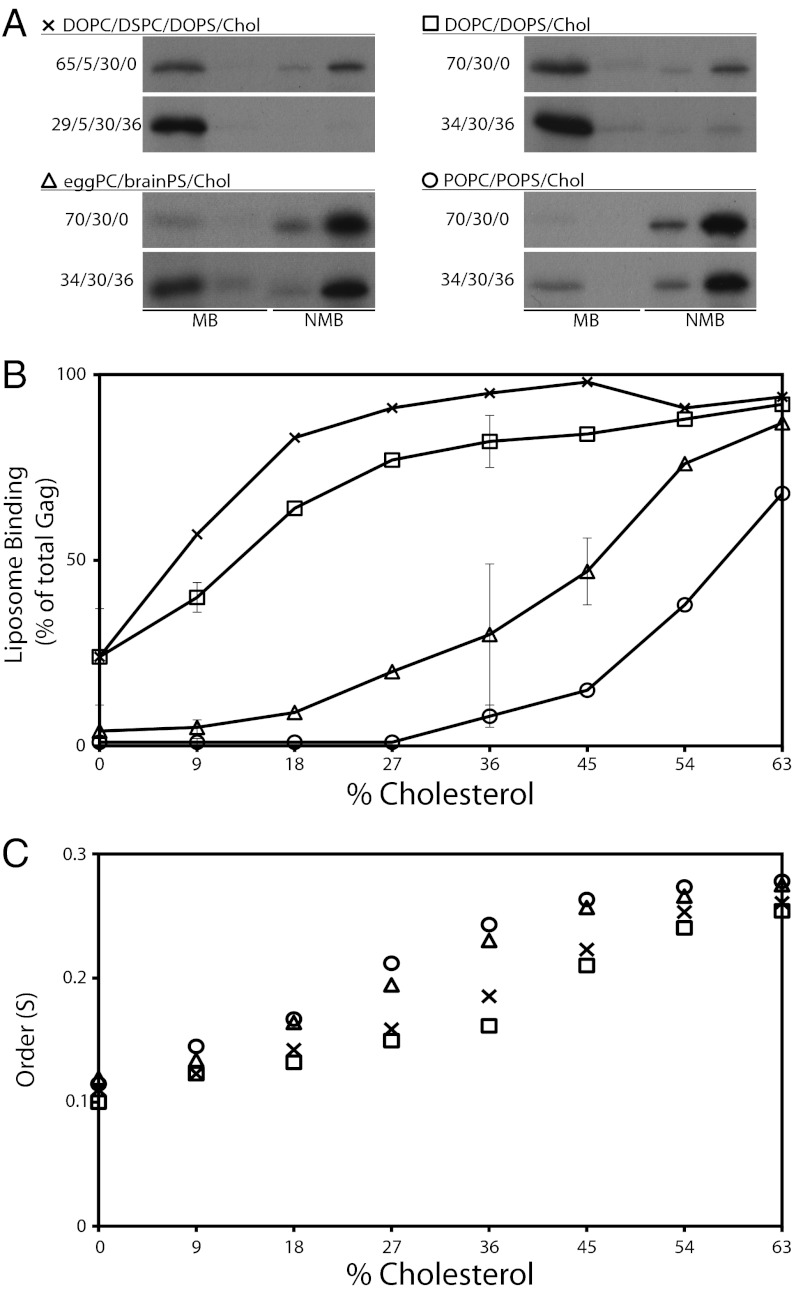
For all four mixtures tested, an increased cholesterol concentration resulted in increased binding of Gag, as shown by the fluorograms (Fig. 2A) and in more detail in Fig. 2B. Two distinct behaviors are observed, characterized by different shapes of the binding curves: (i) In the two DOPC-containing mixtures, Gag binding increased strongly starting at the lowest cholesterol concentrations, rising to nearly maximal binding at ∼36% cholesterol. This behavior occurred regardless of whether the mixtures contained 5% of the saturated acyl chain lipid DSPC. (ii) In egg PC/brain PS mixtures, Gag binding started to increase only at ∼18% cholesterol, then rose gradually toward the same maximum found with the DOPC-containing mixtures. In POPC-containing mixtures, the curve shape was similar but with binding first detected at ∼36% cholesterol, gradually increasing to a slightly lower maximum. This cholesterol-mediated enhancement of HIV-1 Gag binding in these simple model liposomes might mimic the association of HIV-1 Gag with cholesterol-containing plasma membranes, particularly with lipid raft microdomains in the membrane.
Fig. 2.
Cholesterol concentration influences HIV-1 Gag binding to liposomes. Liposomes were made with a fixed 30% PS and varying ratios of cholesterol and DOPC or POPC (and in one case also containing 5% DSPC, 18:0, 18:0). HIV-1 Gag synthesis and flotation analyses were as described in Fig. 1. (A) Examples of lipid ratios for each of the four lipid compositions used and the corresponding fluorograms. MB, membrane bound (floated liposomes); NMB, nonmembrane bound (one-fourth of the sample loaded compared with MB). (B) Quantification of flotation reactions. The symbols are the same as those in A. Error bars represent SD for the three, three-component mixtures repeated in triplicate at 9% and 36% cholesterol, for DOPC/DOPS/0% cholesterol, and for egg PC/brain PS/45% cholesterol. (C) ESR measurements for each of the four liposome compositions from 0–63% cholesterol. S, order parameter.
Adding cholesterol to phospholipid bilayers increases the packing density of phospholipid acyl chains and head groups, the well-known “cholesterol condensing effect” (24). Closer lipid packing means increased acyl chain order, a parameter that can be measured by electron spin resonance (ESR) with spin-labeled lipid probes. We carried out ESR measurements on all four mixtures with 16-doxylstearic acid (16-DSA). Increased cholesterol concentration clearly increased lipid order (Fig. 2C), yet the order was not correlated with the Gag binding differences seen in Fig. 2B. In particular, at every cholesterol concentration, Gag behaved as though it detected a higher PS concentration in DOPS-containing mixtures than in POPS or brain PS mixtures.
Effects of Lipid Order on Gag Membrane Interaction.
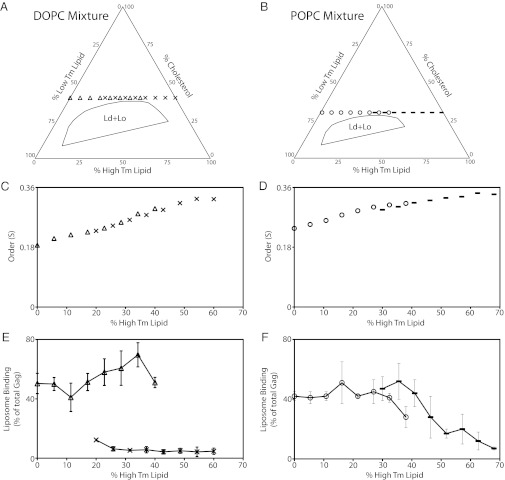
To explore more systematically the model that “viruses bud from rafts,” we selected lipid mixtures closer in composition to actual Ld and Lo phases, based on published phase diagrams (19). We avoided phase coexistence regions by choosing a cholesterol concentration slightly higher than the Ld + Lo coexistence region. Two kinds of mixtures were examined, one containing DOPC, the other POPC. We prepared four series of LUVs, two with constant cholesterol = 40% and PS = 20%, and two with constant cholesterol = 32% and PS = 30%. In all four mixtures, the membrane order was systematically varied by changing the ratio of high-melting, saturated DSPC to low-melting, unsaturated lipids. Thereby, the LUV compositions ranged from Ld to Lo (Fig. 3 A and B; Fig. S1 provides an explanation of how to interpret phase diagrams, and Tables S1–S4 show all lipid compositions). Two sets of eight compositions were prepared for the DOPC and two for the POPC mixtures, each lying on a line of constant cholesterol concentration and extending from all low-Tm (Ld) lipid on the left to all high-Tm (Lo) lipid on the right. Because Gag binding to DOPC/DOPS/cholesterol at 40% cholesterol was nearly maximal at 30% PS (Fig. 2B), the PS in the DOPC-containing mixture was reduced to a fixed 20% to increase the dynamic range for observing Gag binding in these mixtures.
Fig. 3.
Membrane order has complex influence on HIV-1 Gag–liposome binding at fixed PS and cholesterol concentrations. HIV-1 Gag and flotation analyses were as described in Fig. 1. (A and B) Phase diagrams situate the DOPC and POPC mixtures tested relative to the Ld + Lo phase coexistence region. (A) The leftmost triangle crossing the low-Tm lipid axis represents a composition of low-Tm lipids DOPC/DOPS/cholesterol (40%/20%/40%). Each triangle moving sequentially to the right has an additional 5.7% DOPC replaced with 5.7% of the high-Tm lipid DSPC. The rightmost X symbol represents a composition of high-Tm lipids DSPC/DPPS/cholesterol (40%/20%/40%). Each X moving sequentially to the left has 5.7% DSPC replaced by 5.7% of the low-Tm DOPC. Note that the boundaries of the four-component phase diagrams containing PS have not been determined, but they are shown here based on the published three-component phase diagrams (19) to provide a guide to the expected phase behavior of the four-component PS-containing mixtures. (B) As in A, except with POPC lipids instead of DOPC lipids. The left starting point for the low-Tm lipids POPC/POPS/cholesterol (38%/30%/32%) is marked by a circle, with each sequential point having 5.4% POPC replaced by 5.4% of the high-Tm lipid DSPC. The right starting point for the high-Tm lipids DSPC/DPPS/cholesterol (38%/30%/32%) is marked by a dash, with each sequential point having 5.4% DSPC replaced with 5.4% of the low-Tm lipid POPC. All compositions yield a single phase (i.e., not coexistence of the two phases, Ld + Lo). Lipid order increases from the left to right (Ld to Lo) as the percentage of high-Tm lipid increases. (C and E) ESR and Gag binding measurements for the DOPC-containing liposomes. (D and F) ESR and Gag binding measurements for the POPC-containing liposomes. The symbols in C and D are the same as those in A and B. Error bars represent SD for at least three replicas for each data point.
ESR measurements showed that increasing the percentage of high-Tm lipids increased membrane order, regardless of whether DOPS or dipalmitoyl phosphatidylserine (DPPS) was in the mixtures (Fig. 3 C and D). Comparing Fig. 3 C with D, at each high-Tm lipid percentage up to ∼50%, the DOPC-containing mixture had a slightly lower order than did the POPC-containing mixture, indicating that the saturated acyl chain of POPC confers more order to the mixture despite the lower cholesterol concentration of 32%, compared with 40%.
We found that Gag binding in these mixtures was not a function of membrane order. Whereas order increased gradually and monotonically as the high-Tm lipid concentration increased, Gag binding exhibited dramatic differences. For 20% DOPS in the 40% cholesterol/DOPC/DSPC mixtures (triangles), replacing DOPC with the high-Tm DSPC resulted in nearly unchanged Gag binding for the eight LUV compositions (Fig. 3E). In stark contrast, for 20% DPPS in the 40% cholesterol/DOPC/DSPC mixtures (X symbols), Gag binding was barely detectable for any replacement of DOPC by DSPC (Fig. 3E). This surprising result was reproducible in multiple LUV preparations. Thus, in a variety of membrane environments, including some that are very similar to those resulting in strong Gag binding to DOPS, Gag behaves as though it hardly detects the 20% DPPS.
Quite different Gag binding occurred with only subtle changes in lipid composition in the POPC-containing mixtures (Fig. 3F): For 30% POPS in 32% cholesterol/POPC/DSPC mixtures (open circles), replacing POPC with DSPC hardly changed Gag binding, which decreased only slightly when DSPC reached 38%. In contrast, for 30% DPPS in the 32% cholesterol/POPC/DSPC mixtures, Gag binding at first remained high as DSPC replaced POPC, then gradually dropped toward ∼0 as the POPC was completely replaced by DSPC (Fig. 3F). In remarkable contrast to the behavior of DOPC-containing mixtures at 40% cholesterol in which very low Gag binding occurred when the PS was 20% DPPS, high Gag binding was observed in mixtures containing 30% DPPS in POPC-containing mixtures with 32% cholesterol. Thus, Gag binds well to DPPS, but only in mixtures in which the DPPS is in some sense sufficiently “available” to Gag.
These data show that cholesterol enhancement of HIV-1 Gag-liposome binding is not solely a consequence of a cholesterol-induced increase in membrane order. Instead, the data imply that Gag detects three lipid mixture features besides PS concentration: (i) the ensemble of all acyl chains in the membrane, (ii) the cholesterol concentration, and (iii) the nature of the acyl chains of the negatively charged PS with which Gag interacts.
Response of Other Retroviral Gag Proteins to Cholesterol and Phospholipid Acyl Chain Type.
To determine whether the sensing of differences in the content of cholesterol and acyl chains in liposomes is unique to HIV-1 Gag, we tested MLV Gag and RSV Gag proteins in parallel with HIV-1 Gag. MLV Gag also is naturally myristoylated at its N-terminus, but RSV Gag is not lipidated in any way. To mimic the differences between Ld and Lo phases, two pairs of LUVs were prepared for each protein: (i) 30% brain PS + egg PC with or without 36% cholesterol and (ii) 30% PS, but with compositions chosen close to those of known Ld + Lo phase coexistence (19) and with a membrane order characteristic of an Ld or Lo mixture.
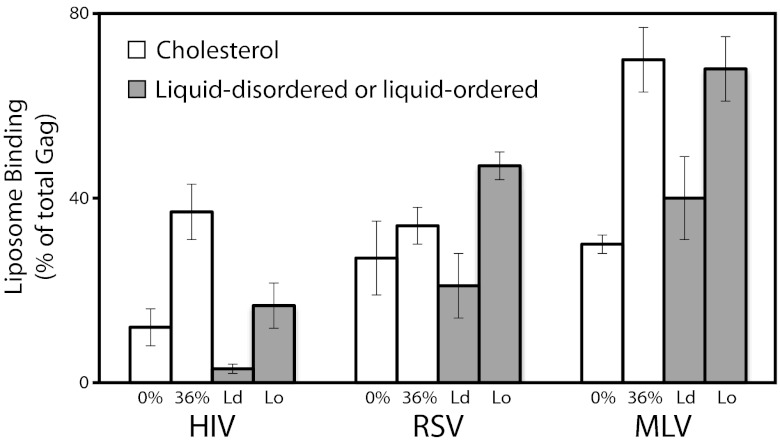
HIV-1, RSV, and MLV Gag proteins all responded similarly to these LUV mimics of Ld and Lo phases, preferring liposomes containing a high cholesterol concentration coupled with acyl chain saturation (Fig. 4). Only in the case of the 0% and 36% cholesterol LUVs did RSV Gag bind without a significant difference. Thus, Gag sensing of the acyl chain composition does not require an N-terminal fatty acid chain. However, the preference for the Lo composition seen here does not indicate that membrane order alone is the explanation. The HIV-1 Gag binding shown in Fig. 3 E and F makes clear that the nature of the PS acyl chains, the cholesterol concentration, and the acyl chains of other lipids present all have a strong influence on Gag binding.
Fig. 4.
Acyl chain type and presence of cholesterol influence liposome binding of other retroviral Gag proteins. The three Gag proteins were expressed in a reticulocyte lysate and analyzed by flotation as in Fig. 1. RSV, Rous sarcoma virus (alpharetrovirus genus); MLV, murine leukemia virus (gamma retrovirus genus). The lipid compositions were as follows: 0% = 70% egg PC/30% brain PS; 36% = 34% egg PC/30% brain PS/36% cholesterol (white bars); Ld = 10% DSPC/30% POPS/50% POPC/10% cholesterol; Lo = 22% DSPC/30% DPPS/23% POPC/25% cholesterol. The histograms represent at least three replicas; error bars show SD. Order parameter (S), as determined via ESR, is 0.156 for the Ld composition and 0.332 for the Lo composition.
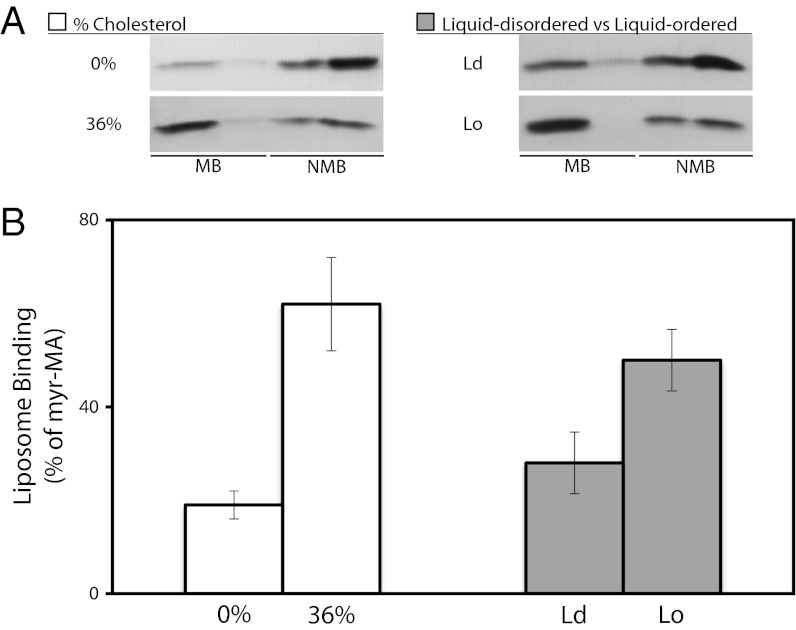
An advantage of the reticulocyte extract is that it simulates a cellular environment, for example by the presence of RNA and proteins. A disadvantage is that unknown components might influence Gag binding. Therefore, we tested the binding of nonradioactively labeled, myristoylated HIV-1 MA protein (myr-MA) that had been purified after expression in Escherichia coli (4, 25). Myr-MA behaved similarly to HIV-1 Gag in that the presence of cholesterol strongly enhanced binding to LUVs (Fig. 5). Moreover, like Gag, purified myr-MA also preferred the LUVs with the Lo composition, corroborating the results from the reticulocyte experiments.
Fig. 5.
Acyl chain type and presence of cholesterol influence liposome binding of purified HIV-1 MA. Myristoylated MA was purified from an E. coli expression system. Fifteen micrograms of protein was mixed with 50 μg of liposomes containing either 0% cholesterol or 36% cholesterol, or with an Ld or Lo composition, both as defined in Fig. 4. Binding was measured after flotation by SDS/PAGE and Coomassie blue staining and densitometry. (A) Representative flotation result showing the stained MA band. (B) Quantitation. For all these lipid compositions, the concentration of PS was constant (30%). Bars represent the average of no fewer than three replicas. Error bars represent SD.
PI(4,5)P2-Enhanced Membrane Binding in the Presence of Cholesterol.
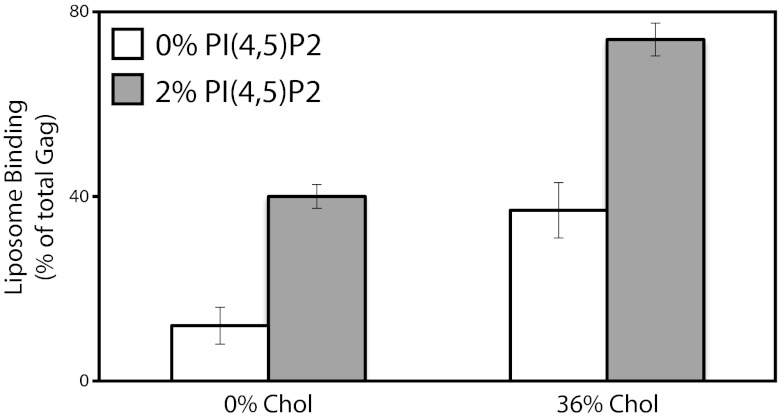
Because of the established role of PI(4,5)P2 in membrane binding, we examined the ability of cholesterol to stimulate binding of HIV-1 Gag to LUVs containing PI(4,5)P2. Flotation assays were carried out with LUVs prepared with 30% brain PS and egg PC, with or without 36% cholesterol and with or without 2% PI(4,5)P2, a concentration similar to that found in HIV-1 virion membranes (3). In these binding assays, 2% PI(4,5)P2 was sufficient to elicit a threefold increase in Gag binding. Addition of cholesterol boosted Gag binding by a further twofold (Fig. 6). Thus, the cholesterol enhancement appears to be effective for membrane association driven not only by PS alone, but also by PS and PI(4,5)P2, which are inferred to be important in vivo.
Fig. 6.
Cholesterol enhancement of HIV-1 Gag binding to membranes containing PI(4,5)P2. Gag protein was synthesized and analyzed by flotation as in Fig. 1. White bars, binding to liposomes containing 0% or 36% cholesterol (data taken from Fig. 4); gray bars, binding to liposomes with 2% PC being substituted with 2% PI(4,5)P2. The data represent the average of no fewer than three flotations, with error bars representing the SDs.
Summary and Conclusions
To study how virus particles might bud from plasma membrane rafts, we set out to develop an in vitro model for HIV-1 Gag binding to raft-like and non–raft-like membranes. The results show that Gag–membrane interaction is sensitive not only to net negative charge, as known previously, but also to the hydrophobic environment of the bilayer, namely cholesterol content and phospholipid acyl chain type. For example, in binary mixtures of PS/PC, the Gag protein strongly prefers DOPS to POPS, and it prefers higher over lower cholesterol content in diverse phospholipid mixtures. Nevertheless, Gag does not detect membrane order per se, as inferred from comparison of Gag binding with membrane order, as measured by ESR. The cholesterol enhancement effect behaves as if cholesterol makes more PS available for binding to Gag. To our knowledge, this is the first systematic study of the effects of the hydrophobic core of a membrane on the binding of the internal structural protein of an enveloped virus. Although the mechanisms underlying the effects observed appear to be complex, they may be central to understanding the membrane specificity of viral budding.
Materials and Methods
Plasmids, Protein Purification, Liposome Preparation, and Electron Spin Resonance.
The plasmids encoding HIV GagΔp6 BH10 and RSV GagΔPR and encoding myristoylated HIV-1 MA (myr-MA), as well as the purification procedure for myr-MA, were described previously (4, 25) or are detailed in the supporting information.
Liposome Preparation.
Liposomes were prepared by the rapid solvent exchange method (26), modified as described (27). Briefly, lipids in chloroform solution were dispensed into glass tubes. After the addition of buffer (20 mM Hepes, pH 7.0), the mixture was vortexed under vacuum for 90 s and sealed under argon gas, yielding 10 mg/mL hydrated liposomes. Liposome samples were stored at 4 °C up to 1 wk before extrusion. To prepare LUVs, a miniextruder block (Avanti) was heated to 45 °C. Liposomes were extruded 41 times through 100-nm polycarbonate filters (Avanti) and stored at 4 °C. Extruded liposomes were used within 1 wk. Details of the methods used to handle lipids (28) and to prepare samples for ESR measurements may be found in the supporting information. All percent values refer to mol %. For ESR measurements, typical instrument settings were as follows: center field = 3,320 G, sweep width = 100 G, modulation frequency = 100 kHz, modulation amplitude = 1 G, time constant = conversion time = 81.92 s, and resolution = 2,000 points. Nine scans were averaged for each sample. Amax and Amin were determined directly from the spectra, and the order parameter of each sample was calculated according to Schorn and Marsh (29) using the hyperfine tensor (Axx, Ayy, Azz) = (5.9, 5.4, 32.9 G).
Liposome Binding Assay.
Radioactively labeled protein was prepared by translation in the TNT coupled T7 rabbit reticulocyte reaction (Promega) in the presence of [35S]methionine/cysteine (Perkin-Elmer; ExPRE35S35 protein labeling mix). The liposome binding assay used for Figs. 1 and 2, here referred to as large-format assay, was described previously (6). A small-format liposome binding assay was used for Figs. 3–6, as described previously (20), with some modification. A 5-μL fraction of a 25-μL reticulocyte transcription reaction was added to 15 μL binding buffer (20 mM Hepes, pH 7.0), followed by 50 μg of LUVs (to a concentration of 8.5 mg/mL). The reaction mix was incubated at 22 °C for 10 min. Each binding reaction was mixed with 75 μL 67% sucrose, and 80 μL of this mix was placed in a TLA-100 tube, followed by 120 μL 40% sucrose and 40 μL 4% sucrose. All sucrose was made wt/wt with binding buffer. Centrifugation was at 90,000 rpm in a TLA-100 rotor (Beckman) for 1 h. Purified myr-MA flotations were performed with 15 μg of protein in place of the reticulocyte reaction, and the binding buffer and sucrose were supplemented with NaCl so that all solutions were at a final concentration of 150 mM NaCl. Four 60-μL fractions were collected from each flotation, and 40 μL of each fraction was analyzed by SDS/PAGE.
Supplementary Material
Acknowledgments
We thank the National Biomedical Center for Advanced ESR Technology at Cornell University and Boris Dzikovski for help in ESR data collection and analysis. We also thank Christina Wang and Susan Duan for helpful discussions. This work was supported by US Public Health Service Grant CA20081 (to V.M.V.) and National Science Foundation Grant MCB 0842839 (to G.W.F.).
Footnotes
The authors declare no conflict of interest.
This article is a PNAS Direct Submission.
See Commentary on page 18631.
This article contains supporting information online at www.pnas.org/lookup/suppl/doi:10.1073/pnas.1209408109/-/DCSupplemental.
References
- 1.Saad JS, et al. Structural basis for targeting HIV-1 Gag proteins to the plasma membrane for virus assembly. Proc Natl Acad Sci USA. 2006;103:11364–11369. doi: 10.1073/pnas.0602818103. [DOI] [PMC free article] [PubMed] [Google Scholar]
- 2.Ono A, Ablan SD, Lockett SJ, Nagashima K, Freed EO. Phosphatidylinositol (4,5) bisphosphate regulates HIV-1 Gag targeting to the plasma membrane. Proc Natl Acad Sci USA. 2004;101:14889–14894. doi: 10.1073/pnas.0405596101. [DOI] [PMC free article] [PubMed] [Google Scholar]
- 3.Chan R, et al. Retroviruses human immunodeficiency virus and murine leukemia virus are enriched in phosphoinositides. J Virol. 2008;82:11228–11238. doi: 10.1128/JVI.00981-08. [DOI] [PMC free article] [PubMed] [Google Scholar]
- 4.Dalton AK, Ako-Adjei D, Murray PS, Murray D, Vogt VM. Electrostatic interactions drive membrane association of the human immunodeficiency virus type 1 Gag MA domain. J Virol. 2007;81:6434–6445. doi: 10.1128/JVI.02757-06. [DOI] [PMC free article] [PubMed] [Google Scholar]
- 5.Chukkapalli V, Hogue IB, Boyko V, Hu WS, Ono A. Interaction between the human immunodeficiency virus type 1 Gag matrix domain and phosphatidylinositol-(4,5)-bisphosphate is essential for efficient gag membrane binding. J Virol. 2008;82:2405–2417. doi: 10.1128/JVI.01614-07. [DOI] [PMC free article] [PubMed] [Google Scholar]
- 6.Chan J, Dick RA, Vogt VM. Rous sarcoma virus Gag has no specific requirement for phosphatidylinositol-(4,5)-bisphosphate for plasma membrane association in vivo or for liposome interaction in vitro. J Virol. 2011;85:10851–10860. doi: 10.1128/JVI.00760-11. [DOI] [PMC free article] [PubMed] [Google Scholar]
- 7.Waheed AA, Freed EO. Lipids and membrane microdomains in HIV-1 replication. Virus Res. 2009;143:162–176. doi: 10.1016/j.virusres.2009.04.007. [DOI] [PMC free article] [PubMed] [Google Scholar]
- 8.Ott DE. Cellular proteins detected in HIV-1. Rev Med Virol. 2008;18:159–175. doi: 10.1002/rmv.570. [DOI] [PubMed] [Google Scholar]
- 9.Aloia RC, Tian H, Jensen FC. Lipid composition and fluidity of the human immunodeficiency virus envelope and host cell plasma membranes. Proc Natl Acad Sci USA. 1993;90:5181–5185. doi: 10.1073/pnas.90.11.5181. [DOI] [PMC free article] [PubMed] [Google Scholar]
- 10.Brügger B, et al. The HIV lipidome: a raft with an unusual composition. Proc Natl Acad Sci USA. 2006;103:2641–2646. doi: 10.1073/pnas.0511136103. [DOI] [PMC free article] [PubMed] [Google Scholar]
- 11.Pessin JE, Glaser M. Budding of Rous sarcoma virus and vesicular stomatitis virus from localized lipid regions in the plasma membrane of chicken embryo fibroblasts. J Biol Chem. 1980;255:9044–9050. [PubMed] [Google Scholar]
- 12.Quigley JP, Rifkin DB, Reich E. Phospholipid composition of Rous sarcoma virus, host cell membranes and other enveloped RNA viruses. Virology. 1971;46:106–116. doi: 10.1016/0042-6822(71)90010-9. [DOI] [PubMed] [Google Scholar]
- 13.Nitta T, Kuznetsov Y, McPherson A, Fan H. Murine leukemia virus glycosylated Gag (gPr80gag) facilitates interferon-sensitive virus release through lipid rafts. Proc Natl Acad Sci USA. 2010;107:1190–1195. doi: 10.1073/pnas.0908660107. [DOI] [PMC free article] [PubMed] [Google Scholar]
- 14.Zheng YH, Plemenitas A, Fielding CJ, Peterlin BM. Nef increases the synthesis of and transports cholesterol to lipid rafts and HIV-1 progeny virions. Proc Natl Acad Sci USA. 2003;100:8460–8465. doi: 10.1073/pnas.1437453100. [DOI] [PMC free article] [PubMed] [Google Scholar]
- 15.Ono A, Waheed AA, Freed EO. Depletion of cellular cholesterol inhibits membrane binding and higher-order multimerization of human immunodeficiency virus type 1 Gag. Virology. 2007;360:27–35. doi: 10.1016/j.virol.2006.10.011. [DOI] [PMC free article] [PubMed] [Google Scholar]
- 16.Hogue IB, Grover JR, Soheilian F, Nagashima K, Ono A. Gag induces the coalescence of clustered lipid rafts and tetraspanin-enriched microdomains at HIV-1 assembly sites on the plasma membrane. J Virol. 2011;85:9749–9766. doi: 10.1128/JVI.00743-11. [DOI] [PMC free article] [PubMed] [Google Scholar]
- 17.van Meer G, Voelker DR, Feigenson GW. Membrane lipids: Where they are and how they behave. Nat Rev Mol Cell Biol. 2008;9:112–124. doi: 10.1038/nrm2330. [DOI] [PMC free article] [PubMed] [Google Scholar]
- 18.Wang TY, Silvius JR. Cholesterol does not induce segregation of liquid-ordered domains in bilayers modeling the inner leaflet of the plasma membrane. Biophys J. 2001;81:2762–2773. doi: 10.1016/S0006-3495(01)75919-X. [DOI] [PMC free article] [PubMed] [Google Scholar]
- 19.Heberle FA, Wu J, Goh SL, Petruzielo RS, Feigenson GW. Comparison of three ternary lipid bilayer mixtures: FRET and ESR reveal nanodomains. Biophys J. 2010;99:3309–3318. doi: 10.1016/j.bpj.2010.09.064. [DOI] [PMC free article] [PubMed] [Google Scholar]
- 20.Dalton AK, Murray PS, Murray D, Vogt VM. Biochemical characterization of Rous sarcoma virus MA protein interaction with membranes. J Virol. 2005;79:6227–6238. doi: 10.1128/JVI.79.10.6227-6238.2005. [DOI] [PMC free article] [PubMed] [Google Scholar]
- 21.Alfadhli A, Still A, Barklis E. Analysis of human immunodeficiency virus type 1 matrix binding to membranes and nucleic acids. J Virol. 2009;83:12196–12203. doi: 10.1128/JVI.01197-09. [DOI] [PMC free article] [PubMed] [Google Scholar]
- 22.Winiski AP, McLaughlin AC, McDaniel RV, Eisenberg M, McLaughlin S. An experimental test of the discreteness-of-charge effect in positive and negative lipid bilayers. Biochemistry. 1986;25:8206–8214. doi: 10.1021/bi00373a013. [DOI] [PubMed] [Google Scholar]
- 23.Huang J, Buboltz JT, Feigenson GW. Maximum solubility of cholesterol in phosphatidylcholine and phosphatidylethanolamine bilayers. Biochim Biophys Acta. 1999;1417:89–100. doi: 10.1016/s0005-2736(98)00260-0. [DOI] [PubMed] [Google Scholar]
- 24.Huang J, Feigenson GW. A microscopic interaction model of maximum solubility of cholesterol in lipid bilayers. Biophys J. 1999;76:2142–2157. doi: 10.1016/S0006-3495(99)77369-8. [DOI] [PMC free article] [PubMed] [Google Scholar]
- 25.Tang C, et al. Entropic switch regulates myristate exposure in the HIV-1 matrix protein. Proc Natl Acad Sci USA. 2004;101:517–522. doi: 10.1073/pnas.0305665101. [DOI] [PMC free article] [PubMed] [Google Scholar]
- 26.Buboltz JT, Feigenson GW. A novel strategy for the preparation of liposomes: Rapid solvent exchange. Biochim Biophys Acta. 1999;1417:232–245. doi: 10.1016/s0005-2736(99)00006-1. [DOI] [PubMed] [Google Scholar]
- 27.Zhao J, et al. Phase studies of model biomembranes: Complex behavior of DSPC/DOPC/cholesterol. Biochim Biophys Acta. 2007;1768:2764–2776. doi: 10.1016/j.bbamem.2007.07.008. [DOI] [PMC free article] [PubMed] [Google Scholar]
- 28.Kingsley PB, Feigenson GW. The synthesis of a perdeuterated phospholipid: 1,2-dimyristoyl-sn-glycero-3-phosphocholine-d72. Chem Phys Lipids. 1979;24:135–147. [Google Scholar]
- 29.Schorn K, Marsh D. Extracting order parameters from powder EPR lineshapes for spin-labelled lipids in membranes. Spectrochim Acta A Mol Biomol Spectrosc. 1997;53:2235–2240. [Google Scholar]
Associated Data
This section collects any data citations, data availability statements, or supplementary materials included in this article.


