Abstract
Background
The mTOR kinase controls cell growth, proliferation and metabolism through two distinct multi-protein complexes, mTORC1 and mTORC2. We reported that alcohol (EtOH) inhibits mTORC1 activity and protein synthesis in C2C12 myoblasts. However, the role that mTORC2 plays in this process has not been elucidated. In this study, we investigated whether mTORC2 functions as part of a feedback regulator in response to EtOH, acting to maintain the balance between the functions of Akt, mTORC2 and mTORC1.
Methods
C2C12 myoblasts were incubated with EtOH for 18-24 h. Levels of various mTORC2 proteins and mRNA were assessed by immunoblotting and real-time PCR, respectively, while protein-protein interactions were determined by immunoprecipitation and immunoblotting. An in vitro mTORC2 kinase activity assay was performed using Akt as a substrate. The rate of protein synthesis was determined by 35S-methionine/cysteine incorporation into cellular protein.
Results
EtOH (100 mM) increased the protein and mRNA levels of the mTORC2 components rictor, mSin1, PRR5 and Deptor. There was also an increased association of these proteins with mTOR. EtOH increased the in vitro kinase activity of mTORC2, and this was correlated with decreased binding of rictor with 14-3-3 and Deptor. Reduced rictor phosphorylation at T1135 by EtOH was most likely due to decreased S6K1 activity. Knockdown of rictor elevated mTORC1 activity, as indicated by increased S6K1 phosphorylation and protein synthesis. Likewise, there were decreased amounts and/or phosphorylation levels of various mTORC1 and mTORC2 components including raptor, PRAS40, mSin1, Deptor and GβL. Activated PP2A was associated with decreased Akt and eEF2 phosphorylation. Collectively, our results provide evidence of a homeostatic balance between the two mTOR complexes following EtOH treatments in myoblasts.
Conclusions
EtOH increased the activity of mTORC2 by elevating levels of various components and their interaction with mTOR. Decreased rictor phosphorylation at T1135 acts as mTORC1-dependent feedback mechanisms, functioning in addition to the IRS-I/PI3K signaling pathway to regulate protein synthesis.
Keywords: Ethanol, rictor, shRNA, protein synthesis
INTRODUCTION
The mammalian target of rapamycin (mTOR) is an evolutionarily conserved Ser/Thr protein kinase that regulates numerous aspects of cell growth and metabolism. mTOR is activated in response to growth factors and amino acids, while conversely being inhibited by energy deficit and environmental stress. By integrating these divergent signals, mTOR controls processes such as mRNA translation and ribosome biogenesis which directly regulate protein synthesis (Sarbassov et al., 2005; Wullschleger et al., 2006). mTOR exists in two distinct heteromeric complexes termed mTORC1 (mTOR complex 1) and mTORC2 (mTOR complex 2) (Loewith et al., 2002; Sarbassov et al., 2004). mTORC1 consists of mTOR, raptor (regulatory associated protein of mTOR), PRAS40 (proline-rich Akt substrate 40 kDa), mLST8/GβL (G-protein β-subunit like protein) and Deptor (DEP-domain containing partner of TOR) (Peterson et al., 2009). Among its many functions, mTORC1 phosphorylates the ribosomal protein S6 kinase (S6K)-1 and the eukaryotic initiation factor 4E binding protein (4EBP)-1, both of which stimulate protein synthesis and cell growth.
The second complex, mTORC2, contains mTOR, rictor (rapamycin-insensitive companion of mTOR) (Sarbassov et al., 2004), as well as various isoforms of Sin1 (SAPK-interacting protein 1) (Frias et al., 2006; Jacinto et al., 2006; Yang et al., 2006), PRR5/Protor 1 (proline-rich repeat protein 5/protein observed with rictor) (Pearce et al., 2007; Woo et al., 2007), mLST8/GβL and Deptor. Although mTORC2 function is less well characterized, it regulates Akt (S473), protein kinase Cα (PKCα) and SGK-1 (serum-glucocorticoid-induced protein kinase 1) phosphorylation in response to growth factors (Facchinetti et al., 2008; Hresko and Mueckler, 2005; Ikenoue et al., 2008; Sarbassov et al., 2005). In addition, mTORC2 plays an important role in regulating the actin cytoskeleton. Thus, it acts to modulate cell growth, differentiation, survival, metabolism and cell cycle (Cybulski et al., 2009; Hietakangas and Cohen, 2008; Kumar et al., 2008; Rosner et al., 2009).
The role of individual mTORC2 proteins have not been fully defined, although some information is available. For example, rictor is an essential gene, since its complete deletion is embryonically lethal in mice (Guertin et al., 2006). Recent studies demonstrate that over-expression of rictor in gliomas leads to hyperactivation of mTORC2 which promotes tumor cells proliferation (Masri et al., 2007). In contrast, down regulation of rictor inhibits the phosphorylation of Akt at S473 (Das et al., 2008; Kumar et al., 2010). This also increases S6K1 and 4EBP1 phosphorylation in mesangial cells, thereby increasing protein synthesis (Das et al., 2008). Similar to rictor, deletion of Sin1 abolishes Akt phosphorylation and disrupts the association of rictor with mTOR (Jacinto et al., 2006). Thus, these data suggest that mTORC2 can have both positive and negative effects on the activity of mTORC1.
mTORC1 is activated by Akt in response to growth factors or other stimuli, thereby increasing S6K1 phosphorylation. This occurs via the modulation of the inhibitory effects of PRAS40 and TCS2 (tuberous sclerosis complex 2) (Dunlop and Tee, 2009; Inoki et al., 2002; Sancak et al., 2007). Recently, it was shown that activated S6K1 suppresses Akt S473 phosphorylation via two distinct negative feed back loops (Foster and Fingar, 2010). TORC1/S6K1 phosphorylation of IRS (insulin receptor substrate) proteins leads to reduced PI3K signaling. In addition, S6K1 phosphorylates rictor at T1135 and enhances binding of rictor and mTORC2 to 14-3-3 proteins (Dibble et al., 2009; Treins et al., 2010). Collectively, these data indicate interplay between mTORC1 and mTORC2 in response to growth factors. Alcohol (EtOH) also appears to influence these two complexes. For example, EtOH increases the activity of AMPK (AMP-activated protein kinase) to phosphorylate raptor and enhances its binding with 14-3-3 protein. Thus, this inhibits mTORC1 activity and S6K1 phosphorylation as well as protein synthesis. EtOH has also been shown to stimulate the phosphorylation of Akt S473 (Hong-Brown et al., 2010). At present, however, it is unknown whether EtOH affects the balance between the activities of mTORC1 and mTORC2.
Previously, we showed that EtOH decreases mTORC1 activity and protein synthesis, while it increases Akt phosphorylation at S473 (Hong-Brown et al., 2010). At present, however, it is unknown whether mTORC2 is involved in this process. The aim of this study was to characterize the function of mTORC2 under conditions that inhibit the activity of mTORC1. In addition, we attempted to elucidate connections between mTORC1 and mTORC2. We found EtOH increased mTORC2 activity by elevating the levels and association of mTORC2 proteins, while decreasing the binding of rictor with 14-3-3 protein. Knockdown of rictor decreased mTORC2 activity, while increasing mTORC1 function and protein synthesis. Taken together, our results provide evidence for a regulatory loop connecting the two mTOR complexes in response to EtOH.
MATERIALS AND METHODS
Materials
Ethanol was purchased from Fisher Scientific Co. (Springfield, NJ). The pLKO mouse shRNA 1 rictor (Addgene plasmid 21341) and scrambled shRNA (Addgene plasmid 1854) were obtained from Addgene Inc. (Cambridge, MA). Antibodies against rictor and sin1 were from Bethyl laboratories, Inc. (Montgomery, TX). The Deptor antibody was from Millipore (Temecula, CA). Total S6K1 and 14-3-3Θ antibodies were purchased from Santa Cruz Biotechnology (Santa Cruz, CA). Antibodies against phosphorylated (p-) rictor (T1135), p-Akt substrate (RxRxxpS/T), p-Akt (S473), p-PKCα/βII (T638/641), p-S6K1 (T389), were purchased from Cell Signaling Technology (Beverly, MA). Antibodies to total PKCα, Akt, mTOR, and GβL were obtained from the same source. Phenylmethanesulfonyl fluoride (PMSF), protease, phosphatase I and II inhibitor cocktails were from Sigma (St. Louis, MO). 35S-methionine/cysteine (>1000 Ci/mol) was obtained from MP Biomedicals (Aurora, OH). Cell culture media and fetal bovine serum (FBS) were from Gibco, Invitrogen Corporation (Carlsbad, CA).
Cell culture and transfection
C2C12 mouse myoblasts from American Type Culture Collection (Manassas, VA) were cultured in Dulbecco’s modified Eagle’s medium supplemented with 10% FBS, penicillin (100 U/ml), streptomycin (100 μg/ml) and amphotericin (25 μg/ml) at 37°C in 5% CO2. For transient expression, the pLKO short hairpin (sh)RNA vectors encoding shRNA target rictor or scrambled sequences (Peterson et al., 2009) were transfected into C2C12 myoblasts using electroporation and the cell line nucleofector kit V (Amaxa, Germany) following the manufactures’ protocol. Experiments were carried out 24-36 h post-transfection, and cells were harvested 18-24 h thereafter for co-immunoprecipitation and immunoblot analysis.
The effect of EtOH and rictor knockdown (KD) on protein synthesis was determined as previously described (Hong-Brown et al., 2006). EtOH was used at 100 mM, because previous dose-response studies indicted a concentration of 80-100 mM was necessary to provide a reproducible inhibition in protein synthesis without being cytotoxic to myoblasts (Hong-Brown, 2001; 2007). During the incubation, plates were sealed with parafilm to minimize the evaporation of EtOH. All experiments were conducted using cells at the early passage of the myoblast stage. For metabolic labeling, control, scrambled control or rictor KD cells were incubated in the absence or presence of EtOH and radioisotope for 18-24 h. This time point was chosen based on previous studies indicating a maximal reduction in protein synthesis (Hong-Brown, 2001; 2007). Cells were labeled with 10 μCi 35S-methionine/cysteine in 1.5-2% FBS media because C2C12 myoblast survival is decreased when cells are cultured for extended periods in serum free media. The rate of radiolabel incorporation into protein was linear between 1 h and 24 h (data not shown) indicating there was no significant change in the specific activity of the precursor pool. Hence, all subsequent studies were conducted using the 18-24 h labeling protocol. At the end of the experiment, cells were collected and precipitated in 10% trichloroacetic acid (TCA), and the incorporation of 35S-methionine/cysteine into TCA-precipitable protein was determined via liquid scintillation counting. The results were normalized with total protein and compared with the control group. Data were expressed as a percentage of the control value.
Immunoprecipitation and immunoblot analysis
C2C12 myoblasts were cultured in either 10 cm or 6-well plates in the presence or absence of EtOH for 18-24 h. Thereafter, cells were rinsed once with phosphate buffered saline and lysed in ice-cold 0.3% CHAPS (3-[(3-cholamindopropyl)dimethylammonio]-1-propanesulfonate) buffer containing PMSF and a cocktail of protease and phosphatase inhibitors. Soluble fractions of cell extracts were isolated by centrifugation at 14,000 rpm for 5 min at 4°C. For immunoprecipitation, primary antibody was added to equal amounts of protein from cell lysates and incubated overnight at 4°C. A 50% slurry of protein A sepharose was then added and the incubation was continued for an additional 1 h with rotation. Immunoprecipitates were washed 3 times with lysis buffer and the precipitated proteins were denatured by the addition of 2X Laemmli sample buffer (LSB). Equal amounts of protein from cell lysates were electrophoresed on denaturing polyacrylamide gels and transferred to nitrocellulose. The resulting blots were blocked with 5% nonfat dry milk and incubated with the antibodies of interest. Antibody dilutions for blots ranged from 1:1000 to 1:3000. Unbound primary antibody was removed by washing with TBS containing 0.05% Tween-20 (ICI Americas, Inc, Wilmington, DE) and blots were incubated with anti-rabbit immunoglobulin conjugated with horseradish peroxidase. Blots were briefly incubated with an enhanced chemiluminescent detection system (Amersham, Bickingham-shire, England) and exposed to MiDSci X-ray film (St Louis, MO). The film was scanned (ScanMaker 4, Microtek, Los Angeles, CA) and analyzed with Scion image version 3b software.
Quantitative real-time PCR
Total RNA was isolated using Qiagen RNeasy mini kit (Qiagen, Valencia, CA). RNA (5 μg) was reverse-transcribed using Invitrogen Reverse Transcriptase superscript III. The quantitative PCR (qPCR) assays were performed following the manufactures’s protocol: an initial 10 min denaturation step at 95°C, followed by forty cycles at 95°C (15 sec) and 60°C (1 min) using an Applied Biosystem StepOne Plus Real-Time PCR instrument (Foster city, CA). The TapMan primer probe sets for rictor (Mm01307318_m1), Sin1(Mm00616520_m1), PRR5 (Mm00461364_m1), Deptor (Mm01195339_m1) and RpL32 (Mm02528467_g1) were purchased from Applied Biosystems. Results were calculated using the 2 −ΔΔCT relative quantification method normalized to endogenous control RpL32.
In vitro kinase assay
For kinase activity measurements, cells were lysed in 0.3% CHAPS buffer containing 40 mM Hepes, 120 mM NaCl, 1 mM EDTA and a cocktail of protease and phosphatase inhibitors. Rictor kinase activity was carried out as described previously with minor modifications (Ikenoue et al., 2009). Briefly, equal amounts of total protein from cell extracts were immunoprecipitated over night with antibodies against total rictor or Akt. For the substrate, the antibody-antigen complex of Akt was precipitated using the Catch and Release reversible immunoprecipitation system (Upstate Biotechnology, Inc., Lake Placid, NY) following the manufacture’s protocol (Cat # 17-500). The antibody-antigen complex of rictor was captured by incubation for 1 h with protein A Sepharose (GE Healthcare Biosciences Corp, Piscataway, NJ) at 4°C on a rotator. For the rictor kinase assay, immune complexes were washed with lysis buffer and then incubated with reaction buffer (25 mM Hepes, 100 mM potassium acetate, 1 mM MgCl2, and 0.5 mM ATP) for 20-30 min at 30°C. The reaction was terminated by addition of LSB to a final concentration of 2X. Samples were heated for 5 min and run on SDS-PAGE gels. Rictor or mTORC2 kinase activities were analyzed by immunoblotting for the phosphorylation state of the Akt substrate. In vitro kinase results were standardized with immunoprecipitates and total protein for equal loading.
Statistical analysis
For experimental protocols with more than two groups, statistical significance was determined using one-way ANOVA followed by the Dunnett’s test to compare all data to the appropriate control group. For experiments with only two groups, an unpaired Student’s t-test was performed. Data are presented as mean ± SE. A value of P < 0.05 was considered statistically significant.
RESULTS
EtOH increases mTORC2 protein and mRNA content
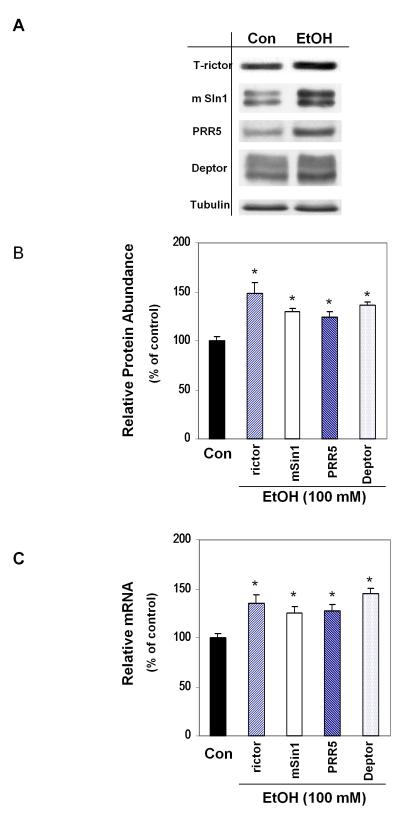
Recent studies indicate a homeostatic relationship between mTORC1 and Akt, with the activity of one influencing the function of the other (Bhaskar and Hay, 2007). Previously, we demonstrated that EtOH activates Akt at S473, while concomitantly suppressing the activity of mTORC1 and protein synthesis (Hong-Brown et al., 2010). Since mTORC2 is a major regulator of Akt phosphorylation at S473, we determined whether mTORC2 is upregulated following EtOH exposure. Incubation of C2C12 myoblasts with 100 mM EtOH for 18-24 h increased the protein levels of total rictor, mSin1, PRR5 and Deptor (Fig. 1A-B). To further confirm these results, we quantified changes in mTORC2 gene expression and found that EtOH increased the mRNA content for each of these genes (Fig. 1C).
Fig.1.
EtOH increases protein content and gene expression of mTORC2 components. C2C12 myoblasts were incubated in the presence or absence of 100 mM EtOH for 18-24 h. Equal amounts of protein from cell lysates were analyzed via Western blotting using antibodies against total forms of the indicated proteins (panel A) and tubulin. The protein levels were quantified and plotted on a bar graph (panel B). Results were normalized to total cell lysate protein and expressed as percentage of control levels. Panel C: mRNA levels were determined by quantitative real-time PCR as described in Materials and methods section. Changes in mRNA level were calculated and normalized to rpL32 mRNA. Data are means ± SE of 3-6 independent experiments consisting of 3 replicate samples per experiment. * P< 0.05 versus the control value.
EtOH alters mTORC2 protein-protein associations
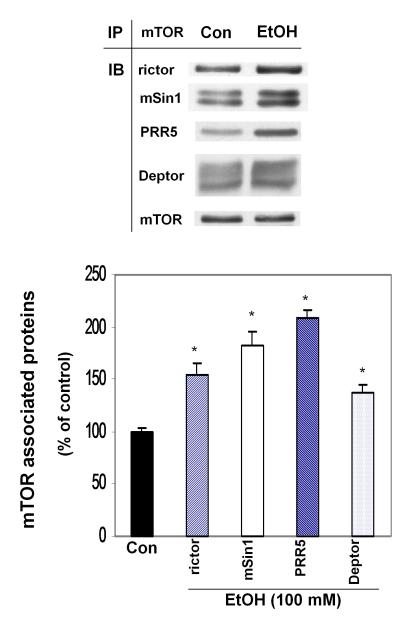
Changes in the content of individual mTORC2 proteins may affect the extent of protein interaction within the complex. Therefore, cell extracts were isolated from control and EtOH-treated cells and immunoprecipitated with mTOR. Precipitants were then immunoblotted with antibodies recognizing rictor, mSin1, PRR5, Deptor and mTOR (Fig. 2). EtOH did increase the interaction between mTOR and all four of the proteins examined (i.e., rictor, mSin1, PRR5 and Deptor) when normalized with mTOR. Note that the amount of mTOR protein in the immunoprecipitate was not different between the control and EtOH-treated cells.
Fig. 2.
Interaction of mTOR with rictor, mSin1, PRR5 and Deptor. C2C12 myoblasts were incubated in the presence or absence of EtOH (100 mM) for 18-24 h. mTOR was immunoprecipitated from equal amounts of cell extracts and immunoblotted with rictor, mSin1, PRR5 and Deptor. Results were normalized with immunoprecipitated mTOR, which was assessed by immunoblotting, and expressed as percentage of control levels. Data are means ± SE of 3 independent experiments consisting of 3-4 replicate samples per experiment. * P< 0.05 versus the control value.
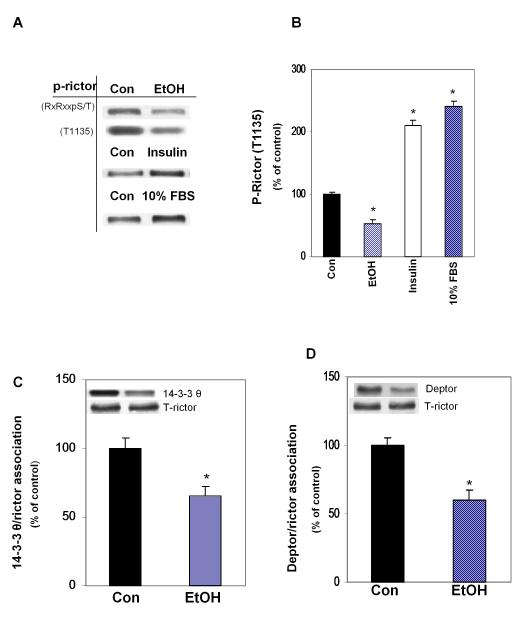
Next, we examined for the extent of rictor phosphorylation using antibodies that recognize the T1135 phosphorylation site. EtOH decreased rictor phosphorylation, while treatment of myoblasts with either insulin or 10% FBS increased rictor phosphorylation (Fig. 3A, 3B). Note that similar results were obtained using antibodies that recognize the Akt/PKB-consensus motif RxRxxpS/pT. As shown previously, increased rictor phosphorylation by growth factors enhances binding of rictor with 14-3-3 protein (Dibble et al., 2009; Treins et al., 2010). However, it has not been determined how decreased rictor phosphorylation affects this interaction. To address this issue, cell lysates from EtOH-treated or untreated myoblasts were immunoprecipitated with rictor and then immunoblotted with 14-3-3, Deptor, and rictor. EtOH decreased the interaction of rictor with 14-3-3 (panel C) and Deptor (panel D). These results indicate that EtOH increases the level of mTORC2 components and their interaction with mTOR, while decreasing the interaction of rictor with 14-3-3 or Deptor.
Fig. 3.
EtOH decreases rictor phosphorylation and interaction with the 14-3-3 protein. C2C12 myoblasts were incubated in the presence or absence of EtOH (100 mM) for 18-24 h, treated for 20 min with insulin (50 nM) or 1 h with 10% FBS. Cell extracts were analyzed using p-Akt substrate or p-rictor (T1135) antibodies (panel A). Quantitative data are presented in bar graph (panel B). Results for indicated phosphorylated proteins were normalized to total protein and expressed as percentage of control levels. Panel C: myoblasts were incubated with EtOH as described above. Endogenous rictor was immunoprecipitated from equal amounts of cell lysates and immunoblotted with 14-3-3 Θ (panel C) or Deptor (panel D). Results were normalized with immunoprecpitated rictor, which was assessed by immunoblotting and expressed as percentage of control levels. Data are means ± SE of 4 independent experiments consisting of 3 replicate samples per experiment. * P< 0.05 versus the control value.
Effects of EtOH on mTORC2 activity
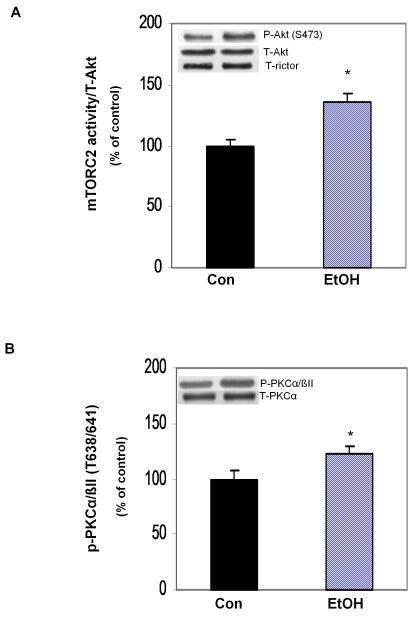
Decreased association of rictor with 14-3-3 and Deptor may act to increase mTORC2 activity toward Akt. Therefore, an in vitro kinase assay was performed where rictor was precipitated from EtOH-treated and untreated control cells, and the activity of this protein complex was determined using Akt as the substrate. An increase in mTORC2 activity was observed following EtOH exposure, as judged by the ability of rictor to phosphorylate Akt at S473 (Fig. 4A). This increased activity was also verified by Western blotting of cell lysates using an antibody that recognizes the phosphorylation of another mTORC2 substrate PKCα/βII (Fig. 4B). PKCα/βII phosphorylation was increased following exposure of C2C12 cells to EtOH, as compared to control values.
Fig. 4.
EtOH increases rictor in vitro activity toward Akt/PKB. mTORC2 activity was examined using an in vitro kinase assay where Akt was utilized as the substrate. Cells were lysed in 0.3% CHAPS buffer and rictor was immunoprecipitated from 150-250 μg of control or EtOH-treated cell extracts using immunoisolated Akt from untreated cell lysates as a substrate. Reaction mixtures were incubated as described under “Materials and Methods” section. The activity was determined by the ability of rictor to phosphorylate Akt at S473. Results were normalized with immunoprecipitated (IP) rictor and expressed as percentage of control levels (panel A). Panel B, Equal amounts of cell extracts were analyzed via Western blotting using antibodies that recognize either total or phosphorylated PKCα/βII (T638/641). Each bar graph represents mean ± SE of 3 independent experiments consisting of 3 replicate samples per experiment. * P< 0.05 versus the control value.
Role of rictor in the EtOH-induced changes in mTORC1 and mTORC2 signaling
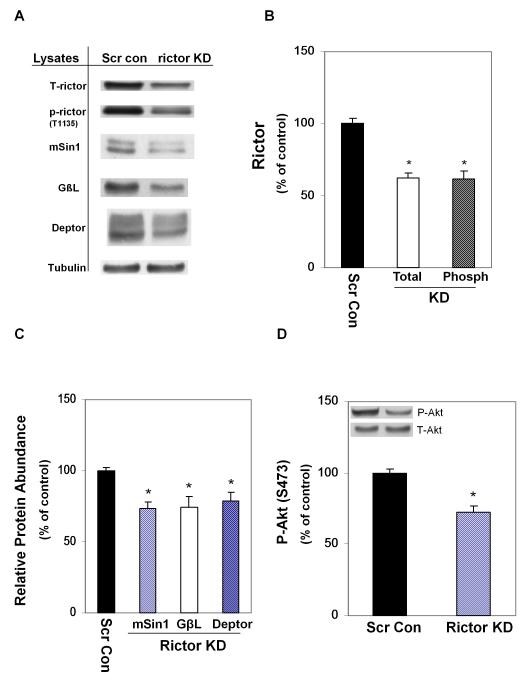
To access the potential role of rictor in regulating EtOH-induced changes in mTORC1 and mTORC2 activity, cells were transfected with rictor shRNA or with scrambled shRNA. Transfection with rictor shRNA caused a ~ 40% decrease in the level of total and phosphorylated rictor (T1135), as compared to cells transfected with scrambled shRNA (Fig. 5 A-B). Likewise, the knockdown of rictor altered other mTORC2 proteins. For example, the protein content of mSin1, GβL and Deptor were all decreased in knockdown cells (Fig. 5C). Finally, rictor KD decreased the phosphorylation of the mTORC2 downstream target Akt at S473 independent of a change in total Akt (Fig. 5D).
Fig. 5.
Effect of rictor knockdown on mTORC2 components and Akt. C2C12 myoblasts were transfected with scrambled shRNA or a rictor specific shRNA. Equal amounts of protein lysates from scrambled control and rictor knockdown cells were analyzed via Western blots using antibodies against T1135 phosphorylated (p)-rictor, total rictor, mSin1, GβL and Deptor (panel A). Quantified data were plotted on a bar graph (panel B-C). Panel D: cell extracts were analyzed using antibodies that recognize total and p-Akt (S473). Results were normalized to total cell protein and expressed as a percentage of scrambled control levels. Each bar graph represents mean ± SE of 4 independent experiments consisting of 3-4 replicate samples per experiment. * P< 0.05 versus the scrambled control value.
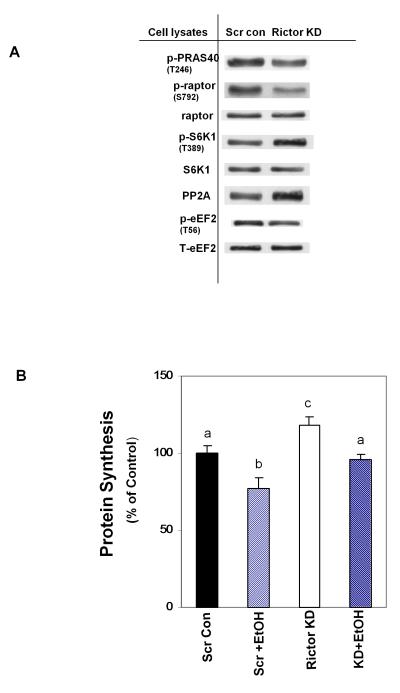
We previously reported that EtOH decreases mTORC1 activity and protein synthesis, while concurrently increasing the phosphorylation of Akt and its downstream target PRAS40 (Hong-Brown et al., 2010). The decreased mTORC1 activity appears to be mediated, at least in part, due to decreased S6K1 phosphorylation and the upregulation of AMPK activity. AMPK phosphorylates raptor and eukaryotic elongation factor (eEF) 2, thereby contributing to the suppression of protein synthesis (Hong-Brown et al., 2007; Hong-Brown et al., 2010). Here, we examined whether the suppression of mTORC2 activity would have the opposite effect on these parameters. Fig. 6A shows that knockdown of rictor decreased levels of p-PRAS40 (T246) and p-raptor (S792). In contrast, there was an increased level of p-S6K1 (T389). Rictor knockdown also increased PP2A activity along with a concurrent decrease in eEF2 phosphorylation. These data indicate that mTORC2 affects mTORC1 by regulating the phosphorylation status of components of the mTORC1 signaling cascade.
Fig. 6.
Rictor knockdown increases mTORC1 activity and protein synthesis. Cell extracts from scrambled control or rictor knockdown myoblasts were analyzed via Western blotting using antibodies that recognize total or p-PRAS40 (T246), p-raptor (S792), p-S6K1(T389), PP2A and p-eEF2 (T56) (panel A). Panel B: scrambled control or rictor knockdown myoblasts were labeled with 35S-methionine/cysteine in the presence of absence of EtOH for 18-24 h. Cells were then collected, and the amount of TCA-precipitable radioactivity was determined as described in “Materials and Methods.” Results are expressed as a percentage of scrambled control levels. Each bar graph represents the mean ± SE of 4 independent experiments consisting of 3 replicate samples per experiment. Groups with different letters are significantly different from one another, (* P< 0.05). Groups with the same letters are not significantly different.
Based on the above results, it appears that EtOH and rictor knockdown affect the signaling components regulating protein synthesis in the opposite manner. Therefore, we examined protein synthesis in rictor KD myoblasts in the presence or absence of EtOH (Fig. 6B). Rictor KD increased protein synthesis ~20% as compared to cells transfected with scrambled shRNA. In contrast, EtOH exposure decreased protein synthesis in cells that were transfected with the scrambled control vector. However, when rictor knockdown cells were incubated with EtOH, the inhibitory effect of EtOH on protein synthesis was partially ameliorated. These data suggest that EtOH may exert some effect on protein synthesis via the action of mTORC2.
DISCUSSION
mTORC2, like mTORC1, plays a role in a number of important physiological processes including cell growth and metabolism. At present, however, the exact function of this complex is poorly defined. Recent data suggest a connection between the actions of mTORC1 and mTORC2 (Bhaskar and Hay, 2007; Foster and Fingar, 2010). Along these lines, we found that EtOH increases the phosphorylation of the mTORC2 target Akt, concurrent with its negative effects on mTORC1 composition and activity (Hong-Brown et al., 2010). Thus, these observations suggest a possible homeostatic connection between mTORC1 and mTORC2 following EtOH exposure.
In this study, EtOH exposure increased mTORC2 activity, and this was associated with elevated rictor content and/or the binding of rictor with mTOR. This result is in agreement with published data where over-expression of rictor led to increased mTORC2 assembly and activity (Masri et al., 2007). Interestingly, we observed a decline in the phosphorylation of rictor at T1135 following EtOH exposure. Although the mechanism responsible for this change was not established, recent studies demonstrated that rictor can be directly phosphorylated by S6K1 in response to growth factors (Dibble et al., 2009; Julien et al., 2010; Treins et al., 2010). As noted previously, this action occurs as part of a distinct negative feedback loop that suppresses Akt S473 phosphorylation (Foster and Fingar, 2010). Since EtOH attenuates S6K1 phosphorylation (Hong-Brown et al., 2006), it is possible that this drug mediates rictor phosphorylation via its effect on S6K1. Thus, the decreases in mTORC1 activity following EtOH exposure may signal for increased mTORC2 activity, in essence acting as a positive feedback loop.
Recent studies indicate that rictor phosphorylation at T1135 is not essential for mTORC2 assembly and activity (Boulbes et al., 2010; Julien et al., 2010; Treins et al., 2010). However, increased phosphorylation of rictor by insulin is correlated with an increased binding of this protein to 14-3-3. Since 14-3-3 can affect the catalytic activity of proteins, or disrupt existing protein-protein interactions (Bridges and Moorhead, 2005; Yaffe, 2002), this interaction is thought to dampen the ability of mTORC2 to phosphorylate Akt (Dibble et al., 2009). Along these lines, we previously reported an increased binding of 14-3-3 with raptor following EtOH treatment, and this was associated with decreased mTORC1 activity (Hong-Brown et al., 2010). In the present study, the decrease in rictor phosphorylation was correlated with a decreased interaction of rictor with 14-3-3. Hence, our data suggest that elevated protein content, modified affinities of mTORC2 components and/or decreased interaction with 14-3-3 may play an important role in enhancing mTORC2 activity in response to EtOH.
The importance of mTORC2 in regulating the effects of EtOH was further demonstrated by performing rictor knockdown experiments. Rictor knockdown impaired the overall function of mTORC2. Interestingly, the knockdown of rictor decreased protein levels of the other known mTORC2 components. This result is consistent with a decrease in mSin1 observed for rictor knockdown in HeLa and HEK293 cells (Yang et al., 2006). In myoblasts, rictor knockdown also altered the composition and activity of mTORC1, revealing a further connection between these two complexes. As noted previously (Das et al., 2008), mTORC1 activity was upregulated following rictor knockdown, as indicated by increased S6K1 phosphorylation and protein synthesis. There are several alternative explanations for this increased protein synthesis. First, this could indicate a role for mTORC2 as an inhibitor of mTORC1. As such, decreases in mTORC2 activity would increase mTORC1 activity. Arguing against this possibility is the observation that EtOH increases mTORC2 activity, while concurrently stimulating Akt phosphorylation. This increased Akt phosphorylation should act to enhance, rather than inhibit the activity of mTORC1. On the other hand, mTORC2 could act as a competitive inhibitor of mTORC1, since these two complexes share many of the same components. In this case, rictor knockdown would have the overall effect of reducing competition for mTOR binding, thereby allowing for an increase in the raptor-mTOR complex (Das et al., 2008).
In conclusion, our results indicate that EtOH increases the protein and mRNA levels of mTORC2 components, while also increasing the interaction of these proteins with mTOR. In contrast, there were decreases in the phosphorylation and association of rictor with 14-3-3 and Deptor. These changes may account for the increased in vitro mTORC2 activity toward Akt at S473. Knockdown of rictor altered the phosphorylation status of various mTORC1 components and increased mTORC1 activity. This resulted in increased p-S6K1 and decreased p-eEF2 levels, as well as increased protein synthesis. Taken together, these data confirm and extend our knowledge of the regulatory link connecting the two mTOR complexes. EtOH decreases mTORC1 activity, and this may stimulate a positive feed-back mechanism, thereby activating mTORC2. Thus, we have identified a condition in which mTORC2 may act as a physiological counterbalance to the negative effect of EtOH on mTORC1.
ACKNOWLEDGEMENTS
We thank Mr. Abid A. Kazi and Dr. Robert A Frost for technical assistance. This study was supported by National Institute of Health Grant AA11209.
REFERENCES
- Bhaskar PT, Hay N. The two TORCs and Akt. Dev Cell. 2007;12(4):487–502. doi: 10.1016/j.devcel.2007.03.020. [DOI] [PubMed] [Google Scholar]
- Boulbes D, Chen CH, Shaikenov T, Agarwal NK, Peterson TR, Addona TA, Keshishian H, Carr SA, Magnuson MA, Sabatini DM, Sarbassov DD. Rictor phosphorylation on the Thr-1135 site does not require mammalian target of rapamycin complex 2. Mol Cancer Res. 2010;8(6):896–906. doi: 10.1158/1541-7786.MCR-09-0409. [DOI] [PMC free article] [PubMed] [Google Scholar]
- Bridges D, Moorhead GB. 14-3-3 proteins: a number of functions for a numbered protein. Sci STKE. 2005;2005(296):re10. doi: 10.1126/stke.2962005re10. [DOI] [PubMed] [Google Scholar]
- Cybulski N, Polak P, Auwerx J, Ruegg MA, Hall MN. mTOR complex 2 in adipose tissue negatively controls whole-body growth. Proc Natl Acad Sci U S A. 2009;106(24):9902–7. doi: 10.1073/pnas.0811321106. [DOI] [PMC free article] [PubMed] [Google Scholar]
- Das F, Ghosh-Choudhury N, Mahimainathan L, Venkatesan B, Feliers D, Riley DJ, Kasinath BS, Choudhury GG. Raptor-rictor axis in TGFbeta-induced protein synthesis. Cell Signal. 2008;20(2):409–23. doi: 10.1016/j.cellsig.2007.10.027. [DOI] [PubMed] [Google Scholar]
- Dibble CC, Asara JM, Manning BD. Characterization of Rictor phosphorylation sites reveals direct regulation of mTOR complex 2 by S6K1. Mol Cell Biol. 2009;29(21):5657–70. doi: 10.1128/MCB.00735-09. [DOI] [PMC free article] [PubMed] [Google Scholar]
- Dunlop EA, Tee AR. Mammalian target of rapamycin complex 1: signalling inputs, substrates and feedback mechanisms. Cell Signal. 2009;21(6):827–35. doi: 10.1016/j.cellsig.2009.01.012. [DOI] [PubMed] [Google Scholar]
- Facchinetti V, Ouyang W, Wei H, Soto N, Lazorchak A, Gould C, Lowry C, Newton AC, Mao Y, Miao RQ, Sessa WC, Qin J, Zhang P, Su B, Jacinto E. The mammalian target of rapamycin complex 2 controls folding and stability of Akt and protein kinase C. Embo J. 2008;27(14):1932–43. doi: 10.1038/emboj.2008.120. [DOI] [PMC free article] [PubMed] [Google Scholar]
- Foster KG, Fingar DC. Mammalian target of rapamycin (mTOR): conducting the cellular signaling symphony. J Biol Chem. 2010;285(19):14071–7. doi: 10.1074/jbc.R109.094003. [DOI] [PMC free article] [PubMed] [Google Scholar]
- Frias MA, Thoreen CC, Jaffe JD, Schroder W, Sculley T, Carr SA, Sabatini DM. mSin1 is necessary for Akt/PKB phosphorylation, and its isoforms define three distinct mTORC2s. Curr Biol. 2006;16(18):1865–70. doi: 10.1016/j.cub.2006.08.001. [DOI] [PubMed] [Google Scholar]
- Guertin DA, Stevens DM, Thoreen CC, Burds AA, Kalaany NY, Moffat J, Brown M, Fitzgerald KJ, Sabatini DM. Ablation in mice of the mTORC components raptor, rictor, or mLST8 reveals that mTORC2 is required for signaling to Akt-FOXO and PKCalpha, but not S6K1. Dev Cell. 2006;11(6):859–71. doi: 10.1016/j.devcel.2006.10.007. [DOI] [PubMed] [Google Scholar]
- Hietakangas V, Cohen SM. TOR complex 2 is needed for cell cycle progression and anchorage-independent growth of MCF7 and PC3 tumor cells. BMC Cancer. 2008;8:282. doi: 10.1186/1471-2407-8-282. [DOI] [PMC free article] [PubMed] [Google Scholar]
- Hong-Brown LQ, Brown CR, Huber DS, Lang CH. Alcohol and indinavir adversely affect protein synthesis and phosphorylation of MAPK and mTOR signaling pathways in C2C12 myocytes. Alcohol Clin Exp Res. 2006;30(8):1297–307. doi: 10.1111/j.1530-0277.2006.00157.x. [DOI] [PubMed] [Google Scholar]
- Hong-Brown LQ, Brown CR, Huber DS, Lang CH. Alcohol regulates eukaryotic elongation factor 2 phosphorylation via an AMP-activated protein kinase-dependent mechanism in C2C12 skeletal myocytes. J Biol Chem. 2007;282(6):3702–12. doi: 10.1074/jbc.M606593200. [DOI] [PubMed] [Google Scholar]
- Hong-Brown LQ, Brown CR, Kazi AA, Huber DS, Pruznak AM, Lang CH. Alcohol and PRAS40 knockdown decrease mTOR activity and protein synthesis via AMPK signaling and changes in mTORC1 interaction. J Cell Biochem. 2010;109(6):1172–84. doi: 10.1002/jcb.22496. [DOI] [PMC free article] [PubMed] [Google Scholar]
- Hresko RC, Mueckler M. mTOR.RICTOR is the Ser473 kinase for Akt/protein kinase B in 3T3-L1 adipocytes. J Biol Chem. 2005;280(49):40406–16. doi: 10.1074/jbc.M508361200. [DOI] [PubMed] [Google Scholar]
- Ikenoue T, Hong S, Inoki K. Monitoring mammalian target of rapamycin (mTOR) activity. Methods Enzymol. 2009;452:165–80. doi: 10.1016/S0076-6879(08)03611-2. [DOI] [PubMed] [Google Scholar]
- Ikenoue T, Inoki K, Yang Q, Zhou X, Guan KL. Essential function of TORC2 in PKC and Akt turn motif phosphorylation, maturation and signalling. Embo J. 2008;27(14):1919–31. doi: 10.1038/emboj.2008.119. [DOI] [PMC free article] [PubMed] [Google Scholar]
- Inoki K, Li Y, Zhu T, Wu J, Guan KL. TSC2 is phosphorylated and inhibited by Akt and suppresses mTOR signalling. Nat Cell Biol. 2002;4(9):648–57. doi: 10.1038/ncb839. [DOI] [PubMed] [Google Scholar]
- Jacinto E, Facchinetti V, Liu D, Soto N, Wei S, Jung SY, Huang Q, Qin J, Su B. SIN1/MIP1 maintains rictor-mTOR complex integrity and regulates Akt phosphorylation and substrate specificity. Cell. 2006;127(1):125–37. doi: 10.1016/j.cell.2006.08.033. [DOI] [PubMed] [Google Scholar]
- Julien LA, Carriere A, Moreau J, Roux PP. mTORC1-activated S6K1 phosphorylates Rictor on threonine 1135 and regulates mTORC2 signaling. Mol Cell Biol. 2010;30(4):908–21. doi: 10.1128/MCB.00601-09. [DOI] [PMC free article] [PubMed] [Google Scholar]
- Kumar A, Harris TE, Keller SR, Choi KM, Magnuson MA, Lawrence JC., Jr. Muscle-specific deletion of rictor impairs insulin-stimulated glucose transport and enhances Basal glycogen synthase activity. Mol Cell Biol. 2008;28(1):61–70. doi: 10.1128/MCB.01405-07. [DOI] [PMC free article] [PubMed] [Google Scholar]
- Kumar A, Lawrence JC, Jr., Jung DY, Ko HJ, Keller SR, Kim JK, Magnuson MA, Harris TE. Fat cell-specific ablation of rictor in mice impairs insulin-regulated fat cell and whole-body glucose and lipid metabolism. Diabetes. 2010;59(6):1397–406. doi: 10.2337/db09-1061. [DOI] [PMC free article] [PubMed] [Google Scholar]
- Loewith R, Jacinto E, Wullschleger S, Lorberg A, Crespo JL, Bonenfant D, Oppliger W, Jenoe P, Hall MN. Two TOR complexes, only one of which is rapamycin sensitive, have distinct roles in cell growth control. Mol Cell. 2002;10(3):457–68. doi: 10.1016/s1097-2765(02)00636-6. [DOI] [PubMed] [Google Scholar]
- Masri J, Bernath A, Martin J, Jo OD, Vartanian R, Funk A, Gera J. mTORC2 activity is elevated in gliomas and promotes growth and cell motility via overexpression of rictor. Cancer Res. 2007;67(24):11712–20. doi: 10.1158/0008-5472.CAN-07-2223. [DOI] [PubMed] [Google Scholar]
- Pearce LR, Huang X, Boudeau J, Pawlowski R, Wullschleger S, Deak M, Ibrahim AF, Gourlay R, Magnuson MA, Alessi DR. Identification of Protor as a novel Rictor-binding component of mTOR complex-2. Biochem J. 2007;405(3):513–22. doi: 10.1042/BJ20070540. [DOI] [PMC free article] [PubMed] [Google Scholar]
- Peterson TR, Laplante M, Thoreen CC, Sancak Y, Kang SA, Kuehl WM, Gray NS, Sabatini DM. DEPTOR is an mTOR inhibitor frequently overexpressed in multiple myeloma cells and required for their survival. Cell. 2009;137(5):873–86. doi: 10.1016/j.cell.2009.03.046. [DOI] [PMC free article] [PubMed] [Google Scholar]
- Rosner M, Fuchs C, Siegel N, Valli A, Hengstschlager M. Functional interaction of mammalian target of rapamycin complexes in regulating mammalian cell size and cell cycle. Hum Mol Genet. 2009;18(17):3298–310. doi: 10.1093/hmg/ddp271. [DOI] [PMC free article] [PubMed] [Google Scholar]
- Sancak Y, Thoreen CC, Peterson TR, Lindquist RA, Kang SA, Spooner E, Carr SA, Sabatini DM. PRAS40 is an insulin-regulated inhibitor of the mTORC1 protein kinase. Mol Cell. 2007;25(6):903–15. doi: 10.1016/j.molcel.2007.03.003. [DOI] [PubMed] [Google Scholar]
- Sarbassov DD, Ali SM, Kim DH, Guertin DA, Latek RR, Erdjument-Bromage H, Tempst P, Sabatini DM. Rictor, a novel binding partner of mTOR, defines a rapamycin-insensitive and raptor-independent pathway that regulates the cytoskeleton. Curr Biol. 2004;14(14):1296–302. doi: 10.1016/j.cub.2004.06.054. [DOI] [PubMed] [Google Scholar]
- Sarbassov DD, Ali SM, Sabatini DM. Growing roles for the mTOR pathway. Curr Opin Cell Biol. 2005;17(6):596–603. doi: 10.1016/j.ceb.2005.09.009. [DOI] [PubMed] [Google Scholar]
- Sarbassov DD, Guertin DA, Ali SM, Sabatini DM. Phosphorylation and regulation of Akt/PKB by the rictor-mTOR complex. Science. 2005;307(5712):1098–101. doi: 10.1126/science.1106148. [DOI] [PubMed] [Google Scholar]
- Treins C, Warne PH, Magnuson MA, Pende M, Downward J. Rictor is a novel target of p70 S6 kinase-1. Oncogene. 2010;29(7):1003–16. doi: 10.1038/onc.2009.401. [DOI] [PubMed] [Google Scholar]
- Woo SY, Kim DH, Jun CB, Kim YM, Haar EV, Lee SI, Hegg JW, Bandhakavi S, Griffin TJ, Kim DH. PRR5, a novel component of mTOR complex 2, regulates platelet-derived growth factor receptor beta expression and signaling. J Biol Chem. 2007;282(35):25604–12. doi: 10.1074/jbc.M704343200. [DOI] [PubMed] [Google Scholar]
- Wullschleger S, Loewith R, Hall MN. TOR signaling in growth and metabolism. Cell. 2006;124(3):471–84. doi: 10.1016/j.cell.2006.01.016. [DOI] [PubMed] [Google Scholar]
- Yaffe MB. How do 14-3-3 proteins work?- Gatekeeper phosphorylation and the molecular anvil hypothesis. FEBS Lett. 2002;513(1):53–7. doi: 10.1016/s0014-5793(01)03288-4. [DOI] [PubMed] [Google Scholar]
- Yang Q, Inoki K, Ikenoue T, Guan KL. Identification of Sin1 as an essential TORC2 component required for complex formation and kinase activity. Genes Dev. 2006;20(20):2820–32. doi: 10.1101/gad.1461206. [DOI] [PMC free article] [PubMed] [Google Scholar]


