Summary
Ca2+ signals regulate polarization, speed as well as turning of migrating cells [1–4]. However, the molecular mechanism by which Ca2+ acts on moving cells is not understood. Here we show that local Ca2+ pulses along the front of migrating human endothelial cells trigger cycles of retraction of local lamellipodia and, concomitantly, strengthen local adhesion to the extracellular matrix. These Ca2+ release pulses had small amplitudes and diameters and were triggered repetitively near the leading plasma membrane with only little coordination between different regions. We show that each Ca2+ pulse triggers contraction of actin filaments by activating myosin light chain kinase and myosin II behind the leading edge. The cyclic force generated by myosin II operates locally, causing a partial retraction of the nearby protruding lamellipodia membrane and a strengthening of paxillin-based focal adhesion within the same lamellipodia [5–7]. Photo-release of Ca2+ demonstrated a direct role of Ca2+ in triggering local retraction and adhesion. Together, our study suggests that spatial sensing, forward movement, turning and chemotaxis is in part controlled by confined Ca2+ pulses that promote local lamellipodia retraction and adhesion cycles along the leading edge of moving cells.
Results and Discussion
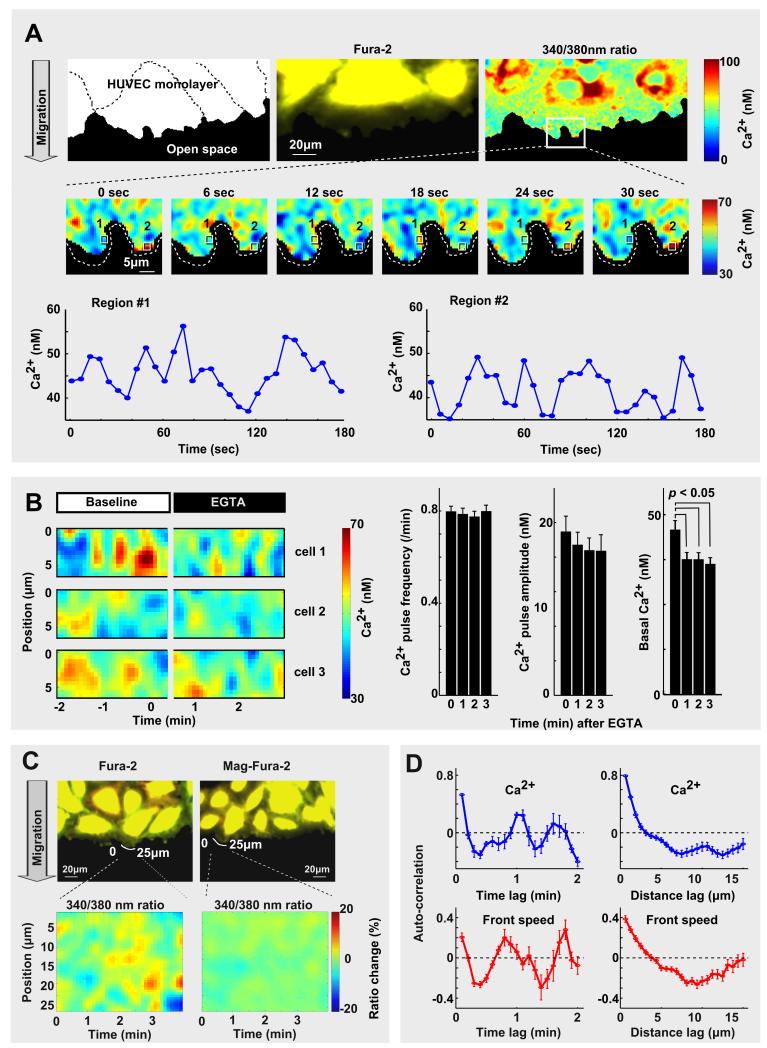
We investigated the role of Ca2+ signals in cell migration using a wound-healing model of human umbilical vein endothelial cells (HUVEC). Ca2+ signals in these cells primarily result from receptor-mediated activation of phospholipase C and InsP3-mediated Ca2+ release [8, 9]. A band of cells in a confluent monolayer was removed with a Delrin tip (Figure S1A-S1C)[10], allowing leader cells at the monolayer border to migrate into the open space by protruding local lamellipodia along their front (Figure 1A). Using the ratio Ca2+ indicator Fura-2, we observed local Ca2+ pulses within and near these lamellipodia (Figure 1A). Peak concentrations remained typically below 80 nM, much lower than the 300 nM to μM amplitudes of cell-wide Ca2+ oscillations triggered by histamine stimulation [8]. Consistent with local Ca2+ signals resulting from pulsed local Ca2+ release through endoplasmic reticulum localized InsP3 receptors [11, 12], removing external Ca2+ by addition of the Ca2+ chelator EGTA alone did not stop Ca2+ pulses for several minutes (Figure 1B). Given the small amplitudes of the Ca2+ pulses, we did a number of control experiments to exclude motion and other artifacts. A contour line scan analysis showed that local intensity changes were not observed when we used a fluorophore similar to Fura-2 that does not change its ratio-intensity for small Ca2+ changes (Mag-Fura-2) (Figure 1C), or when Ca2+ influx and release were blocked by addition of the Ca2+ chelator EGTA and the Ca2+ pump inhibitor thapsigargin (Figure S1D).
Figure 1. Identification of Ca2+ release pulses and local lamellipodia protrusion-retraction cycles at the leading edge of migrating endothelial cells.
(A) Local Ca2+ pulses close to the front of migrating HUVEC cells. Time series analysis showing ratio-images of the Ca2+ indicator Fura-2. Note the temporal changes of local Ca2+ in the marked regions. (B) Ca2+ pulses are primarily a result of Ca2+ release from internal Ca2+ stores. (left) Ca2+ pulses continued after external Ca2+ was removed by adding the chelator EGTA. (right) Bar graphs of frequency, amplitude, and basal level of Ca2+, before and after 2mM EGTA addition (N = 24). (C) Control experiment excludes motion artifacts in the Ca2+ measurements. Ratio-images of Mag-Fura-2 did not show the same intensity changes (Mag-Fura-2 does not change its intensity for small Ca2+ changes). (D) Example of a single cell spatial and temporal auto-correlation analysis of Ca2+ pulses (upper panel) and leading edge speed (lower panel). Data are mean ± standard error of the mean (s.e.).
High-frequency live-cell imaging (every 300 ms) with statistical analysis showed that Ca2+ pulses were triggered stochastically along the front with the median amplitude of 12 nM above basal Ca2+ level, duration of 17 seconds and diameter of 3.8 μm (auto-correlation analysis in Figure 1D and Figure S1E). Pulses at the same location were suppressed for a variable time period with the median interval between pulses of 63 sec. All parameters showed significant variability (Table S1).
Repetitive local protrusions of lamellipodia have been previously observed as cells move forward, get traction and turn [13–15]]. The space and time constants of Ca2+ pulses were similar to the space and time constants of these reported protrusions and also similar to protrusions we observed in HUVEC (Figure 1D)[5, 6, 14, 16]. Temporal and spatial auto-correlation analysis showed that HUVEC protrusions had a median repetition time of 67 sec and diameter of 5.7 μm. Protrusions were 25% longer than retractions, explaining how cells can move forward despite the cyclic retractions (Figure S1F-S1H). Compared to the median length of the leading edge as 53 μm, the much smaller distance of 5.7 μm over which protrusions were correlated argued that local lamellipodia along the leading edge are triggered independently of each other (Table S2 for a detailed statistical analysis of lamellipodia).
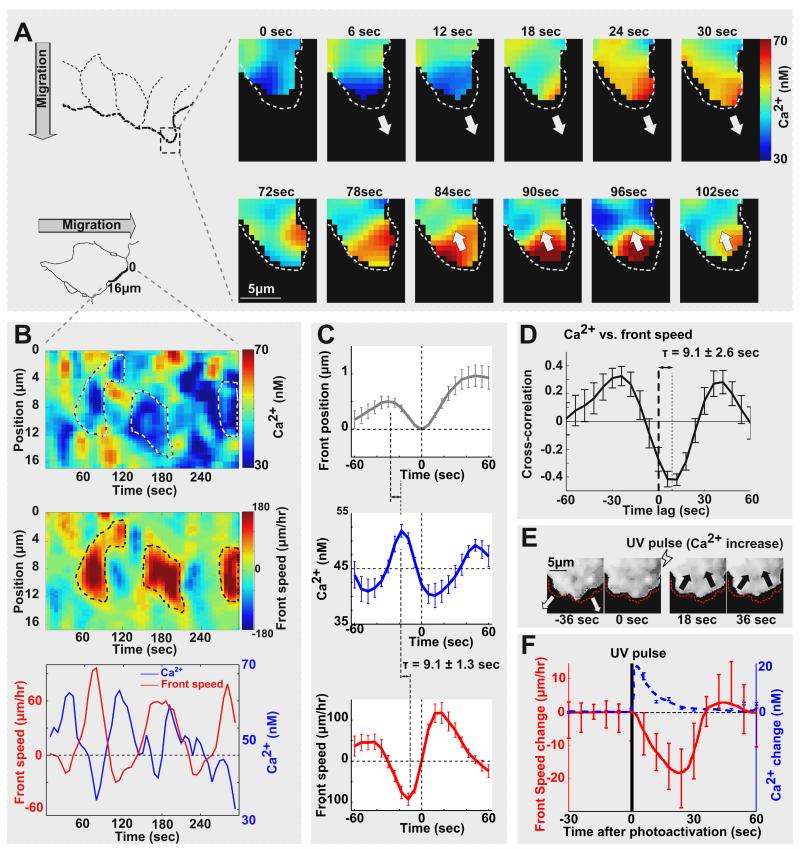
Strikingly, a direct comparison between local Ca2+ signals and lamellipodia membrane location and speed showed that Ca2+ levels were higher when local lamellipodia were retracting and lower when they were protruding (Figure 2A & 2B). An averaged time sequence analysis was performed by aligning time-courses from different cells and locations using the local maximal retraction as the origin. This event time sequence analysis (Figure 2C) showed that the peak of the Ca2+ pulse occurred on average 9.1 ± 1.3 sec (mean ± standard error of the mean [s.e.]) before the maximal retraction speed (Table S3 for statistical data). This was followed by the maximal retraction and then a switch to forward protrusion with the highest forward protrusion speed corresponding to the lowest Ca2+ level. The subsequent increase in Ca2+ marked again the conversion from protrusion to retraction, closing the protrusion-retraction cycle. An independent cross-correlation analysis gave a similar delay time between local Ca2+ and speed (mean ± s.e., Figure 2D & Figure S2B).
Figure 2. Local Ca2+ pulses trigger local retraction of protruding lamellipodia.
(A) Panels showing a segment of a leading edge with a protruding and retracting local lamellipodia. Ca2+ pulses correlated with the retraction phase. (B) The same correlation between Ca2+ pulses and retraction speed is observed in a color-coded contour line scan analysis along a leading edge segment. Positive speed reflects membrane protrusion, negative speed retraction. (C) Event time sequence analysis comparing local Ca2+ concentration, leading edge position and membrane protrusion speed. Time courses were anchored at the origin using the time point where local lamellipodia were maximally retracted (N = 20). (D) Cross-correlation analysis showing a 9.1 second delay between Ca2+ and retraction speed (N = 16). (E and F) Intracellular photo-release using NP-EGTA and a UV light flash induced a 17 nM average Ca2+ increase similar to the native Ca2+ pulses. These small Ca2+ pulses triggered rapid synchronous retraction of lamellipodia. (E) Series of images of lamellipodia before and after UV pulse. (F) Averaged front speed change after the UV pulse (N = 10). Error bars are mean ± s.e.
When we separated protrusion and retraction events, the cross-correlation analysis revealed that high Ca2+ correlated much more strongly with retraction than low Ca2+ with protrusion (Figure S3A), consistent with the hypothesis that local Ca2+ pulses control primarily retraction. Therefore, we directly determined whether Ca2+ pulses trigger front retraction by UV-induced Ca2+ photo-release from NP-EGTA, an intracellular chelator of Ca2+. Photoinduced small Ca2+ pulses (amplitude = 17.6 ± 1.8 nM [mean ± s.e.]) were sufficient to trigger rapid transient retraction of lamellipodia along the leading edge (Figure 2E & 2F). Control experiments in cells without NP-EGTA showed no retraction (Figure S2C). In additional control experiments, we suppressed local Ca2+ pulses by preventing Ca2+ release and influx (using thapsigargin and the store-operated Ca2+ channel blocker BTP2) and found a significant reduction in front retraction by ~30% but no effect on protrusion (Figure S2D). Thus, local Ca2+ pulses are sufficient for lamellipodia retraction and the observed Ca2+ pulses mediate a significant part of the physiologically observed retraction. The Ca2+-triggered retraction likely counteracts actin polymerization and lamellipodia protrusion by Rac, CDC42 or other polymerization regulators [14, 16, 17].
As an added note, while cyclic small Ca2+ pulses were frequent in the front of migrating cells, we also observed occasionally global large Ca2+ spikes in HUVEC [8] (Figure S2A). Such cell-wide high amplitude Ca2+ spikes were much less frequent and caused a retraction of similar size as small Ca2+ pulses despite the higher amplitude. This suggested that they do not significantly contribute to the overall regulation of cell migration and likely have other functions, such as a potential regulation of endothelial sheet permeability [18].
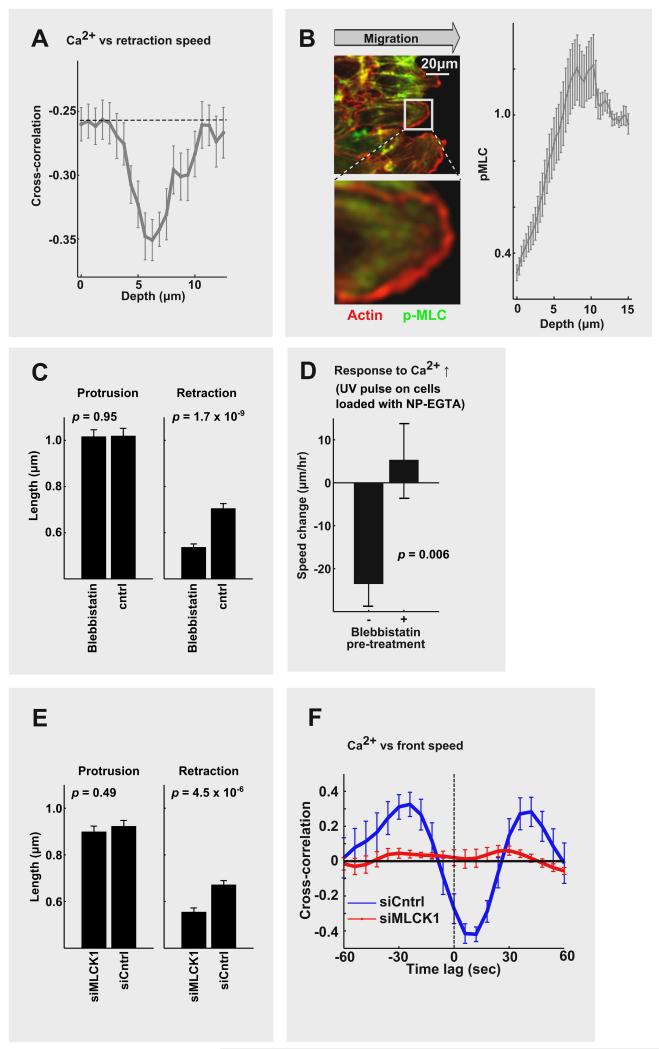
We then investigated where the small Ca2+ pulses act by performing a cross-correlation analysis between the location of the Ca2+ signal and retraction speed. This showed that Ca2+ signals centered 6.6 ± 0.5 μm (mean ± s.e.) behind the front have the highest correlation with lamellipodia retraction (Figure 3A & S3A). We verified that the endoplasmic reticulum (ER), where most intracellular Ca2+ originates from, reaches to this region (Figure S3B & S3C). We also noted that this distance corresponds to a previously described boundary between the lamellipodia and the lamella, a less dynamic actin structure behind the lamellipodia [5, 7].
Figure 3. Lamellipodia retraction is mediated by Ca2+ activation of myosin light chain kinase and myosin II in a region behind the lamellipodia.
(A) Spatial correlation analysis of Ca2+ signals versus front retraction. The highest correlation was in a region 6.7 ± 0.5 μm from the leading edge (N = 22). (B) (left) Images of cells stained with phospho-myosin light chain 2 (Ser19) antibodies, and phalloidin to mark polymerized actin. (right) Active myosin II increased 5-10 μm behind the leading edge (N = 63). pMLC: phospho-myosin light chain 2. (C) Inhibition of myosin II (10 μM blebbistatin) reduced the retraction length but not protrusion of local lamellipodia (N = 29, blebbistatin group; N = 29, control group). (D) UV pulse-mediated small Ca2+ increase failed to change retraction in cells pre-treated with blebbistatin (N = 21, “−” group; N = 19, “+” group) (E) Knockdown of MLCK1 had no significant effect on the average lamellipodia protrusion length, but shortened the average retraction (N = 44, siMLCK1 group; N = 37, siCntrl group.) (F) Near complete loss of the cross-correlation between Ca2+ pulses and lamellipodia retraction in cells with knocked down MLCK1 (N = 6, siMLCK1; N = 16, siCntrl.). Error bars are mean ± s.e.
Since myosin II motors are enriched in lamella and have been shown to regulate lamellipodia retraction [5, 7], we used quantitative immunostaining and showed that the concentration of active myosin light chain (phosphorylated at Ser19) started to increase at an average distance 5 μm behind the leading edge (Figure 3B). Using the myosin II inhibitor blebbistatin, we further showed that lamellipodia retraction was reduced by ~25% after blocking myosin II [19] while lamellipodia protrusion was not affected (Figure 3C; Figure S4). This suggested that even though the Ca2+ pulses are small, they are likely sufficient to activate myosin II and thereby retract local lamellipodia. Indeed, when we used UV-activation of NP-EGTA to create small Ca2+ pulses in cells pretreated with blebbistatin (17.6 ± 1.8 nM above basal), lamellipodia retraction was inhibited (Figure 3D).
To identify a molecular link from Ca2+ to myosin II, we then tested whether these small Ca2+ pulses may activate myosin light chain kinase (MLCK), a Ca2+/calmodulin regulated kinase that activates myosin II and is present in endothelial cells [20]. Indeed, knockdown of MLCK1 by siRNA had no significant effect on lamellipodia protrusion but significantly reduced the mean retraction by ~25% (Figure 3E), phenocopying the blebbistatin myosin II inhibition results. The same retraction phenotype could also be replicated using ML-7, an MLCK inhibitor (Figure S3D). Even more convincingly, a cross-correlation analysis showed a nearly complete loss of correlation between Ca2+ pulses and retraction in MLCK1 knockdown cells (Figure 3F). Local Ca2+ pulses themselves were still triggered in the MLCK1 knockdown cells (Figure S3F). Together, our results show that local Ca2+ release pulses act in a region 5-8 μm behind the leading lamellipodia edge, where they activate MLCK and myosin II, which in turn triggers local actin contraction. As a consequence, each Ca2+ pulse retracts a locally protruding lamellipodia, providing a molecular mechanism for the observed asynchronous local lamellipodia protrusion-retraction cycles along the leading edge of endothelial and possibly other migrating cells.
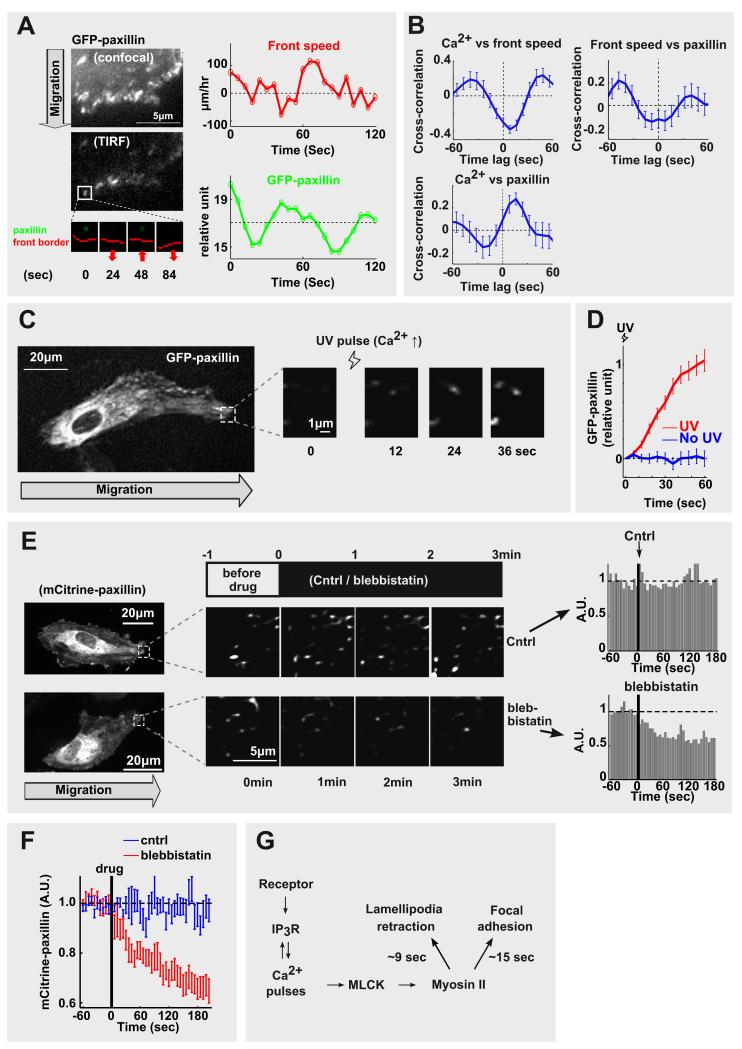
These results left open the question whether Ca2+-triggered local myosin II activation also influences cell adhesion. This is important since protrusion-retraction cycles without new adhesion sites would be a futile enterprise for cell movement. A link from Ca2+ to cell adhesion in the front appeared plausible because mechanical force application to focal adhesion connected actin cables can increase adhesion [6, 21] and lamellipodia retraction has been shown to occur in parallel with more focal adhesion [6]. Markedly, using GFP-paxillin as an early marker for adhesion formation, we found that local Ca2+ pulses precede a transient increase in the intensity of small nascent GFP-paxillin patches in leading lamellipodia. It was surprising to see that these local paxillin patches in the front grow at high local Ca2+ pulses during front retraction but then typically decrease in size at lower Ca2+ during the lamelliopodia protrusion phase (Figure 4A). A statistical analysis showed that the transient maximal local GFP-paxillin intensity was reached 15.7 ± 2.7 sec (mean ± s.e.) after the peak of the local Ca2+ pulse (Figure 4B). To directly determine whether Ca2+ signals enhance adhesion, we again used photo-release of Ca2+ and demonstrated that small increases in Ca2+ triggered rapid increases in local GFP-paxillin intensity in the front (Figure 4C and 4D).
Figure 4. A local cycle of protrusion, retraction and adhesion controlled by local Ca2+ pulses.
(A) Time course analysis comparing the adhesion marker GFP-paxillin to front speed. Note that front retraction corresponds to higher local paxillin puncta intensity. (B) Cross-correlation analysis of Ca2+ versus focal adhesion (GFP-paxillin) and front speed shows that local GFP-paxillin assembly is maximal 15.7 ± 2.7 sec after the Ca2+ pulse (N = 40 adhesion sites from 8 cells). (C&D) UV photo-release of Ca2+ caused a rapid increase of GFP-paxillin intensity in the lamellipodial adhesions (average of 150 adhesion sites from 10 cells). (E&F) Addition of the myosin II inhibitor blebbistatin caused rapid disassembly of nascent adhesions along the leading edge (N = 18, blebbistatin group; N = 16, control group.). (G) Schematics of the Ca2+ pulse-driven local lamellipodia retraction-adhesion cycle. Error bars are mean ± s.e.
Control experiments showed that inactivation of myosin II using blebbistatin [19] led to a rapid disassembly of the local paxillin patches (Figure 4E and 4F; mCitrine tags and low light levels were used to minimize photodamage). This confirmed that nascent adhesion sites in the front are rapidly reversible if myosin II activity is transiently lowered. Thus, each local Ca2+ pulse can grow the size of nascent paxillin adhesion sites by transient activation of myosin II and the same sites can then partially disassemble between Ca2+ pulses when myosin II activity is lower. Together, these results argue that local Ca2+ pulses create a local force field by MLCK and myosin II-mediated actin contraction, which in turn transiently strengthens mechanically connected adhesion sites within the nearby lamellipodia. This creates a Ca2+-driven local adhesion cycle in the front that acts in synchrony with the local lamellipodia retraction cycle.
Our study introduces a local Ca2+ driven lamellipodia retraction and adhesion circuit that dynamically shapes the leading edge of migrating cells (Figure 4G). Together with the previous evidence that Ca2+ signals regulate polarization [1, 2] and turning [3, 4], our study suggests that local Ca2+ pulses have two primary functions: The first role is to create stochastic cyclic protrusions of local lamellipodia along the front that facilitates sensing of external cues. The second role is to promote forward migration and turning by strengthening local adhesion either symmetrically along the front or selectively on the left or right. Previous studies have shown that small turns created by biased local protrusion and adhesion generates a biased random walk that explains observed chemotaxis behaviors [14, 15, 22, 23]. This suggested that local receptor signaling mechanisms may control these local protrusion, retraction and adhesion events. Our study suggests that local Ca2+ pulses, if generated by local receptor signals [8], can serve as one such local signaling mechanism that regulates speed, spatial sensing, turning and chemotaxis of migrating cells by triggering local lamellipodia retraction and adhesion.
Supplementary Material
Highlights.
Periodic local Ca2+ pulses at the front induce local lamellipodia retraction and focal adhesion.
Ca2+ mediates retraction and adhesion by activation of myosin light chain kinase and myosin II.
The local Ca2+ control circuit regulates spatial sensing, forward movement and turning of migrating cells.
Acknowledgments
We thank Drs. Collins, Galic, Hayer, and Wollman for technical support and discussions. The research was supported by TMS, SGF (FT) and NIGMS (TM)
Footnotes
Publisher's Disclaimer: This is a PDF file of an unedited manuscript that has been accepted for publication. As a service to our customers we are providing this early version of the manuscript. The manuscript will undergo copyediting, typesetting, and review of the resulting proof before it is published in its final citable form. Please note that during the production process errors may be discovered which could affect the content, and all legal disclaimers that apply to the journal pertain.
References
- 1.Brundage RA, Fogarty KE, Tuft RA, Fay FS. Calcium gradients underlying polarization and chemotaxis of eosinophils. Science. 1991;254:703–706. doi: 10.1126/science.1948048. [DOI] [PubMed] [Google Scholar]
- 2.Evans JH, Falke JJ. Ca2+ influx is an essential component of the positive-feedback loop that maintains leading-edge structure and activity in macrophages. Proc. Natl. Acad. Sci. U.S.A. 2007;104:16176–16181. doi: 10.1073/pnas.0707719104. [DOI] [PMC free article] [PubMed] [Google Scholar]
- 3.Hong K, Nishiyama M, Henley J, Tessier-Lavigne M, Poo M. Calcium signalling in the guidance of nerve growth by netrin-1. Nature. 2000;403:93–98. doi: 10.1038/47507. [DOI] [PubMed] [Google Scholar]
- 4.Wei C, Wang X, Chen M, Ouyang K, Song L-S, Cheng H. Calcium flickers steer cell migration. Nature. 2009;457:901–905. doi: 10.1038/nature07577. [DOI] [PMC free article] [PubMed] [Google Scholar]
- 5.Giannone G, Dubin-Thaler BJ, Döbereiner H-G, Kieffer N, Bresnick AR, Sheetz MP. Periodic lamellipodial contractions correlate with rearward actin waves. Cell. 2004;116:431–443. doi: 10.1016/s0092-8674(04)00058-3. [DOI] [PubMed] [Google Scholar]
- 6.Giannone G, Dubin-Thaler BJ, Rossier O, Cai Y, Chaga O, Jiang G, Beaver W, Döbereiner H-G, Freund Y, Borisy G, et al. Lamellipodial actin mechanically links myosin activity with adhesion-site formation. Cell. 2007;128:561–575. doi: 10.1016/j.cell.2006.12.039. [DOI] [PMC free article] [PubMed] [Google Scholar]
- 7.Burnette DT, Manley S, Sengupta P, Sougrat R, Davidson MW, Kachar B, Lippincott-Schwartz J. A role for actin arcs in the leading-edge advance of migrating cells. Nat. Cell Biol. 2011;13:371–381. doi: 10.1038/ncb2205. [DOI] [PMC free article] [PubMed] [Google Scholar]
- 8.Jacob R, Merritt JE, Hallam TJ, Rink TJ. Repetitive spikes in cytoplasmic calcium evoked by histamine in human endothelial cells. Nature. 1988;335:40–45. doi: 10.1038/335040a0. [DOI] [PubMed] [Google Scholar]
- 9.Moccia F, Berra-Romani R, Tritto S, Signorelli S, Taglietti V, Tanzi F. Epidermal growth factor induces intracellular Ca2+ oscillations in microvascular endothelial cells. J. Cell. Physiol. 2003;194:139–150. doi: 10.1002/jcp.10198. [DOI] [PubMed] [Google Scholar]
- 10.Vitorino P, Meyer T. Modular control of endothelial sheet migration. Genes Dev. 2008;22:3268–3281. doi: 10.1101/gad.1725808. [DOI] [PMC free article] [PubMed] [Google Scholar]
- 11.Horne JH, Meyer T. Elementary calcium-release units induced by inositol trisphosphate. Science. 1997;276:1690–1693. doi: 10.1126/science.276.5319.1690. [DOI] [PubMed] [Google Scholar]
- 12.Berridge MJ. Calcium microdomains: organization and function. Cell Calcium. 2006;40:405–412. doi: 10.1016/j.ceca.2006.09.002. [DOI] [PubMed] [Google Scholar]
- 13.Ridley AJ, Schwartz MA, Burridge K, Firtel RA, Ginsberg MH, Borisy G, Parsons JT, Horwitz AR. Cell migration: integrating signals from front to back. Science. 2003;302:1704–1709. doi: 10.1126/science.1092053. [DOI] [PubMed] [Google Scholar]
- 14.Arrieumerlou C, Meyer T. A local coupling model and compass parameter for eukaryotic chemotaxis. Dev. Cell. 2005;8:215–227. doi: 10.1016/j.devcel.2004.12.007. [DOI] [PubMed] [Google Scholar]
- 15.Iglesias PA, Devreotes PN. Navigating through models of chemotaxis. Curr. Opin. Cell Biol. 2008;20:35–40. doi: 10.1016/j.ceb.2007.11.011. [DOI] [PubMed] [Google Scholar]
- 16.Machacek M, Hodgson L, Welch C, Elliott H, Pertz O, Nalbant P, Abell A, Johnson GL, Hahn KM, Gaudenz Danuser. Coordination of Rho GTPase activities during cell protrusion. Nature. 2009;461:99–103. doi: 10.1038/nature08242. [DOI] [PMC free article] [PubMed] [Google Scholar]
- 17.Melvin AT, Welf ES, Wang Y, Irvine DJ, Haugh JM. In chemotaxing fibroblasts, both high-fidelity and weakly biased cell movements track the localization of PI3K signaling. Biophys. J. 2011;100:1893–1901. doi: 10.1016/j.bpj.2011.02.047. [DOI] [PMC free article] [PubMed] [Google Scholar]
- 18.Tiruppathi C, Ahmmed GU, Vogel SM, Malik AB. Ca2+ signaling, TRP channels, and endothelial permeability. Microcirculation. 2006;13:693–708. doi: 10.1080/10739680600930347. [DOI] [PubMed] [Google Scholar]
- 19.Straight AF, Cheung A, Limouze J, Chen I, Westwood NJ, Sellers JR, Mitchison TJ. Dissecting temporal and spatial control of cytokinesis with a myosin II Inhibitor. Science. 2003;299:1743–1747. doi: 10.1126/science.1081412. [DOI] [PubMed] [Google Scholar]
- 20.Lazar V, Garcia JG. A single human myosin light chain kinase gene (MLCK; MYLK) Genomics. 1999;57:256–267. doi: 10.1006/geno.1999.5774. [DOI] [PubMed] [Google Scholar]
- 21.Balaban NQ, Schwarz US, Riveline D, Goichberg P, Tzur G, Sabanay I, Mahalu D, Safran S, Bershadsky A, Addadi L, et al. Force and focal adhesion assembly: a close relationship studied using elastic micropatterned substrates. Nat. Cell Biol. 2001;3:466–472. doi: 10.1038/35074532. [DOI] [PubMed] [Google Scholar]
- 22.Welf ES, Haugh JM. Signaling pathways that control cell migration: models and analysis. Wiley Interdiscip Rev Syst Biol Med. 2011;3:231–240. doi: 10.1002/wsbm.110. [DOI] [PMC free article] [PubMed] [Google Scholar]
- 23.Neilson MP, Veltman DM, van Haastert PJM, Webb SD, Mackenzie JA, Insall RH. Chemotaxis: a feedback-based computational model robustly predicts multiple aspects of real cell behaviour. PLoS Biol. 2011;9:e1000618. doi: 10.1371/journal.pbio.1000618. [DOI] [PMC free article] [PubMed] [Google Scholar]
Associated Data
This section collects any data citations, data availability statements, or supplementary materials included in this article.


