

Abstract
Combined results of theoretical molecular dynamic simulations and in vitro spectroscopic (circular dichroism and fluorescence) studies are presented, providing the atomistic and secondary structure details of the process by which a selected small molecule may destabilize the β-sheet ordered “amyloid” oligomers formed by the model undecapeptide of amyloid β-peptide 25–35 [Aβ(25–35)]. Aβ(25–35) was chosen because it is the shortest fragment capable of forming large β-sheet fibrils and retaining the toxicity of the full length Aβ(1–40/42) peptides. The conformational transition, that leads to the formation of β-sheet fibrils from soluble unordered structures, was found to depend on the environmental conditions, whereas the presence of myricetin destabilizes the self-assembly and antagonizes this conformational shift. In parallel, we analyzed several molecular dynamics trajectories describing the evolution of five monomer fragments, without inhibitor as well as in the presence of myricetin. Other well-known inhibitors (curcumin and (−)-tetracycline), found to be stronger and weaker Aβ(1–42) aggregation inhibitors, respectively, were also studied. The combined in vitro and theoretical studies of the Aβ(25–35) self-assembly and its inhibition contribute to understanding the mechanism of action of well-known inhibitors and the peptide amino acid residues involved in the interaction leading to a rational drug design of more potent new molecules able to antagonize the self-assembly process.
Keywords: Amyloid β-peptide 25−35, self-aggregation, circular dichroism spectroscopy, ThT fluorescence spectroscopy, myricetin, curcumin, (−)-tetracycline
The amyloid β-peptides Aβ(1–42) and Aβ(1–40) form insoluble aggregates, which have been shown to be associated with Alzheimer’s disease (AD).1,2 Amyloid plaques represent one of the multiple targets to be hit in the context of new drug discovery for the treatment of AD.3 The rational design of multitarget directed ligands (MTDL) offers greater potential for finding prevention and treatment options,4 rather than a one molecule target approach, expecially since Alzhemed, a small molecule designed to target specifically β-amyloid aggregation, failed in clinical trials.5 However, in the context of MTDL discovery, understanding the mechanisms by which small molecules inhibit the amyloidogenic aggregation plays a key role in a successful drug design process.
AD can be classified within a quite numerous group of diseases collectively referred to as amyloidosis, characterized by deposits of amyloid plaques in a variety of organs.2,6 Nearly 20 human diseases associated with the presence of insoluble aggregates of normally soluble proteins, resulting in the formation of extracellular insoluble deposits, have been identified. Under appropriate conditions, the proteins self-assemble, producing regular fibrillary structures with a predominant β-sheet peptide conformation.7−11 The amyloid deposits are the major constituent of the extracellular senile, or neuritic, plaques characteristic of brain tissues affected by AD. The most abundant component of neuritic plaques is a peptide composed of 39–42 amino acid residues referred to as an amyloid β-peptide (Aβ). The Aβ molecules are derived from a type I transmembrane protein containing 695–770 amino acids, known as Aβ precursor protein (APP), by the action of the β- and γ-secretase enzymes. Aβ(1–42), the peptide most prone to aggregation, is produced in large quantities in familial forms of AD.12,13
Although a large consensus exists about the central role of Aβ in AD, the biophysical and biological mechanisms that underlie toxicity are still subjects of debate. Much evidence supports the hypothesis that Aβ fibrillogenesis is a seminal pathogenic event in AD. Recent studies on Aβ support the possibility that nonfibrillary oligomeric species are pathogenic, leading to the hypothesis that the Aβ neurotoxicity is related to different membrane interactions and destabilization processes culminating in membrane pore formation and disruption.14
The conformational behavior of soluble forms of Aβ appears to play a critical role. Although Aβ peptides were identified several years ago, still relatively few structural studies describe the conformation of these molecules in their soluble or aggregated forms. Aβ peptide conformation is critically dependent on environmental conditions and concentration.
Although Aβ(1–42/40) are the predominant Aβ peptides in the senile plaques, other peptides, such as Aβ(25–35), can be present. The shorter Aβ(25–35) peptide (Figure 1) is produced in the brain of aged patients from proteolitic cleavage of soluble racemized Aβ(1–40) peptides.15 Sato et al. have proposed that Aβ(25–35) represents the biologically active region of Aβ because it is the shortest fragment that exhibits large β-sheet aggregated structures and retains the toxicity of the full-length peptide.16 The monomeric form of Aβ(25–35) may be cytotoxic.15 Several reports have also indicated that Aβ(25–35), like Aβ(1–42), undergoes a conformational transition from a soluble, unordered form to aggregated fibrillary β-sheet structures, depending on the environmental conditions.17−19 Accordingly, Aβ(25–35) has often been chosen as a model for full-length Aβ in structural and functional studies. Circular dichroism (CD) spectroscopy has been used to monitor the secondary structure variation of Aβ(25–35) in different environments.20 However, not many detailed CD studies in parallel with thioflavin T (ThT) fluorescence spectroscopy measurements and molecular dynamic simulations have been applied to the Aβ(25–35) inhibitors studies, to identify promising agents that may effectively interfere with the Aβ toxic pathway by preventing the increase of β-sheet rich amyloid peptide structures.
Figure 1.
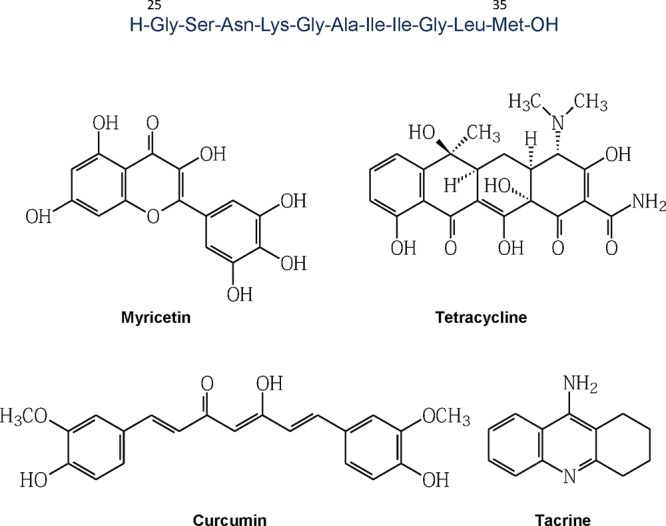
Aβ(25–35) aminoacidic sequence and inhibitors chemical structures.
Following our previous studies on Aβ(1–42) and Aβ(1–40),21−23 we describe here the in vitro conformational analysis by CD and ThT fluorescence spectroscopy of the self-assembly process of Aβ(25–35) in different experimental conditions coupled with molecular dynamics (MD) simulations to characterize the mechanism of action of known Aβ(1–42) inhibitors, with the aim of using this short peptide as a simpler tool to better understand the structural requirements for self-assembly inhibition.
An optical spectroscopy study of the Aβ(25–35) will open the way to understanding the mechanism of action of well-known inhibitors enabling the design and synthesis of more potent molecules able to antagonize the conformational shift of Aβ peptides responsible for the self-assembly process. A detailed description of the conformation transition is a key step for designing aggregation inhibitors. A comparative study of both the fragment Aβ(25–35) and the full peptide Aβ(1–42) will also provide extra information about the inhibitory mechanism.
Results and Discussion
AD therapeutic approaches that target one of the steps in the biogenesis of toxic Aβ species include inhibition of the formation of Aβ peptides, inhibition of aggregation and stimulation of Aβ peptide degradation or clearance.24,25 In particular, inhibition of amyloid aggregation has been highlighted as one of the potential targets for the development of new drugs to treat AD in the frame of MTDL discovery.
We have selected an undecapeptide fragment, Aβ(25–35), from the well-known Aβ(1–40/42) sequences. Aβ(25–35) forms “amyloid” fibrils akin to the longer peptides and maintains the same toxicity; the shorter chain length facilitates the biophysical studies. The combined results of theoretical MD simulations and in vitro approaches (CD and fluorescence spectroscopies) provide the atomistic and secondary structure details of the process by which small molecules destabilize the β-sheet ordered “amyloid” oligomers formed by the model undecapeptide Aβ(25–35).
Aβ(25–35) Self-Assembly: CD Studies
As previously reported for the longer amyloid peptides, Aβ(1–42) and Aβ(1–40),21−23 we have focused our attention on the initial transition of Aβ(25–35) soluble monomers/small oligomers from unordered/α-helix to a β-sheet-rich conformation. This approach provides a model of the monomer/insoluble fibers equilibrium, the key event in the Aβ(25–35) self-assembly pathway and a test-bed to design new potent inhibitors as effective therapeutics for AD.
A major point is where to start. In the process of synthesis, purification (HPLC), and isolation (freeze-drying) as a solid, peptides prone to self-associate may have already started to form fibrils before the in vitro and in vivo studies. Redissolution can give a solution that has “remembered” the last state. In a search for experimental conditions that enable a robust monitoring of the different self-assembly conformational states, CD measurements have been performed using a range of solvents, in particular fluorinated alcohols. Generally fluorinated alcohols stabilize the α-helical conformation of peptides therefore, they are able to solubilize the fibrillar aggregates of Aβ-(1–42/40).26,27
The CD spectra of Aβ(25–35) dissolved in different solvents are illustrated in Figure 2a and b. The precise definition of the unordered state is not trivial and is likely to encompass a range of dynamic states in equilibrium. However, the CD spectrum of the unordered state is generally recognized to be dominated by a negative CD at ∼197 nm approaching zero as the wavelength approaches 185 nm. There should be no positive CD below 185 nm. However, the extended (PII) conformation of peptides often shows these characteristics, although the trend toward a positive CD at ∼215 nm is evidence of PII. The PII conformation of a linear peptide is likely to be the precursor to β-sheet formation. CD below 190 nm is extremely sensitive to the presence of even small amounts of ordered α-helix and β-sheet. The new generative Chirascan CD spectrometer is a good test of these statements.28,29
Figure 2.
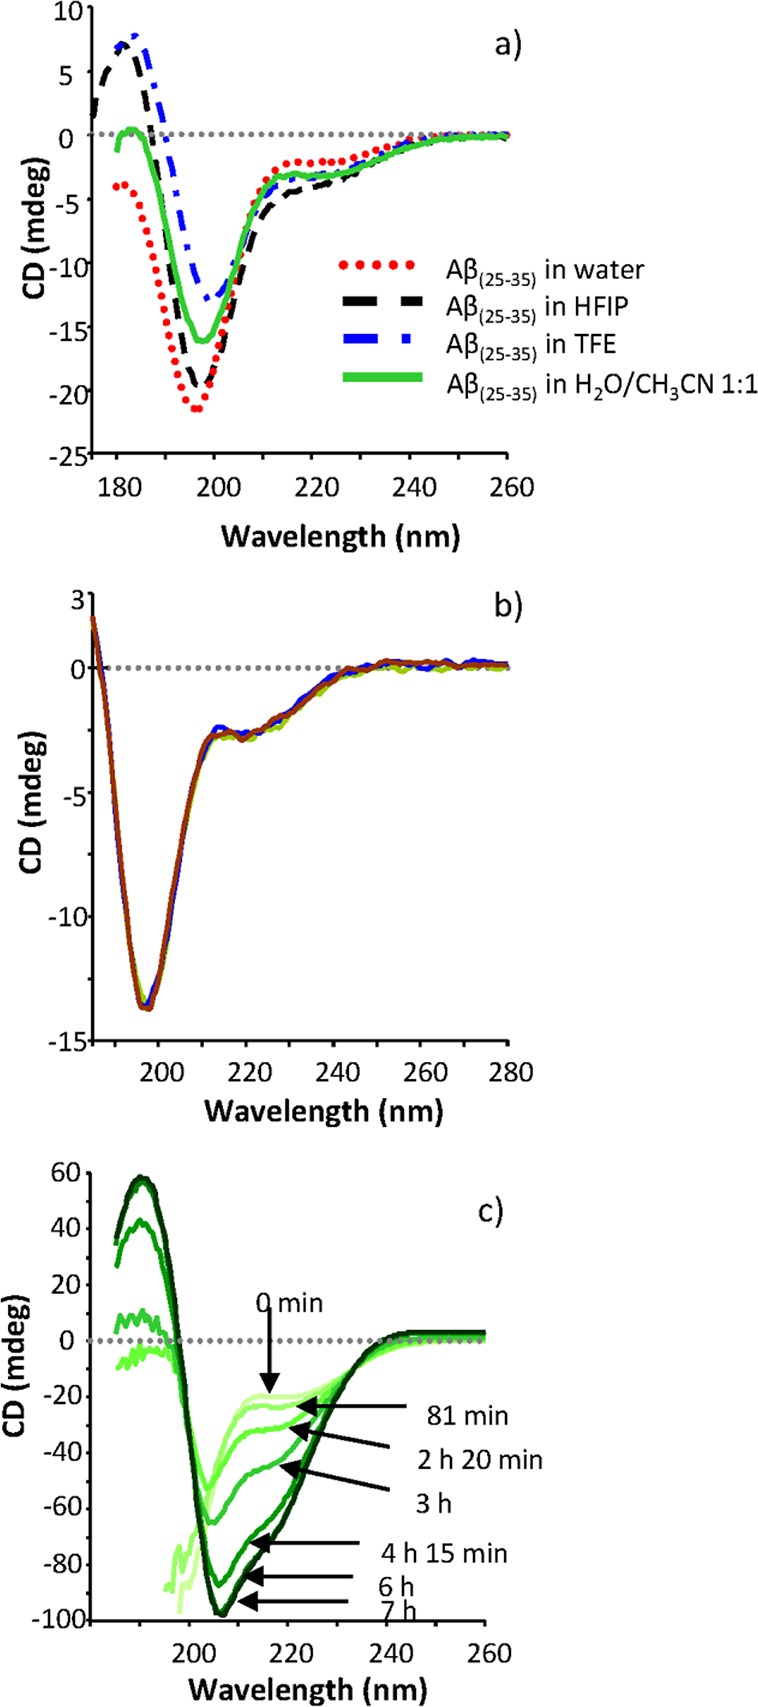
(a) CD spectra of Aβ(25–35) 200 μM (path length 0.5 mm) in various solvents at 22 °C; (b) superimposed CD spectra of three different Aβ(25–35) lyophilized samples when redissolved in water/acetonitrile 65:35 (v/v), [Aβ(25–35)] 200 μM, temperature 22 °C; (c) CD kinetic study of Aβ(25–35) 1.46 mM incubated in phosphate buffer (10 mM, pH 7.4)/CH3CN 75:25 (path length 0.5 mm, range 260–200 nm): time course overlaid CD spectra.
Clearly none of the spectra in Figure 2a and b are indicative of neither α-helix or β-sheet form seen in Figure 2c. All the CD spectra in Figure 2a and b can be classified as being evidence of a dynamic unordered state with evidence of a greater PII contribution in TFE and probably β-turn contributions in the positive CD below 190 nm for other solvents (Figure 2a). Aβ(25–35) is almost insoluble in acetonitrile as a salt, but the CD spectrum is characteristic of a dynamic unordered state. Like Aβ(1–42), Aβ(25–35) requires a pretreatment with HFIP, to obtain a homogeneous starting material in a nonamyloidogenic conformation, necessary to follow a reproducible self-assembly kinetics.
However, since the aggregation assay has to be performed in akin to physiological conditions, an intermediate redissolution step in water/organic solvent had to be carried out, followed by a final dilution in phosphate buffer. The HFIP cryo-lyophilization process was successfully carried out only at an appropriate low peptide concentration (224 μM). At higher Aβ(25–35) concentrations in HFIP, the resulting lyophilized solid peptide showed a CD spectra containing a significant β-sheet contribution, when redissolved in water/acetonitrile 65:35 (v/v). This unexpected result indicates an insufficient dissolution of all possible seeds or incomplete elimination of negative anionic counterions in the original salt by cryo-lyophilization, or simply the higher concentration increases the aggregation rate.
At lower Aβ(25–35) concentrations, homogeneous unordered CD spectra were obtained, due to the complete disruption of any interstrand hydrogen bond of β-sheets (Figure 2b). The water/acetonitrile peptide solution was then diluted with a mixture of acetonitrile/phosphate buffer for Aβ(25–35) self-assembly kinetic studies aimed at developing a reproducible, optimized assay for inhibition studies. Acetonitrile was also required in the assay to ensure inhibitor solubility.
Many variables can influence the rate and the type of self-aggregation of Aβ peptides including peptide concentration, buffer character (e.g., Tris or phosphate buffer) and concentration, pH, temperature, presence of organic solvents and mechanical perturbations of the system (e.g., stirring).
The Aβ(25–35) primary structure (Figure 1, isoelectric point = 8.75) indicates that no changes in ionization state are expected in the range of pH 4.5–7.6. For our purposes, the buffer pH was set at 7.2–7.4. A strong concentration dependent Aβ(25–35) self-assembly is now observed in the CD studies. The CD time-course for 1.46 mM Aβ(25–35), illustrated in Figure 2c, is evidence of a very fast aggregation kinetics with the formation of β-sheet. Incubating high peptide concentrations (1.46 mM) in phosphate buffer (10 mM, pH 7.4)/CH3CN 75:25 (v/v), we observed an impressive increase of the CD signal at 215 nm, after a lag time of about 2 h. After that lag time, the signal followed a fast exponential phase and then reached a plateau.
Aβ(25–35) Self-Assembly: ThT Fluorescence Spectroscopy Studies
ThT fluorescence spectroscopy was used to perform the time course self-assembly experiments, analyzing incubated peptide solutions up to 60 h. ThT is the most widely used in vitro marker of amyloid formation, since it binds specifically to amyloid, producing a shift in its emission spectrum and a fluorescence signal proportional to the amount of self-assembly species in β conformation. Detection is based on the fluorescence characteristics of ThT, revealing a considerably enhanced ThT fluorescence upon interaction with amyloid fibrils with excitation and emission maxima at about 450 and 480 nm, respectively.30 The binding mode of ThT can be defined as the orientation of ThT relative to the amyloid fibril as well as the conformation of ThT when bound to the fibril structure.31 ThT has been shown to bind with the long axis parallel to the long axis of the fibrils.32 This orientation of ThT is consistent with a recent X-ray crystal structure of ThT bound to a “peptide self-assembly mimic” (PSAM) scaffold. ThT binds to diverse fibrils, despite their distinct amino acid sequences, strongly suggesting that ThT recognizes a structural feature common among fibrils. Thus, ThT binding to the β-sheet surface along channels formed by cross-strand ladders would rationalize the ability of ThT to bind many self-assembled peptides.33 Like the longer amyloid peptide, the Tht fluorescence emission was observed also with Aβ(25–35) β sheet structures. For these reasons, we chose to couple this technique with CD studies, since both are indicative of the β- sheet secondary structure content of the analyzed amyloid sample.
Once verified by CD spectroscopy that after HIFP cryo-lyophilization and redissolution in water/acetonitrile, the Aβ(25–35) unordered secondary structure been maintained (Figure 2b), the optimization of the peptide self-assembly was performed with ThT fluorescence spectroscopy. In Aβ(25–35) aggregation experiments; i.e., when unordered structures were identified by CD in the sample, a sigmoidal trend was observed by plotting fluorescence intensities (at 490 nm) versus time (Figure 3a). The sigmoidal trend was characterized by a lag phase, exponential increase, and plateau phase. This behavior is consistent with a nucleation dependent fibril formation already experienced for Aβ(1–42).21,22,34−37 The prefibrillar nuclei (early oligomeric species) form during the lag time. The lag phase is then followed by the oligomer/protofibril/fibril formation/elongation phase, giving rise to an exponential increase in the fluorescence of the dye. The sigmoidal plot was a goal to achieve in order to reproducibly follow the nucleation-dependent aggregation kinetics, as already reported for Aβ(1–42).21−23 Conversely, when the HFIP Aβ(25–35) peptide solution was too concentrated, a β-sheet contribution in the water/acetonitrile CD spectrum disturbed the aggregation kinetic. This condition caused a fast self-assembly and an immediate exponential fluorescence increase (Figure 3b). This self-assembly kinetic trend without lag phase is typical when seeds are already present in the samples. So no lag phase (corresponding to the oligomeric nuclei formation) was observed in these samples and a lower IF value obtained at plateau indicated faster fibril precipitation.
Figure 3.

ThT fluorescence profile of Aβ(25–35) time-course-aggregation. (a) Aβ(25–35) concentration in HFIP during the crio-lyophilization was 224 μM. Aβ(25–35) (100 μM) was incubated in phosphate buffer (34.5 μM, pH 7.4), with 17.5% of acetonitrile at RT. (b) Aβ(25–35) concentration in HFIP during the crio-lyophilization was 1.793 mM. Aβ(25–35) (50 μM) was incubated in phosphate buffer (34.5 μM, pH 7.4), with 17.5% of acetonitrile at RT.
In more detail, when a homogeneous Aβ(25–35) sample is obtained with an unordered secondary structure, the fluorescence intensity of ThT, like the CD signal at 215 nm, is low and does not significantly change during the lag phase. Subsequently, an exponential increase is observed, indicative of a larger amount of β-sheet content and the formation of higher molecular weight self-assembled species formation. The lag phase duration was found to be concentration- and temperature-dependent. The rate of the exponential phase is defined by the slope of the linear trend of the sigmoid curve; the plateau characterizes the beginning of fibril formation (data not shown obtained by AFM). Once optimized in the first stage of sample preparation, the experiments included the fine-tuning of critical variables, which could affect the aggregation kinetics, such as peptide concentration, pH, temperature, and organic solvent (acetonitrile) content.
Aβ(25–35) Concentration Effect
A strong concentration dependence Aβ(25–35) self-assembly was already observed by CD studies. Very fast aggregation kinetics was obtained with a very fast β-conformation adoption of the peptide between 200 μM and 1.46 mM samples. Thus, the ThT fluorescence concentration dependent aggregation studies were carried out in the lower range 50–200 μM, at pH 7.4 (phosphate buffer 34 mM) and acetonitrile 17.5%, in order to slow down the kinetics toward a more reproducible assay. In Figure 4a, overlaid concentration-dependent kinetic plots are reported.
Figure 4.

Effect of peptide concentration and pH on Aβ(25–35) aggregation: ThT fluorescence profile. (a) Aβ(25–35) (50, 100, and 200 μM) was incubated in phosphate buffer (34.5 μM, pH 7.4), with 17.5% of acetonitrile at 4 °C; (b) Aβ(25–35) (100 μM) was incubated in phosphate buffer (34.5 μM, pH 5, 7.4 and 8), with 17.5% of acetonitrile at 4 °C.
At lower concentration, the lag phase duration increased, while the exponential slope and the fluorescence intensity at the plateau decreased, confirming the susceptibility trend observed in the CD studies. A peptide concentration of 100 μM was found to present a good compromise for a relatively fast but structurally defined and reproducible kinetic studies.
Temperature and Organic Modifier Content Effect
Temperature studies were performed at 4 °C, room temperature (24–27 °C) and 37 °C on Aβ(25–35) (100 μM) in buffer solution (34 mM, pH 7.4). A temperature increase did not seem to affect significantly the Aβ(25–35) lag phase at 100 μM, even if refrigerated samples guaranteed higher assay reproducibility. In the case of Aβ(1–42) aggregation studies, instead, the lag phase was found more influenced by the temperature, probably due to the longer peptide conformation rearrangement requiring longer incubation time. The effect of organic modifier on the aggregation of Aβ(25–35) (100 μM) was monitored at pH 7.4 by adding acetonitrile at 17.5%, 20%, and 25% (v/v). In Aβ(25–35) aggregation studies, acetonitrile addition in the range 17.5–25% did not dramatically modify the sigmoidal curve shape. Conversely, in the case of Aβ(1–42), acetonitrile content strongly affected both lag phase duration and conformational transition rate. In particular, the lag phase was longer (from 5 to 15 h) and the rate of β-sheet formation was lower in Aβ(1–42) solution containing a percentage of acetonitrile higher than at 4.8%. We explained this difference by considering that Aβ(1–42) is hardly soluble in water, whereas in acetonitrile mixtures at lower polarity it is increasingly soluble and less prone to aggregate. On the other hand, the shorter peptide is more soluble in water and insoluble in acetonitrile and hence less influenced by low percentage of organic solvent.
pH Effect
The pH value was fixed at 7.4, because Aβ(25–35) was found less soluble at pH 5 and 8, and at these pH the aggregation process proceeded with an exponential trend, without lag phase, and reached lower fluorescent values than those at pH 7.4 (Figure 4b). The pH dependence (pH 5, 7.4 and 8.0) of Aβ(25–35) aggregation was evaluated at 4 °C. Aβ(25–35) aggregation process was not affected by NaCl in the tested range of concentration. In summary, for the self-assembly kinetics of Aβ(25–35) to be comparable to Aβ(1–42) in terms of the time scale, the optimum conditions were found to be 100 μM at pH 7.4, 34 mM phosphate buffer containing 17.5% v/v acetonitrile.
Using CD and fluorescence spectroscopies, we confirmed that Aβ(25–35), like Aβ(1–42), undergoes a conformational transition from a soluble, unordered secondary structure to aggregated higher order fibrillary β-sheet, depending on the environmental conditions. The trend observed for Aβ(1–42) was reproducibly optimized for Aβ(25–35) CD and ThT fluorescence spectroscopies. The Aβ(25–35) sigmoidal self-assembly, characterized by a lag phase, a β-sheet growth phase, and plateau phase in which the fibrils elongated. However, this rationalization of the self-assembly process is only possible when a unordered peptide conformation has been confirmed at time zero by CD and ThT fluorescence spectroscopies.
In comparison with Aβ(1–42), Aβ(25–35) conformational rearrangement was found to depend mostly on its concentration and pH. The change of conformation toward a higher β-sheet content was found to be faster. At 100 μM, the Aβ(25–35) kinetic trend is nearly coincident with that of Aβ(1–42) at 50 μM. Aβ(1–42) has a ∼4 times higher MW and number of AA than Aβ(25–35). The shorter peptide has a faster secondary structure shift to the amyloidogenic β-sheet conformation, and therefore, it is more prone to aggregate.
These results were confirmed by molecular dynamic simulation: four of the five sampled chains preferred β-sheet structures, and such structures existed for a much longer time. The final structure of the core formed by two monomers antiparallel β-sheets, formed by residues 31–34 and 28–30 of vicinal peptide, interacts with the hydrophobic side chains of two other monomers. The relatively short time of existence of intra-β-sheets compared to inter-β-sheets, that is, between monomers (about 10 ns), indicates propensity of Aβ(25–35) to form larger structures and aggregation (Figure 5b). Once the high reproducibility of sigmoidal profiles was achieved, an essential prerequisite for accurate and reproducible results, inhibition studies were carried out.
Figure 5.
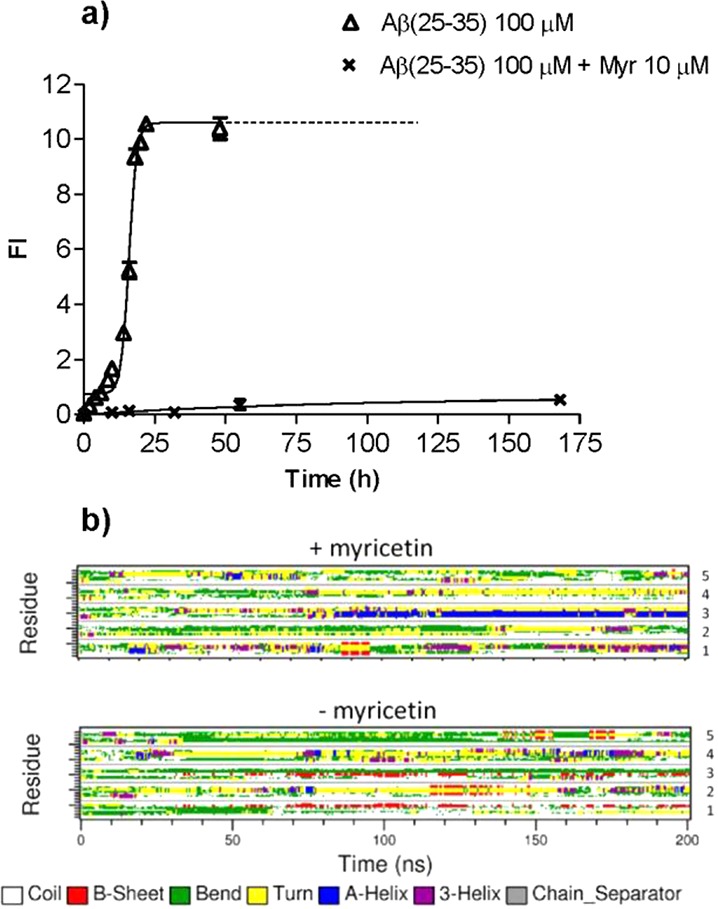
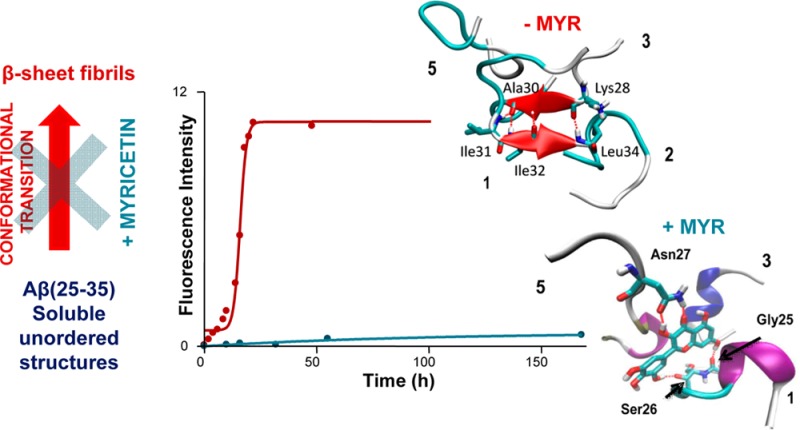
(a) ThT fluorescence profile of of Aβ(25–35) time-course aggregation in the absence and presence of 10 μM myricetin added at t = 0; samples were incubated in phosphate buffer (34.5 μM, pH 7.4), with 17.5% of acetonitrile at 4 °C. (b) Evolution of secondary structures with time for systems with (top) and without (bottom) myricetin. The monomer numbers are shown on the right side of the boxes.
Inhibition Studies
Myricetin, curcumin, and (−)-tetracycline, known inhibitors of Aβ(1–42) aggregation, were assayed on the basis of Aβ(25–35) self-assembly kinetics. To further validate our approach, tacrine, an anticholinesterase drug used in the past for AD treatment, was selected as a negative control. Tacrine does not interfere with the spontaneous amyloid assembly of small linear oligopeptides.
Several reports have discussed the role of myricetin in the inhibition of Aβ(1–42) self-assembly.21,38−40 CD spectroscopy has been used to confirm that myricetin prevents conformational changes in Aβ(1–42) and the ThT fluorescence signal, after 48 h incubation, confirms that it selectively targets Aβ(1–42).41 Curcumin and curcumin derivatives inhibits Aβ(1–42) and Aβ(1–40) fibril formation.42−46 Curcumin derivatives, which exist predominantly in the enol form, bind more strongly to Aβ aggregates; therefore, their enolization is crucial for higher affinity.47 A further evidence that curcumin can bind to amyloid is that some curcumin derivatives were able to stain very efficiently Aβ deposits.48
(−)-Tetracycline has been studied as a Aβ(1–42) amyloid aggregation inhibitor by CD and ThT fluorescence spectroscopy.22 CD studies showed that in the presence of (−)-tetracycline the secondary structure of Aβ(1–42) changes over time, but this shift progresses at a slower rate to a predominantly β-sheet structure than the peptide alone.22,49−51
NMR, DLS, and AFM experiments showed a new mechanism for explaining tetracycline inhibition of amyloid toxicity through the immediate formation of new aggregates that improved the solubility of Aβ peptides, preventing in this way the progression of the amyloid cascade. Moreover, competitive NMR binding experiments showed for the first time that tetracycline competes with ThT in the binding to Aβ peptides.52 However, no report was been found describing the effect of these inhibitors on the Aβ(25–35) self-assembly process. Turbidimetric studies, based upon apparent absorbance, have been reported53,54 in the search for new self-assembly inhibitors. However, turbidity measurements are focused on aggregate formation per se and do not provide about peptide secondary structure.
The aim of the comparative inhibitor study was to establish that these inhibitors are active also on the shorter peptide and to highlight the inhibition mechanism and site of action. As starting point, using the optimized experimental conditions, the inhibitory potency of the chosen inhibitors on the Aβ(25–35) self-assembly process was assessed by a ThT fluorescence based assay. After 24 h incubation time, the fluorescence intensities of the samples with and without inhibitor were compared and the percent inhibition due to the presence of the inhibitor was calculated by the following formula: 100 – (IFi/IF0 × 100), where IFi and IFo are the fluorescence intensities at 490 nm related to Aβ(25–35) aggregation after 24 h of incubation obtained for Aβ(25–35) in the presence and in the absence of inhibitor, respectively. Table 1 lists the IC50 values for inhibition of Aβ(25–35) at 100 μM peptide concentration, along with literature data for Aβ(1–42) inhibition. The amyloid/inhibitor concentration ratios for the different IC50 values is also reported, to help to normalize the data. In practice, the concentrations of Aβ(1–42) used in Table 1 varied from 25 to 50 μM; the concentration of Aβ(25–35) was always set at 100 μM.
Table 1. Inhibitory Activities of Selected Aβ(1-42) Inhibitors Towards the Formation of Aβ(25-35) Fibrils.
| Aβ(25–35) |
Aβ(1–42) |
|||
|---|---|---|---|---|
| compd | IC50(μM)a | Aβ (μM)/ IC50 (μM) | IC50(μM)c | Aβ (μM)/ IC50 (μM) |
| myricetin | 0.4 (44) | 58.1 | ||
| 3.0 | 32.9 | 0.3–0.542,43 | ||
| 2.521 | 20 | |||
| curcumin | 13.0 | 7.7 | 0.6 (44) | 39.7 |
| 0.6–1.142,43 | ||||
| (−)-tetracycline | 14.8 | 6.7 | 10.044 | 2.5 |
| tacrine | /b | nonactive22 | ||
IC50 inhibitory concentration (μM) values are expressed as mean ±5% [standard error of the mean (SEM)] of two experiments (n = 2), each performed in duplicate.
Inactive in the concentration rage 5–500 μM.
Data taken from literature.
All three inhibitors were able to inhibit Aβ(25–35) self-assembly; the most active was myricetin, followed by curcumin (in agreement with the IC50 reported by Riviere et al.53), and then by tetracycline. The trend is comparable for both Aβ(25–35) and Aβ(1–42) as anticipated based upon our previous reports on Aβ(1–42).21
Myricetin was found to destabilize Aβ(25–35) self-assembly and antagonize the conformational shift of Aβ peptides at the basis of self-assembly process with the highest potency. In the presence of myricetin, curcumin and tetracycline the overall Aβ(25–35) self-assembly process was retarded, even if to different extents, and fibril formation was strongly retarded. Therefore, the three inhibitors have certainly a binding site on Aβ(25–35), where they interact with different affinities, myricetin showing the highest potency. By inhibiting the shorter Aβ(25–35) peptide, they can inhibit also the longer Aβ(1–42), Aβ(1–40) peptides self-assembly.
The fact that curcumin showed a higher amyloid/IC50 ratio for Aβ(1–42) compared to Aβ(25–35), might imply that the Aβ(25–35) and Aβ(1–42) binding sites are different. This is in agreement with the finding of at least two distinct binding sites for small molecule inhibitors on Aβ(1–42).46
Since myricetin displayed a comparably higher inhibition for on both Aβ(25–35) and Aβ(1–42), further kinetic studies were undertaken. In agreement with Aβ1–42 data, the ThT fluorescence profile of the Aβ(25–35) aggregation time course (Figure 5a) showed that, in the presence of myricetin, the overall assembly process was greatly retarded and fibril formation was strongly delayed. Myricetin at 10 μM decreased the ThT fluorescence associated with Aβ fibrils, resulting in a shift of the t50 from 12 to 75 h (Figure 5a). The quantitative data reported here unequivocally confirm that myricetin inhibits the folding and self-association of Aβ(25–35) in agreement with data obtained on Aβ(1–42).21
To sum up, the results strongly indicate that the species targeted by myricetin is the Aβ monomer in the nonaggregation-prone conformation (low level of β-sheet content) and short transient oligomers, which are predominant in the first hours of the self-assembly process and slowly disappear when Aβ fibrils become prevalent, both for Aβ(25–35) and Aβ(1–42). On the basis of these results, we have employed a molecular dynamics approach to further characterize the mode of myricetin inhibition.
Molecular Dynamics
The time course evolutions of the secondary structures of Aβ(25–35) are plotted in Figure 5b for the systems with and without myricetin. For the system with myricetin, the helices, turns and bends dominated the structure, while β-sheet existed for only about 10 ns in one copy of polypeptide. After about 80 ns of simulation, a stable helix was formed in monomer 3 (Figure 5b) which interacted with myricetin through hydrophobic interactions instead of hydrogen bonds. The final structure of three peptides interacting with myricetin after 200 ns is shown in Figure 6a. The hydrogen bonds between myricetin and peptide residues Gly25 and Ser26 of peptide 1, and Asn27 of peptide 5 are shown. The large number of hydroxyl groups in myricetin facilitates formation of hydrogen bonds with the Aβ(25–35) peptide, especially with the backbone (here Gly25, Ser26) or side chains, like Asn27. In Figure 6a it is shown that the hydroxyl and carbonyl groups of the Asn27 of monomer 5 are involved in myricetin binding. The carbonyl groups of the main chain of peptide 1 form a large ring structure with two hydroxyl groups oriented to both ends of the myricetin molecule.
Figure 6.

Final structures of the system with myricetin (a) and without myricetin (b) after 200 ns of MD simulation. The α-helix structure are shown in blue, 3–10 helix in purple, and β-sheet in red. Monomer numbers in contact with myricetin are specified.
For Aβ(25–35) without myricetin, four of the five chains preferred β-sheet structures (Figure 6b), such structures existed much longer than in the presence of myricetin. The final structure of antiparallel β-sheet, formed by residues 31–34 of peptide 1 and 28–30 of peptide 3 is illustrated in Figure 6b. The β-sheet was created around 50 ns after the simulation started and lasted to the end of simulation enduring several disruptions. In the final structure, two other monomers, 2 and 5, interact via their hydrophobic side chains with the core formed by monomers 1 and 3.
The internal β-sheet is initially formed in monomers 2 and 5 (Figure 5b) but for a relatively short time period (about 10 ns) consistent with the propensity of Aβ(25–35) to form larger structures and aggregation in the absence of myricetin (Figure 5b). The number of hydrogen bonds created by myricetin fluctuates between 1 and 2 for most of the simulation and increases to 3–4 for the last 50 ns (Figure 6a). The total number of contacts between Aβ(25–35) and myricetin within a distance of <0.35 nm is the same throughout with 6–8 contacts for most of the simulations and which increases to 13–15 for the last 50 ns. This increase correlates with an increase in the number of hydrogen bonds formed by myricetin.
In parallel, several MD trajectories described the evolution of the Aβ(25–35) monomer fragment, both by itself and in the presence of myricetin. The myricetin-free Aβ(25–35) monomers interacted with each other via hydrophobic residues. In the presence of myricetin, the Aβ(25–35) chains were unable to form extended conformations but instead formed and retained the helical/unordered structures.
Conversely, in the absence of myricetin, a central peptide core was formed including 2–4 residues in an antiparallel β-sheet conformation for subsequent oligomerization and formation of β-amyloids. In the presence of myricetin, both backbone to backbone and side-chain to side-chain hydrogen bonds are lost, and the β-sheets move away from each other. This leads to the loss of backbone H-bonding and eventual separation of one β-strand from the outer layer. Myricetin can form a large number of interactions including hydrogen bonds as well as hydrophobic stabilizations with β-peptides.
Using MD simulations and starting from unordered structures of five copies of Aβ(25–35), stable helical peptide structures were observed in the presence of myricetin but stable β-sheet conformations in the absence of myricetin. The systems investigated evolved toward structures having a large number of hydrogen bonds and many hydrophobic contacts between myricetin and Aβ(25–35). A large number of hydrophobic contacts were also observed in the absence of myricetin. Although the Aβ(25–35) monomers interacted with each other via hydrophobic residues even in the presence of myricetin, they were unable to form extended conformations but instead formed and retained the helical structures. In the absence of myricetin, Aβ(25–35) formed a central core involving 2–4 residues forming an antiparallel β-sheet which could serve as a center for subsequent oligomerization β-amyloid formation.
Curcumin, myricetin, and (−)-tetracycline, despite being structurally different, seemingly bind at the same Aβ(25–35) sites but with different affinities (Table 1). The common structural feature in the three molecules is the vicinal hydroxyl and carbonyl groups. The data reported here suggests that other Aβ toxicity inhibitors may also bind to one of these Aβ(25–35) sites. Identification of these common binding loci provides targets on the Aβ fibril surface that can be tested in the future for their role in Aβ biological activity.
The common structural motif involves the Asn27 residue which can serve as a hydrogen bond donor and acceptor at the same time to form a very tight hydrogen bond network, typical of amyloids. Inhibitors mimicking such interactions can prevent oligomerization and formation of fibrils. Myricetin can form hydrogen bonds on both sides of its rings. Other inhibitors, like tetracycline, possess protruding groups only on one side and are not able to form hydrogen bonds in such effective way. A large distance between hydrogen bond forming groups in curcumin is also a factor preventing effective binding, as well as the keto–enolic tautomerism.
Conclusions
In conclusion, by combining two in vitro techniques, ThT fuorescence, and CD spectroscopy, with MD simulation, a robust approach has been achieved for reproducibly studying the short Aβ(25–35) peptide self-assembly kinetics. Using CD and ThT fluorescence, reproducible methods to monitor the self-association of the Aβ(25–35) peptide have been developed and to monitor the secondary structure switch of the short amyloid peptide Aβ(25–35) from non-amyloidogenic to amyloidogenic conformations. The methodology has been optimized and the need to pretreat Aβ(25–35) has been emphasized. The Aβ fragment Aβ(25–35) self-associates like the full Aβ(1–42) peptide by switching to insoluble β structures. Aβ(25–35) shows a much faster fibril formation rate than the longer amyloid peptides.
Detailed descriptions of the conformational transitions and molecular events are also key steps for designing new scaffold aggregation inhibitors. Curcumin, myricetin, and (−)-tetracycline, three known inhibitors of Aβ(1–42) self-assembly, also inhibited Aβ-(25–35) self-association as indicated by inhibition potency (IC50) values. Myricetin, the most active of the three Aβ(1–42) self-assembly inhibitors, was studied in more detail. The mechanism of action of myricetin, as an amyloid inhibitor, was highlighted in MD simulations. These studies focused on the shorter amyloid peptide enabled the identification of the key amino acids in the formation of the myricetin Aβ(25–35) inhibition complex: Gly25 and Ser26 of peptide 1, and Asn27 of the vicinal peptide. The Asn27 residue can form stable hydrogen bonds with myricetin hydroxyl groups. The results obtained in this study strongly indicate the critical structural features for optimum binding to the undecapeptide: the presence of two aromatic groups in a rigid structure, the substitution pattern of these aromatics with vicinal carbonyl and hydroxyl groups and a short linker, in agreement with previous findings on Aβ(1–42). On the basis of these results, we could confirm the presence in Aβ(25–35) of at least one major binding site for Aβ aggregation inhibitors.
Moreover, these combined in vitro and theoretical studies of the Aβ (25–35) self-assembly and its inhibition contribute to opening the way to understanding the mechanism of action of well-known inhibitors enabling the rational design and the synthesis of more potent new molecules able to antagonize the self-assembly process. These results offer insight into the key chemical features required for inhibiting amyloid β aggregation. In turn, these findings help define the nature of the docking site for small molecules on the amyloid β surface.
Methods
Materials
1,1,1,3,3,3-Hexafluoro-2-propanol (HFIP) as well as methanol and acetonitrile (CH3CN) (Chromasolv) were obtained from Sigma (Milan, Italy). Purified water from Milli-RX system (Millipore, Milford, MA) was used to prepare buffers and standard solutions. To prepare buffer solutions, potassium dihydrogen phosphate, dipotassium hydrogen phosphate trihydrate, and sodium chloride (Sigma-Aldrich, Milan, Italy) of analysis quality were used. Nitrocellulose (0.22 μm) and nylon (0.20 μm) membrane filters (Millipore, Carrigtwohill, Ireland B.V.) were employed to filter buffers and solutions. On the basis of their solubility, standard stock solutions of myricetin (2.5 mM), tacrine hydrochloride (4 mM), curcumin (2 mM), and (−)-tetracycline (2 mM) (structures in Figure 1) were prepared in methanol. All the compounds were from Sigma-Aldrich (Germany).
Aβ(25–35) Sample Preparation
Aβ(25–35) trifluoroacetate salt lyophilized powder (Bachem AG, Switzerland) was pretreated overnight with HIFP (896 μM), aliquoted in eight glass tubes, diluted with HFIP to a final concentration of 224 μM, cryo-lyophilized, and stored at −18 °C. Before each experiment, the Aβ(25–35) lyophilized peptide was redissolved in 225 μL of a freshly prepared mixture consisting of CH3CN/H2O 65:35 (v/v) by brief vortexing. For time course experiments, the resulting Aβ(25–35) solution (400 μM) was then diluted with a mixture composed of phosphate buffer (69 mM, pH 7.0)/H2O/CH3CN in the appropriate volume and salt concentration to study the following variables (pH, peptide concentration, NaCl concentration, acetonitrile percentage, and temperature) as reported below. All the sample preparation steps were performed in ice. Analyses were then performed at selected times.
Concentration Dependence Studies
To obtain a 200 μM solution, Aβ(25–35) solution (400 μM) in H2O/CH3CN 65:35 (v/v) was diluted with phosphate buffer (69 mM, pH 7.0). In order to obtain a 50 μM solution, Aβ(25–35) solution (400 μM) in H2O/CH3CN 65:35 (v/v) was opportunely diluted with phosphate buffer (69 mM, pH7.0)/H2O/CH3CN 57.1:27.9:15 (v/v/v). Aβ(25–35) 100 μM solutions were prepared by diluting the Aβ(25–35) H2O/CH3CN 65:35 (v/v) solution (400 μM) with phosphate buffer (69 mM, pH 7.0)/H2O/CH3CN 66.7:21.7:11.6 (v/v/v). Besides the Aβ(25–35) concentration values, all the samples final conditions were thus unvaried: phosphate buffer 34.5 mM, pH 7.4, and 17.5% acetonitrile. The Aβ(25–35) solutions at different concentrations were briefly vortexed, and 60 μL aliquots were distributed in eppendorf tubes and incubated at room temperature without any stirring for the self-assembly kinetic studies. ThT fluorometric analyses were then performed at selected times.
Temperature Dependence Studies
The resulting Aβ(25–35) H2O/CH3CN 65/35 (v/v) solution (400 μM) was then diluted with phosphate buffer (69 mM, pH 7.0)/H2O/CH3CN 66.7/21.7/11.6 (v/v/v) in order to obtain a 100 μM Aβ(25–35) solution. The final assay conditions were as follow: 100 μM Aβ(25–35) in phosphate buffer (34.5 mM, pH 7.4) and 17.5% of acetonitrile. The Aβ(25–35) solution was briefly sonicated and 60 μL aliquots divided in eppendorf tubes and incubated at room temperature (24–27 °C), in the refrigerator set at 4 °C or by using HAAKE D8 thermostat (Berlin, Germany) set at 37 °C. ThT fluorometric analyses were then performed at selected times.
pH Dependence Studies
The effect of different pH values (5, 7.4, 8) on the aggregation process was studied. For the experiments at pH 5, Aβ(25–35) solution (400 μM) in H2O/CH3CN 65:35 (v/v) was diluted with phosphate buffer (69 mM, pH 4.7)/H2O/CH3CN 66.7:21.7:11.6 (v/v/v) in order to obtain a 100 μM solution in phosphate buffer 34.5 mM and with 17.5% of acetonitrile. For the experiments at pH 8, Aβ(25–35) solution (400 μM) in H2O/CH3CN 65:35 (v/v) was diluted with phosphate buffer (69 mM, pH 7.7)/H2O/CH3CN 66.7:21.7:11.6 (v/v/v) in order to obtain a 100 μM solution in phosphate buffer 34.5 mM and with the 17.5% of acetonitrile. Aβ(25–35) at pH 7.4 were prepared as described above. The Aβ(25–35) solutions were briefly vortexed, and 60 μL aliquots were divided in eppendorf tubes and incubated in the refrigerator at 4 °C. ThT fluorometric analyses were then performed at selected times.
Aggregation with Different Percentage of Acetonitrile
For the experiments with 20% acetonitrile, Aβ(25–35) solution (400 μM) in H2O/CH3CN 65:35 (v/v) was diluted with phosphate buffer (69 mM, pH 7.0)/H2O/CH3CN 66.7:18.3:15 (v/v/v) in order to obtain a 100 μM solution in phosphate buffer 34.5 mM, pH 7.4. For the experiments with 25% acetonitrile, Aβ(25–35) solution (400 μM) in H2O/CH3CN 65:35 (v/v) was diluted with phosphate buffer (69 mM, pH 7.0)/H2O/CH3CN 66.7:11.7:21.6 (v/v/v) in order to obtain a 100 μM solution in phosphate buffer 34.5 mM, pH 7.4. Aβ(25–35) with 17.5% acetonitrile was prepared as described above. The Aβ(25–35) solutions with different percentages of acetonitrile were briefly vortexed, and 60 μL aliquots were divided in eppendorf tubes and incubated in the refrigerator at 4 °C. Time course ThT fluorometric analyses were then performed at selected times.
Aggregation with Different Concentration of NaCl
Aβ(25–35) solution (400 μM) in H2O/CH3CN 65:35 (v/v) was diluted with phosphate buffer (69 mM, pH 7.0) with NaCl 20 mM/H2O/CH3CN 66.7:18.3:15 (v/v/v) in order to obtain a 100 μM solution in phosphate buffer 34.5 mM, pH 7.4 with NaCl 10 mM and with 17.5% acetonitrile. Aβ(25–35) solution (400 μM) in H2O/CH3CN 65:35 (v/v) was diluted with phosphate buffer (69 mM, pH 7.0) with NaCl 40 mM/H2O/CH3CN 66.7:18.3:15 (v/v/v) in order to obtain a 100 μM solution in phosphate buffer 34.5 mM, pH 7.4 with NaCl 20 mM and with 17.5% acetonitrile. Aβ(25–35) solution (400 μM) in H2O/CH3CN 65:35 (v/v) was diluted with phosphate buffer (69 mM, pH 7.0) with NaCl 60 mM/H2O/CH3CN 66.7:18.3:15 (v/v/v) in order to obtain a 100 μM solution in phosphate buffer 34.5 mM, pH 7.4 with NaCl 30 mM and with 17.5% acetonitrile. The Aβ(25–35) solutions with different concentrations of NaCl were briefly vortexed, and 60 μL aliquots were divided in eppendorf tubes and incubated in the refrigerator at 4 °C. Time course ThT fluorometric analyses were then performed at selected times.
Aβ(25–35) Self-Assembly Inhibition Studies
Inhibition studies were performed by incubating 100 μM Aβ(25–35) in phosphate buffer (34.5 mM, pH 7.4) and 17.5% acetonitrile at 4 °C without any stirring, in the presence and in the absence of the individual tested compound. For the evaluation of IC50 values, inhibitors were diluted in the assay buffer in order to have five different final concentrations in the following ranges: 0.5–20 μM myricetin; 10–500 μM tacrine, 0.5–20 μM curcumin, and 1–40 μM tetracycline. At t = 0, aliquots of the tested compound solutions were added to the Aβ(25–35) samples, and after 24 h incubation at 4 °C ThT fluorometric analyses was performed as described below.
The percentage of inhibition due to the presence of increasing test compound concentration was calculated by the following expression: 100 – (IFi/IF0 × 100), where IFi and IFo are the ThT fluorescence intensities obtained for Aβ(25–35) in the presence and in the absence of inhibitor, respectively. Inhibition curve was obtained by plotting the percentage inhibition versus the logarithm of inhibitor concentration in the assay sample. The linear regression parameters were determined and the IC50 interpolated (GraphPad Prism 4.03 GraphPad Software Inc.).
For the time course experiments, at t = 0, aliquots of 2 μL of 300 μM myricetin solution in buffer, obtained by dilution of 2.5 mM methanol stock solution, was added to the Aβ(25–35) samples (58 μL) distributed in eppendorf tubes, in order to have concentration ratio [myricetin]/[Aβ(25–35)] = 10 μM/100 μM = 1/10 and incubated at 4 °C. At selected times, the 60 μL aliquots were analyzed with the specific ThT technique-related protocol in the section reported below.
Thioflavin T-Based Fluorometric Assay
ThT (Sigma-Aldrich, Milan, Italy) based fluorometric assays were performed with a Jasco Spectrofluorometer FP-6200 using a 0.5 mL, 1 cm path length quartz cell. After the appropriate incubation time, the Aβ(25–35) solutions with and without inhibitors were diluted with glycine-NaOH buffer (50 mM, pH 8.5) containing ThT (25 μM) up to a final volume of 560 μL. The fluorescence emission signal was monitored at 490 nm (λexc = 446 nm) with excitation and emission slits of 2 nm bandwidth. A time scan was performed, and the fluorescence intensity values at the plateau (around 300 s) were averaged after subtracting the background fluorescence from 25 μM ThT and tested compound.
Circular Dichroism Spectroscopy
All the CD spectra of the Aβ(25–35) peptide were recorded by a Chirascan circular dichroism spectrometer (Applied Photophysics, U.K.), in the spectral range 175–260 nm using a 0.5 mm path length cell at 22 or 25 °C. Spectra were recorded with the following instrumental settings: step size, 0.5 nm, time per point, 3.0 sec, bandwidth, 1 nm. Solutions of Aβ(25–35) (200 μM) for conformational analysis were prepared immediately before use starting from HFIP cryo-lyophilized samples. Solutions of Aβ(25–35) in phosphate buffer (10 mM, pH 7.4)/acetonitrile 75:25 (v/v) for aggregation studies were prepared immediately before use starting from HFIP cryo-lyophilized samples.
System Construction and Molecular Dynamics Simulation
All simulations described below were done under GROMACS 4.5.5 molecular dynamics (MD) simulation package.55 Aβ(25–35) was taken from NMR structure (PDB id: 1QXC) in coiled conformation.18 In the first investigated system, five copies of Aβ(25–35) were randomly placed in a periodic triclinic box with angles 60° between x, y and x, z axes and 90° between y, z axes. Such periodic box includes less water molecules than analogous cubic box while preserving the same distances to solute images in adjacent boxes. The box dimension was set to 7.25 nm. In the second system, the same configuration of polypeptides Aβ(25–35) was used while a myricetin molecule was inserted into the system. The box dimension was increased to 8.03 nm for accommodation of the added myricetin. The AMBER0356 force field was used for the polypeptide, while the General Amber Force Field (GAFF)57 was used for myricetin. The systems were solvated with water molecules using the SPC/E (extended simple point charge) model, and appropriate numbers of Na+ and Cl– ions were added in replacement of some water molecules to model the system under physiological environment of 0.15 mM salt concentration. The final systems contained about 8500 and 11 800 water molecules for both systems, respectively. A steepest descent energy minimization of 200 steps was used to remove possible close contacts between atoms, and then three rounds of 2 ps NVT MD run and a subsequent 2 ps NPT MD run were performed with the solute heavy atoms restrained to their initial positions using a force constant of 1000 KJ/mol/nm2. Finally, a 200 ns MD run under NPT (isothermal–isobaric ensemble) was performed with all bonds constrained with the LINCS algorithm,58 to preserve accurate simulations with increased time step of 2 fs. The van der Waals interaction potentials were shifted to 0 from 0.9 to 1.0 nm with long-range dispersion corrections to both energy and pressure. The long-range Coulomb interactions were calculated by the PME method59,60 with a cutoff of 1.1 nm. The temperature of the system was coupled separately for the polypeptide(/myricetin) and water/ion groups to a heat bath of 300 K with time constant of 0.1 ps. The pressure was maintained at 1 bar isotropically with a time constant of 0.5 ps.
Author Contributions
V.A., A.F.D., C.B., and S.F. conceived the methodology, analyzed the results, wrote the paper, and directed the project; M.N., J.F., M.P., and R.W. ran the experiments, analyzed the data, and wrote the paper; K.M. ran the experiments and analyzed the data, A.D.S. ran the experiments.
This work was supported by the European Union Seventh Framework Programme (FP7/2007-2013) under grant agreement n° [214538] project BioInspired Self-assembled Nano-Enabled Surfaces (BISNES). PRIN 2008 (C.B.) and PRIN 2009 (V.A.) from MIUR, Italy are acknowledged. The research discussed has received funding also from the European Union’s Seventh Framework Programme (FP7/2007-2013) under Grant Agreement No. 211800 “Structural Biology of Membrane Proteins - SBMPs”. This work was also supported by the Grant No. N N401 557840 from Polish Ministry of Science and Higher Education.
The authors declare no competing financial interest.
Author Contributions
⊥ M.N. and R.W. contributed equally to this work.
Author Present Address
# School of Bioscience & Bioengineering, South China University of Technology, Higher Education Mega Center, 510006, Guangzhou, People’s Republic of China.
References
- Claeysen S.; Cochet M.; Donneger R.; Dumuis A.; Bockaert J.; Giannoni P. (2012) Alzheimer culprits: Cellular crossroads and interplay. Cell. Signalling 24, 1831–1840. [DOI] [PubMed] [Google Scholar]
- Jucker M.; Walker L.-C. (2011) Pathogenic protein seeding in Alzheimer disease and other neurodegenerative disorders. Ann. Neurol. 70, 532–540. [DOI] [PMC free article] [PubMed] [Google Scholar]
- Dohm C.-P; Kermer P.; Bähr M. (2008) Aggregopathy in neurodegenerative diseases: mechanisms and therapeutic implication. Neurodegener. Dis. 5, 321–338. [DOI] [PubMed] [Google Scholar]
- Bolognesi M.-L.; Rosini M.; Andrisano V.; Bartolini M.; Minarini A.; Tumiatti V.; Melchiorre. C. (2009) MTDL design strategy in the context of Alzheimer’s disease: from lipocrine to memoquin and beyond. Curr. Pharm. Des. 15, 601–13. [DOI] [PubMed] [Google Scholar]
- Aisen P.-S.; Gauthier S.; Ferris S.-H.; Saumier D.; Haine D.; Garceau D.; Duong A.; Suhy J.; Oh J.; Lau. W.-C.; Sampalis J. (2011) Tramiprosate in mild-to-moderate Alzheimer’s disease- a randomized, double-blind, placebo-controlled, multi-centre study (the Alphase Study). Arch. Med. Sci. 7, 102–111. [DOI] [PMC free article] [PubMed] [Google Scholar]
- Bartolini M.; Andrisano V. (2010) Strategies for the inhibition of protein aggregation in human diseases. ChemBioChem 11, 1018–1035. [DOI] [PubMed] [Google Scholar]
- Tew D.-J.; Bottomley S.-P.; Smith D.-P.; Ciccotosto G.-D.; Babon J.; Hinds M.-G.; Masters C.-L.; Cappai R.; Barnham K.-J. (2008) Stabilization of neurotoxic soluble beta-sheet-rich conformations of the Alzheimer’s disease amyloid-beta peptide. Biophys. J. 94, 2752–2766. [DOI] [PMC free article] [PubMed] [Google Scholar]
- Fraser P.-E.; McLachlan D.-R.; Surewicz W.-K.; Mizzen C.-A.; Snow A.-D.; Nguyen J.-T.; Kirschner D.-A. (1994) Conformation and fibrillogenesis of Alzheimer A beta peptides with selected substitution of charged residues. J. Mol. Biol. 244, 64–73. [DOI] [PubMed] [Google Scholar]
- Soto C.; Frangione B. (1995) Two conformational states of amyloid beta-peptide: implications for the pathogenesis of Alzheimer’s disease. Neurosci. Lett. 186, 115–118. [DOI] [PubMed] [Google Scholar]
- Nandi P.-K. (1996) Protein conformation and disease. Vet. Res. 27, 373–382. [PubMed] [Google Scholar]
- Soto C.; Castaño E.-M. (1996) The conformation of Alzheimer’s beta peptide determines the rate of amyloid formation and its resistance to proteolysis. Biochem. J. 314, 701–707. [DOI] [PMC free article] [PubMed] [Google Scholar]
- Gouras G.-K.; Tampellini D.; Takahashi R.-H.; Capetillo-Zarate E.-A. (2010) Intraneuronal beta-amyloid accumulation and synapse pathology in Alzheimer’sdisease. Acta Neuropathol. 119, 523–541. [DOI] [PMC free article] [PubMed] [Google Scholar]
- Ghosh K.; Gemma S.; Tang J. (2008) beta-Secretase as a therapeutic target for Alzheimer’s disease. Neurotherapeutics 5, 399–408. [DOI] [PMC free article] [PubMed] [Google Scholar]
- Wei G.; Shea J.-E. (2006) Effects of solvent on the structure of the Alzheimer amyloid-β(25–35) peptide. Biophys. J. 91, 1638–1647. [DOI] [PMC free article] [PubMed] [Google Scholar]
- Wei G.; Shea J.-E. (2006) Effects of solvent on the structure of the Alzheimer amyloid-β(25–35) peptide. Biophys. J. 91, 1638–1647. [DOI] [PMC free article] [PubMed] [Google Scholar]
- Sato K.; Wakamiya A.; Maeda T.; Noguchi K.; Takashima A.; Imahori K. (1995) Correlation among secondary structure, amyloid precursor protein accumulation, and neurotoxicity of amyloid beta(25–35) peptide as analyzed by single alanine substitution. J. Biochem. 118, 1108–1111. [DOI] [PubMed] [Google Scholar]
- Shanmugam G.; Jayakumar R. (2004) Structural analysis of amyloid beta peptide fragment (25–35) in different microenvironments. Biopolymers 76, 421–434. [DOI] [PubMed] [Google Scholar]
- D’Ursi A.-M.; Armenante M.-R.; Guerrini R.; Salvadori S.; Sorrentino G.; Picone D. (2004) Solution structure of amyloid beta-peptide (25–35) in different media. J. Med. Chem. 12, 4231–4238. [DOI] [PubMed] [Google Scholar]
- Konno T. (2001) Amyloid-induced aggregation and precipitation of soluble proteins: an electrostatic contribution of the Alzheimer’s beta(25–35) amyloid fibril. Biochemistry 40, 2148–2154. [DOI] [PubMed] [Google Scholar]
- Terzi E.; Holzemann G.; Seelig J. (1994) Reversible random coil-beta-sheet transition of the Alzheimer beta-amyloid fragment (25–35). Biochemistry 33, 1345–1350. [DOI] [PubMed] [Google Scholar]
- Bartolini M.; Naldi M.; Fiori J.; Valle F.; Biscarini F.; Nicolau D.-V.; Andrisano V. (2011) Kinetic characterization of amyloid-beta 1–42 aggregation with a multimethodological approach. Anal. Biochem. 414, 215–225. [DOI] [PubMed] [Google Scholar]
- Bartolini M.; Bertucci C.; Bolognesi M.-L.; Cavalli A.; Melchiorre C.; Andrisano V. (2007) Insight into the kinetic of amyloid beta (1–42) peptide self-aggregation: elucidation of inhibitors’ mechanism of action. ChemBioChem 8, 2152–2161. [DOI] [PubMed] [Google Scholar]
- Bartolini M.; Bertucci C.; Cavrini V.; Andrisano V. (2003) beta-Amyloid aggregation induced by human acetylcholinesterase: inhibition studies. Biochem. Pharmacol. 65, 407–416. [DOI] [PubMed] [Google Scholar]
- De Kimpe L.; Scheper W. (2010) From alpha to omega with Abeta: targeting the multiple molecular appearances of the pathogenic peptide in Alzheimer’s disease. Curr. Med. Chem. 17, 198–212. [DOI] [PubMed] [Google Scholar]
- Harrison R.-S.; Sharpe P.-C.; Singh Y.; Fairlie D.-P. (2007) Amyloid peptides and proteins in review. Rev. Physiol. Biochem. Pharmacol. 159, 1–77. [DOI] [PubMed] [Google Scholar]
- Sgarbossa A.; Buselli D.; Lenci F. (2008) In vitro perturbation of aggregation processes in b-amyloid peptides: A spectroscopic study. FEBS Lett. 582, 3288–3292. [DOI] [PubMed] [Google Scholar]
- Fezoui Y.; Hartley D.-M.; Harper J.-D.; Khurana R.; Walsh D.-M.; Condron M.-M.; Selkoe D.-J.; Lansbury P.-T.; Fink A.-L.; Teplo D.-B. (2000) An improved method of preparing the amyloid P-protein for fibrillogenesis and neurotoxicity experiments. Amyloid 7, 166–178. [DOI] [PubMed] [Google Scholar]
- Drake A.-F.; Siligardi G.; Gibbons W.-A. (1988) Reassessment of the electronic circular dichroism criteria for random coil conformations of poly(L-lysine) and the implications for protein folding and denaturation studies. Biophys. Chem. 31, 143–146. [DOI] [PubMed] [Google Scholar]
- Siligardi G.; Drake A.-F. (1995) The Importance of Extended Conformations and, in Particular, the PII Conformation for the Molecular Recognition of Peptides. Biopolymers 37, 281–292. [DOI] [PubMed] [Google Scholar]
- LeVine H. 3rd. (1993) Thioflavine T interaction with synthetic Alzheimer’s disease beta-amyloid peptides: detection of amyloid aggregation in solution. Protein Sci. 2, 404–410. [DOI] [PMC free article] [PubMed] [Google Scholar]
- Groenning M. (2010) Binding mode of Thioflavin T and other molecular probes in the context of amyloid fibrils-current status. J Chem Biol. 3, 1–18. [DOI] [PMC free article] [PubMed] [Google Scholar]
- Krebs M.-R.; Bromley E.-H.; Donald A.-M. (2005) The binding of thioflavin-T to amyloid fibrils: localisation and implications. J. Struct. Biol. 149, 30–37. [DOI] [PubMed] [Google Scholar]
- Biancalana M.; Koide S. (2010) Molecular Mechanism of Thioflavin-T Binding to Amyloid Fibrils. Biochim. Biophys. Acta 1804, 1405–1412. [DOI] [PMC free article] [PubMed] [Google Scholar]
- Fezoui Y.; Teplow D.-B. (2002) Kinetic studies of amyloid beta-protein fibril assembly. Differential effects of alpha-helix stabilization. J. Biol. Chem. 277, 36948–36954. [DOI] [PubMed] [Google Scholar]
- Harper J.-D.; Lansbury P.-T. (1997) Models of amyloid seeding in Alzheimer’s disease and scrapie: mechanistic truths and physiological consequences of the time-dependent solubility of amyloid proteins. Annu. Rev. Biochem. 66, 385–407. [DOI] [PubMed] [Google Scholar]
- Esler W.-P.; Stimson E.-R.; Fishman J.-B.; Ghilardi J.-R.; Vinters H.-V.; Mantyh P.-W.; Maggio J.-E. (1999) Stereochemical specificity of Alzheimer’s disease beta-peptide assembly. Biopolymers 49, 505–514. [DOI] [PubMed] [Google Scholar]
- Morgan C.; Colombres M.; Nunez M.-T.; Inestrosa N.-C. (2004) Structure and function of amyloid in Alzheimer’s disease. Prog. Neurobiol. 74, 323–349. [DOI] [PubMed] [Google Scholar]
- Ono K.; Li L.; Takamura Y.; Yoshiike Y.; Zhu L.; Han F.; Mao X.; Ikeda T.; Takasaki J.; Nishijo H.; Takashima A.; Teplow D.-B.; Zagorski M.-G; Yamada M. (2012) Phenolic compounds prevent amyloid β-protein oligomerization and synaptic dysfunction by site-specific binding. J. Biol. Chem. 287, 14631–14643. [DOI] [PMC free article] [PubMed] [Google Scholar]
- DeToma A.-S.; Choi J.-S; Braymer J.-J; Lim M.-H. (2011) Myricetin: a naturally occurring regulator of metal-induced amyloid-β aggregation and neurotoxicity. ChemBioChem 12, 1198–1201. [DOI] [PubMed] [Google Scholar]
- Ono K.; Yoshiike Y.; Takashima A.; Hasegawa K.; Naiki H.; Yamada M. (2003) Potent anti-amyloidogenic and fibril-destabilizing effects of polyphenols in vitro: implications for the prevention and therapeutics of Alzheimer’s disease. J. Neurochem. 87, 172–181. [DOI] [PubMed] [Google Scholar]
- Shimmyo Y.; Kihara T.; Akaike A.; Niidome T.; Sugimoto H. (2008) Multifunction of myricetin on A beta: neuroprotection via a conformational change of A beta and reduction of A beta via the interference of secretases. J. Neurosci. Res. 86, 368–377. [DOI] [PubMed] [Google Scholar]
- Porat Y.; Abramowitz A.; Gazit E. (2006) Inhibition of amyloid fibril formation by polyphenols: structural similarity and aromatic interactions as a common inhibition mechanism. Chem. Biol. Drug. Des. 67, 27–37. [DOI] [PubMed] [Google Scholar]
- Re F.; Airoldi C.; Zona C.; Masserini M.; La Ferla B.; Quattrocchi N.; Nicotra F. (2010) Beta amyloid aggregation inhibitors: small molecules as candidate drugs for therapy of Alzheimer’s disease. Curr. Med. Chem. 17, 2990–3006. [DOI] [PubMed] [Google Scholar]
- Ono K.; Hasegawa K.; Naiki H.; Yamada M. (2004) Curcumin has potent anti-amyloidogenic effects for Alzheimer’s beta-amyloid fibrils in vitro. J. Neurosci. Res. 75, 742–750. [DOI] [PubMed] [Google Scholar]
- Narlawar R.; Pickhardt M.; Leuchtenberger S.; Baumann K.; Krause S.; Dyrks T.; Weggen S.; Mandelkow E.; Schmidt B. (2008) Curcumin-derived pyrazoles and isoxazoles: Swiss army knives or blunt tools’ for Alzheimer’s disease?. ChemMedChem 3, 165–172. [DOI] [PubMed] [Google Scholar]
- Reinke A.-A.; Gestwicki J.-E. (2007) Structure-activity relationships of amyloid beta-aggregation inhibitors based on curcumin: influence of linker length and flexibility. Chem Biol. Drug. Des 70, 206–215. [DOI] [PubMed] [Google Scholar]
- Yanagisawa D.; Shirai N.; Amatsubo T.; Taguchi H.; Hirao K.; Urushitani M.; Morikawa S.; Inubushi T.; Kato M.; Kato F.; Morino K.; Kimura H.; Nakano I.; Yoshida C.; Okada T.; Sano M.; Wada Y.; Wada K.; Yamamoto A.; Tooyama I. (2010) Relationship between the tautomeric structures of curcumin derivatives and their Abeta-binding activities in the context of therapies for Alzheimer’s disease. Biomaterials 31, 4179–4185. [DOI] [PubMed] [Google Scholar]
- Airoldi C.; Zona C.; Sironi E.; Colombo L.; Messa M.; Aurilia D.; Gregori M.; Masserini M.; Salmona M.; Nicotra F.; La Ferla B. (2011) Curcumin derivatives as new ligands of Aβ peptides. J. Biotechnol. 156, 317–324. [DOI] [PubMed] [Google Scholar]
- Malmo C.; Vilasi S.; Iannuzzi C.; Tacchi S.; Cametti C.; Irace G.; Sirangelo I. (2006) Tetracycline inhibits W7FW14F apomyoglobin fibril extension and keeps the amyloid protein in a pre-fibrillar, highly cytotoxic state. FASEB J. 20, 346–347. [DOI] [PubMed] [Google Scholar]
- Forloni G.; Colombo L.; Girola L.; Tagliavini F.; Salmona M. (2001) Anti-amyloidogenic activity of tetracyclines: studies in vitro. FEBS Lett. 487, 404–407. [DOI] [PubMed] [Google Scholar]
- Sirangelo I.; Irace G. (2010) Inhibition of aggregate formation as therapeutic target in protein misfolding diseases: effect of tetracycline and trehalose. Expert. Opin. Ther. Targets 14, 1311–1321. [DOI] [PubMed] [Google Scholar]
- Airoldi C.; Colombo L.; Manzoni C.; Sironi E.; Natalello A.; Doglia S.-M.; Forloni G.; Tagliavini F.; Del Favero E.; Cantù L.; Nicotra F.; Salmona M. (2011) Tetracycline prevents Aβ oligomer toxicity through an atipical supramolecular interaction. Org. Biomol. Chem. 9, 463–472. [DOI] [PubMed] [Google Scholar]
- Riviere C.; Richard T.; Quentin L.; Krisa S.; Merillon J.-M.; Monti J.-P. (2007) Inhibitory activity of stilbenes on Alzheimer’s β-amyloid fibrils in vitro. Bioorg. Med. Chem. 15, 1160–1167. [DOI] [PubMed] [Google Scholar]
- Riviere C.; Papastamoulis Y.; Fortin P.-Y.; delchier N.; Andriamanarivo S.; Waffo-Teguo P.; Kapche G.-D.-W.-F.; Amira-Guebalia H.; Delaunay J.-C.; Merillon J.-M.; Richard T.; Monti J.-P. (2010) New stilbene dimers against amyloid fibril formation. Bioorg. Med. Chem. Lett. 20, 3441–3442. [DOI] [PubMed] [Google Scholar]
- Hess B.; Kutzner C.; van der Spoel D.; Lindahl E. (2008) GROMACS 4: Algorithms for Highly Efficient, Load-Balanced, and Scalable Molecular Simulation. J. Chem. Theory Comput. 4, 435–447. [DOI] [PubMed] [Google Scholar]
- Duan Y.; Wu C.; Chowdhury S.; Lee M.-C.; Xiong G.; Zhang W.; Yang R.; Cieplak P.; Luo R.; Lee T.; Caldwell J.; Wang J.; Kollman P. (2003) A point-charge force field for molecular mechanics simulations of proteins based on condensed-phase quantum mechanical calculations. J. Comput. Chem. 24, 1999–2012. [DOI] [PubMed] [Google Scholar]
- Wang J.; Wolf R.-M.; Caldwell J.-W.; Kollman P.-A.; Case. D.-A. (2004) Development and testing of a general AMBER force field. J. Comput. Chem. 25, 1157–1174. [DOI] [PubMed] [Google Scholar]
- Hess B.; Bekker H.; Berendsen H.-J.-C.; Fraaije J.-G.-E.-M. (1997) LINCS: A linear constraint solver for molecular simulations. J. Comput. Chem. 18, 1463–1472. [Google Scholar]
- Darden T.; York D.; Pedersen L. (1993) Particle mesh Ewald: An N_log(N) method for Ewald sums in large systems. J. Chem. Phys. 98, 10089–10092. [Google Scholar]
- Essmann U.; Perera L.; Berkowitz M.-L.; Darden T.; Lee H.; Pedersen L.-G. (1995) A smooth particle mesh ewald potential. J. Chem. Phys. 103, 8577–8592. [Google Scholar]