Abstract
A method was developed to perform real-time analysis of cytosolic pH of arbuscular mycorrhizal fungi in culture using dye and ratiometric measurements (490/450 nm excitations). The study was mainly performed using photometric analysis, although some data were confirmed using image analysis. The use of nigericin allowed an in vivo calibration. Experimental parameters such as loading time and concentration of the dye were determined so that pH measurements could be made for a steady-state period on viable cells. A characteristic pH profile was observed along hyphae. For Gigaspora margarita, the pH of the tip (0–2 μm) was typically 6.7, increased sharply to 7.0 behind this region (9.5 μm), and decreased over the next 250 μm to a constant value of 6.6. A similar pattern was obtained for Glomus intraradices. The pH profile of G. margarita germ tubes was higher when cultured in the presence of carrot (Daucus carota) hairy roots (nonmycorrhizal). Similarly, extraradical hyphae of G. intraradices had a higher apical pH than the germ tubes. The use of a paper layer to prevent the mycorrhizal roots from being in direct contact with the medium selected hyphae with an even higher cytosolic pH. Results suggest that this method could be useful as a bioassay for studying signal perception and/or H+ cotransport of nutrients by arbuscular mycorrhizal hyphae.
AM fungi are obligate biotrophs that have lived symbiotically with plants since the beginning of terrestrial plant evolution (Simon et al., 1993; Taylor, 1995). This common history of a mutualistic relationship is remarkably long and the partners have developed a high degree of interdependency (Smith and Gianinazzi-Pearson, 1988). Specific signals are exchanged as part of a subtle and complex cellular and molecular communication (Koide and Schreiner, 1992; Bonfante and Perotto, 1995).
At the early stages of fungal development, compounds such as CO2 and/or plant root exudates related to the environment have been shown to stimulate spore germination and hyphal growth (Elias and Safir, 1987; Bécard and Piché, 1989a, 1989b; Gianinazzi-Pearson et al., 1989; Nair et al., 1991; Giovannetti et al., 1993a, 1993b). Since the germ tube has to recognize and reach the potential host root, signal compounds exuded from the root are also thought to be involved in the induction of specific morphological structures characterized by a distinctive hyphal branching (Giovannetti et al., 1993b). These structures have been called “arbuscule-like structures” and “pre-infection fan-like structures” by Mosse and Hepper (1975) and Powell (1976), respectively, and may be necessary for the differentiation of appressoria on the root surface from secondary apices.
The subsequent fungal penetration and colonization of the root are crucial steps for ensuring fungal survival, because the germ tube autonomy is mainly limited by the carbon reserves of the propagule (Bécard and Piché, 1989a). These steps involve complex and intimate cellular and molecular events (Bonfante and Perotto, 1995) that are partially under the control of the plant. Regarding the extraradical phase, it has also been observed that fungal growth and spore production could be stimulated when occurring far from the roots, as shown in the dual-compartment Petri dish culture system for Glomus intraradices and Glomus aggregatum on carrot (Daucus carota) hairy roots (St-Arnaud et al., 1996). These observations suggest that host roots can also produce and release into the environment chemicals inhibiting spore formation. Thus, the entire life cycle of AM fungi, from spore germination to spore production, is under the control of regulatory compounds of plant origin.
Published studies of AM fungal responses to various chemical or plant factors have always used criteria such as hyphal elongation, morphology, and propagule production and, therefore, have required days to months to record data. We explored the hypothesis that morphological or growth responses of the fungus to any new environment are associated with immediate and observable intracellular events. In this work we evaluated intracellular pH in AM fungi as a potential physiological marker, because intracellular pH is a key parameter involved in a large number of cellular activities (Kurkdjian and Guern, 1989).
In terms of metabolism, pH regulates enzyme activity (Yoshida, 1994) and affects the solubility and transport of solutes through the cytosol (Agutter et al., 1995). In mammalian cells cytoplasmic pH can also be a second messenger (Kurkdjian and Guern, 1989, and refs. therein); for example, the induction of protein phosphorylation, protein synthesis, immediate early gene expression, and cellular proliferation were the result of intracellular pH modulation in hamster embryo cells (Isfort et al., 1993). Similar observations have been made in several fungi. Saccharomyces cerevisiae exhibited a direct relationship between its global intracellular pH and viability (Imai and Ohno, 1995). Harold (1994) provided evidence that proton ions could act at fungal apices as “localized signal-to-trigger cytoplasmic actions.” Intracellular alkalinization is required for conidiation of Penicillium cyclopium (Roncal et al., 1993). Recently, it was proposed that apical alkaline pH gradients may be integral to hyphal extension in fungi (Robson et al., 1996).
The regulation of intracellular pH mainly depends on the activity of H+-ATPases. This proton-pumping activity ensures the maintenance of electrochemical proton gradients needed for nutrient uptake in plant and fungal cells. Electrobiological studies of cells growing apically have been used to propose a proton “circuitry” model that generates a characteristic internal pH profile as is observed, for example, in hyphal apices (Harold, 1994, and refs. therein). This pH profile has been suggested to be maintained by the entry of proton ions via H+ cotransport symports at the tip and by proton excretion by ATPase pumps beyond the tip. Several studies of membrane transport of various nutrients are in agreement with this mechanism (Beever and Burns, 1980; Novak et al., 1990; Brandao et al., 1992).
Recent developments about the use of fluorescent molecules showing high affinity for specific cell constituents (e.g. organelles and ions) opened the way to a novel, in vivo, real-time experimental approach (Tsien, 1989). Widely used for mammalian cell studies, these cytochemical probes have greatly helped to explain signal-transduction processes (Tsien, 1989; Alberts et al., 1994).
Our objectives were, first, to develop an in vivo method for measuring intracellular pH in AM fungi using the proton-specific cytochemical probe BCECF-AM (Molecular Probes, Eugene, OR). Second, different culture conditions or stimulatory states were imposed for the evaluation of intracellular pH as a sensitive physiological marker of living fungal cells.
MATERIALS AND METHODS
Biological Materials
Spores of Gigaspora margarita Becker & Hall (DAOM 194757; deposited at the Biosystematic Research Center, Ottawa, Canada) were obtained from pot cultures with leek plants in a mineral substrate (Terragreen, Netco, Paris, France). Long-Ashton liquid medium was added weekly. Spores were harvested after 6 to 8 weeks of culture, wet sieved, and surface sterilized as described by Bécard and Fortin (1988). Before use, spores were dispersed on 0.1% MgSO4 solidified by 0.4% Phytagel (Sigma) and stored at 4°C to prevent spore germination.
Spores of Glomus intraradices Schenck & Smith were produced in vitro on carrot (Daucus carota) hairy roots (Bécard and Fortin, 1988). Cultures were originally started from soil-isolated spores, as described by Chabot et al. (1992). Subculture of mycorrhizal roots was performed every 2 to 3 months by transferring colonized root pieces to fresh solid M medium (Bécard and Fortin, 1988) on one side of two-compartment Petri dishes (9 cm in diameter; St-Arnaud et al., 1996). Petri dishes were placed in the dark at 26 ± 1°C. The spores were extracted from the distal side of the two-compartment Petri dishes (St-Arnaud et al., 1996) after 3 to 4 months of culture. The gel was solubilized aseptically in a blender (400 rotations/min) using 0.01 m citrate buffer at pH 6.0 and 25°C (Doner and Bécard, 1991). The spores were collected in an autoclaved sieve (53 μm), rinsed three times, and stored in sterile, distilled water at 4°C to prevent spore germination.
Cultures
Plastic Petri dishes (5 cm in diameter) filled with 4 mL of solidified (0.25% Phytagel) M medium were used as culture systems and sample chambers for microscopy. Two to four spores of G. margarita per Petri dish were placed under sterile conditions inside of the gel using a scalpel blade. The negative geotropism of G. margarita germ tubes (Watrud et al., 1978) was exploited to direct hyphal growth toward the bottom of the dish. By incubating the dishes −10° from the vertical (bottom up), the germ tubes invariably grew straight against the plastic bottom of the dishes, in an optimal position for high-magnification microscopic observations. Incubations were made in a 2% CO2 incubator at 32°C. When nonmycorrhizal carrot hairy roots were added, they were placed at the opposite side of the spores so that germ tubes were growing toward them.
Spores of G. intraradices were transferred in similar dishes with a sterile, 200-μL pipette and then inserted into the gel matrix using a scalpel blade under a binocular installed in a sterile laminar flow hood. The dishes were incubated right-side-up in the same CO2 incubator. Experiments on G. intraradices extraradical growth were prepared by inoculating, in the 5-cm dishes, a mycorrhizal carrot hairy root approximately 2 cm in length obtained from the dual-compartment cultures (St-Arnaud et al., 1996). The dishes were incubated (26 ± 1°C) for a minimum of 5 d to let the root grow and the fungus form extraradical hyphae. In some experiments, direct contact of the mycorrhizal root with the solid medium was prevented by first laying down a paper filter (no. 4, Whatman) on the gel. The porosity of the filter was high enough to let extraradical hyphae grow through it.
In one experiment, a 5 mm phosphate buffer was included in the M medium to control the external pH of the fungal cultures. It was also added aseptically (in a liquid form) by successive rinsing 4 h before microscopic observation to impose late-pH modifications of the solid culture medium.
BCECF-AM Dye Loading
BCECF was used in its “cell-permeant” form, the acetoxymethyl ester (BCECF-AM). As such, the molecule is nonfluorescent and hydrophobic and has the ability to diffuse freely through the cell membrane. Once inside the cell the acetoxymethyl group is hydrolyzed by intracellular esterases. The molecule then becomes hydrophilic and fluoresces when excited. From time 0, when the dye is added to the dishes, the fluorescence kinetics are the result of dye loading and esterase activities in the cell. BCECF-AM stock solutions were prepared at 10 mm (50 μg of BCECF-AM in 8.4 μL of anhydrous DMSO) and stored at −15°C. Loading solutions of BCECF-AM were prepared by initially adding 0.8 μL of a stock solution (20% in DMSO, Pluronic F-127, Molecular Probes) to 4 mL of liquid M medium. Then, 0.8 μL of the BCECF-AM stock solution was added to the 4 mL of solution and vortexed for 15 s, for a final BCECF-AM concentration of 2 μm.
In the absence of Pluronic F-127 solution, BCECF-AM diffused poorly through the aqueous gel. Four milliliters of the dye solution was added to the gel surface so that BCECF-AM, after equilibrium, was at a final concentration of 1 μm. Experimental conditions were fixed at a final concentration of 1 μm BCECF-AM to keep a sublethal DMSO content (1:104, v/v). A high DMSO content (1:102, v/v) had a deleterious effect on hyphal growth. For G. margarita, the dishes were then incubated (45 min) upside down in the CO2 incubator to maintain the hyphal tips against the bottom. A modified Petri dish cover was used to fit the upside-down dishes and prevent any leaks. For G. intraradices, the dishes were normally incubated right-side-up during staining (45 min). In all cases, dye solutions were kept in the dishes during microscopic measurements to allow continuous loading of the growing cells. This precaution provoked no higher fluorescence background, indicating that no degradation of BCECF-AM or external esterase activity occurred under our experimental conditions.
Excitation Lights and Photometric Analysis
A dual-monochromatic light source (Amko LTI, Tornesch, Germany) was connected by fiber optics to an inverted microscope (Leitz DMIRB/E, Leica). For dual-excitation experiments, lights were set at a bandwidth of 2 nm. Appropriate dichroic (510 nm) and barrier (520 nm) filters and excitation (450 and 490 nm) required for the pH indicator BCECF were used to optimize emission light. Emission light intensities were read in counts per second with a photomultiplier connected to a computer that discriminates intensities emitted from both excitation sources (Amko LTI). The photomultiplier was equipped with an adjustable diaphragm to limit emission light measurements to a selected area. This window was adjusted to fit into the smallest hyphal diameters (3 μm) when using a 63× objective (PL Fluotar L 63/0.7, Leica).
The software (GEM, Amko LTI) was set for one datum sample per second. One observation (data point) represented the average of 10 to 30 consecutive records. Since the fluorescence measurements were made on live, elongating cells (1–5 μm/min for G. margarita), longer observation times could not be used without experiencing a change in the observed hyphal zone. Excitation spectra of BCECF were obtained with our optical system and proved to be similar to published data (Haugland, 1992), with an isoexcitation wavelength of 450 nm and a maximum light emission at 490 nm excitation. The two monochromatic light sources were therefore set at 450 and 490 nm. The ratios of the corresponding emitted fluorescence, proportional to H+ concentrations, were automatically calculated (one datum point per second) by the computer. The conversion into pH values was obtained from the ratiometric calibration curves (see below). The emission signals corresponding to 450 nm excitation were useful data for the experiments of dye loading because they are pH independent.
Image Analysis
Microscopic images (×63) were acquired with a cooled, extended, Isis-intensified charge-coupled device camera system (Photonic Science, East Sussex, UK) and were digitized and analyzed using Image-Pro Plus software (Media Cybernetics, Silver Spring, MD). Fluorescence images at 490 and 450 nm excitation were acquired successively within 10 s. The intensifier gain of the camera control was set using the 490-nm excited images (more fluorescent) to optimize the signal-to-noise ratio and to avoid gray-level saturation. The average background value of each digitized fluorescence image was calculated and subtracted prior to obtaining the ratio image (490/450 nm). Hyphal outlines of ratio images were precisely determined using the corresponding images immediately acquired under visible light. Visually, the pH profile along the hypha was expressed by transforming the gray scale of the ratio image into pseudocolors and quantitatively by showing the average pixel values of a band of seven pixel columns along the length of the hypha.
Ratiometric Signal Calibration
Transformation of the ratiometric values into pH values was made only for photometrically acquired data. It was obtained in vitro and in vivo. In vitro, an eight-well glass chamber slide was used and filled with 200 μL of 0.1 m sodium phosphate buffer and 0.8 μL of a BCECF acid solution (in pure water), for a final BCECF concentration of 1 μm. A range of pH values from 5.17 to 7.95 was imposed.
For intracellular (in vivo) signal calibration, the eight chambers of the same slide were each filled with 200 μL of liquid M medium, inoculated with two to four G. margarita spores per well, and placed in the CO2 incubator. Once germ tubes were more than one spore-diameter long (i.e. >200 μm), 40 μL of a 10 μm BCECF-AM-Pluronic F-127 solution was added to each cell for staining. After 45 min, 100 μL was removed and 200 μL of a 150 mm potassium phosphate buffer adjusted at the appropriate pH was added to each well. The presence of potassium within the buffer did not modify the desirable pH. After 10 min, pH equilibrium was reached within the liquid medium. Then, 30 μL of a 50 μm nigericin-Pluronic F-127 solution, a potassium-/H+-specific ionophore (Pressman, 1976), was prepared as described for the BCECF-AM solution from a 1.5 mm stock solution (in DMSO) and added to each well for a final concentration of 4.4 μm. This ionophore clamps intracellular pH to extracellular pH and requires potassium ions to be efficient without mortally depolarizing the cell membrane (Pressman, 1976). This procedure minimized the DMSO final content to 0.3% and allowed intracellular pH to stabilize at an extracellular value within 30 min. For extended periods experimental conditions seemed to fatally disorganize the fungal cell. Calibration experiments made with hyphae growing on solid medium gave similar results.
RESULTS
Typical Apical Cytosolic pH Profile
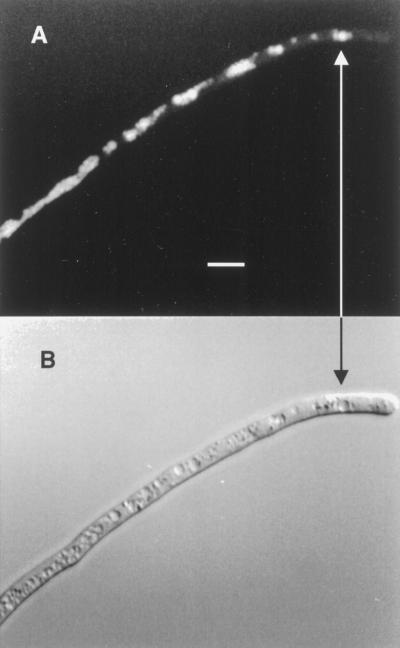
For G. margarita, intracellular pH was exclusively measured in the germ tube, and for G. intraradices it was measured in the main hyphae, since negligible fluorescence was measured at secondary apices. Fungi under investigation did not exhibit any autofluorescence. Under the conditions used, BCECF proved not to alter the viability of hyphae, since these could still be growing several days after staining. Healthy and growing hyphae showed diffuse fluorescence at excitation wavelengths of 450 and 490 nm, indicating the absence of dye sequestration (Fig. 1). In contrast, localized and intense fluorescent spots with pH values of 4.0 to 5.0 were visible in senescing hyphae (Fig. 2). pH measurements were considered to be mainly cytosolic (as discussed in Discussion).
Figure 1.
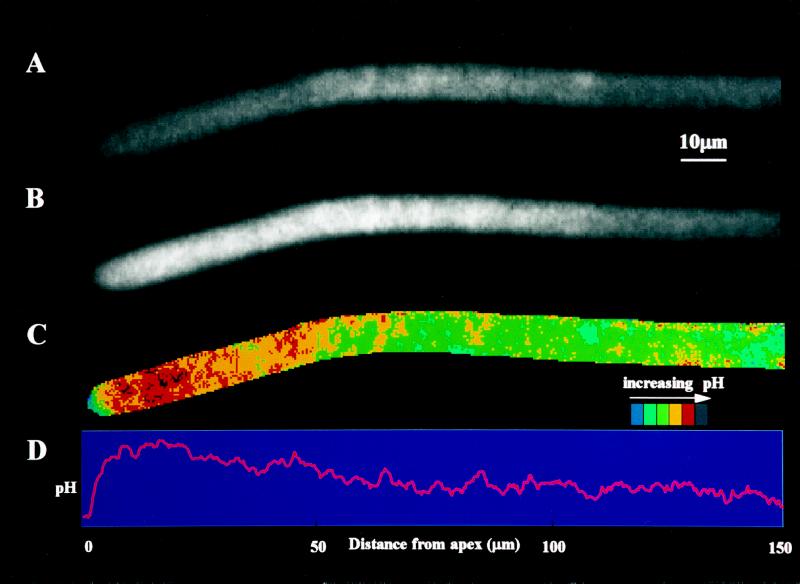
Intracellular pH distribution within a growing germ tube of G. margarita loaded with the pH indicator BCECF and measured by fluorescence ratio imaging. A, Fluorescence image at 450 nm excitation. B, Same fluorescence image at 490 nm excitation. C, Ratio of the two previous images (490/450 nm) as a pseudocolor image showing the pH variations along the hypha. D, Same ratio image representing the average pixel values along the length of the hypha; these values are proportional to pH values.
Figure 2.
Senescing G. margarita germ tube 3 h after BCECF-AM loading into a lethal DMSO concentration. A, BCECF fluorescence microscopy (450 nm excitation). B, Same hypha obtained by differential interference contrast microscopy. The fluorescence localizes in cytoplasmic areas not yet necrosed (arrow). Bar = 10 μm.
Senescence was always associated with a rapid process of necrosis, in which no more cytoplasmic streaming could be seen and the necrotic area exhibited a brown coloration. Before senescence of the hyphae was completed, some active cytoplasmic regions had already accumulated the dye. Already dead or nongrowing hyphae showed no fluorescence, probably because of the absence of esterase activity. Thus, only uniformly fluorescent hyphae were used for experiments.
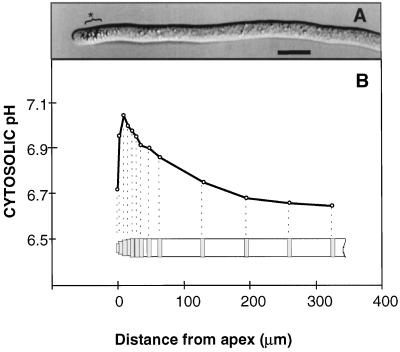
A typical profile of pH distribution could be observed at the apical region of hyphae (Fig. 3B). This profile was confirmed by image analysis (Fig. 1). Photometric analysis was used in the rest of the study because of its greater sensitivity. At the hyphal tip (first 2 μm), a relatively acidic pH was always measured. Within the next 9.5 μm, the pH increased rapidly to more alkaline values and then slowly decreased to more acidic values to reach at the plateau (over 200 μm behind the tip) a value close to that of the tip. This characteristic profile was observed for all hyphae examined.
Figure 3.
G. margarita germ tubes. A, Image obtained by differential interference contrast microscopy. Bar = 10 μm. A group of unidentified organelles is indicated (*). B, Typical pH profile along the hyphal trunk: dotted lines show corresponding selected photometric reading windows for measurement of the fluorescence emitted by the pH indicator BCECF.
In parallel to this typical pH profile, a characteristic organization of the hyphal tips could be observed for G. margarita (G. intraradices hyphal tips were too small for accurate observations under visible light). Associated with actively growing hyphae, a group of 10 to 15 spherical organelles (unidentified) approximately 1 μm in diameter (Fig. 3A) were moving within the cytosol volume and staying between 3 and 25 μm from the apical tip. The acidic region at the tip was always free of these organelles. Staining of living germ tubes with 4',6-diamidino-2-phenylindol showed that these organelles were not nuclei. The first apical nuclei were located 50 μm behind the hyphal tip (data not shown).
Microfluorometric Method Validation
Effect of Dye Concentration
Since the tip is the narrowest part of the hypha, it has a smaller cytoplasmic volume, which results in a lower fluorescence signal. Moreover, this region likely accumulates numerous vesicles required for apical growth and as a result contains less cytosol per unit of volume. For these reasons, the apical fluorescence signals (as given at 450 nm) were always the lowest. As a result, pH measurements in the apical region of hyphae had the lowest signal-to-noise ratio. The acceptable inferior limits for signal-to-noise ratios were evaluated as follows. Fluorescein solutions were gradually added to Petri dishes with G. margarita germ tubes previously loaded with BCECF-AM to artificially increase the fluorescence background. It was verified that signal-to-noise ratios greater than 0.55 were acceptable for reliable measurements and that they were not below this limit at the hyphal tip.
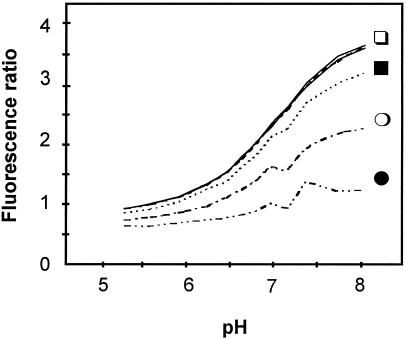
The prerequisite dye concentration for reliable pH measurement was also evaluated. As illustrated in Figure 4, in vitro measurements using diluted, acidic BCECF in phosphate buffers (pH 5.17–7.95) showed that the 490- to 450-nm emission ratios are reliable only for BCECF concentrations of 0.63 μm and greater. Below this concentration, the protonated form of BCECF is overestimated and ratios are underestimated, and this underestimation increases with dye dilution.
Figure 4.
BCECF-AM loading conditions. Fluorescence ratios at 490- and 450-nm excitations of BCECF at varying pH values for the following BCECF acid concentrations (in μm): 0.63, 2.5, and 10 (□); 0.16 (▪); 0.04 (○); and 0.01 (•).
Ratiometric Signal Relationship with Actual pH
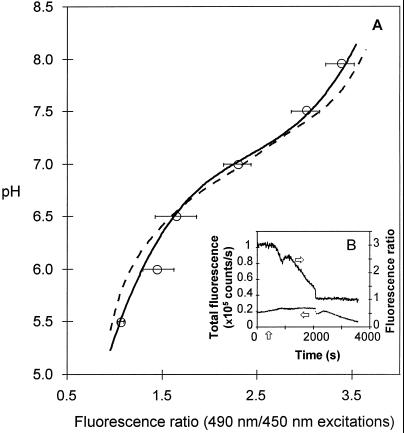
The in vitro and in vivo calibration curves were similar for the physiological pH range of 6.5 to 7.5, as illustrated in Figure 5A. Deviations observed outside of this range could be attributed to a cytosolic buffering capacity. Addition of the phosphate buffer (containing 150 μm potassium chloride) seemed to disorganize the fungal cell, since the characteristic unidentified spherical organelles were no longer concentrated at the apical region, as was normally observed for healthy G. margarita that were growing hyphae. However, no internal signs of cell death occurred before ionophore addition. Once in contact with the ionophore, hyphal progressive necrosis mainly occurred when the external and cytosolic pH were at equilibrium for acidic pH values. Figure 5B illustrates a characteristic and reproducible early cell reaction following the addition of nigericin (external pH 5.0). Whereas intracellular pH decreased slowly, it shows a characteristic transient increase. These cytosolic pH variations were not due to dye bleaching or leaking, because the 450-nm emission fluorescence signal did not significantly change throughout the experiments.
Figure 5.
Fluorescence signal calibration. A, pH-calibration curves. In vitro calibration showing measurements of fluorescence ratios (for 490- and 450-nm excitations) of 1 μm BCECF in sodium phosphate buffer at various pH values (dotted lines) and in vivo calibration showing the same fluorescence ratios measured in G. margarita germ tubes (solid lines) at varying external pH values in the presence of 1 μm BCECF-AM, 90 μm potassium chloride, and 4.4 μm nigericin. Values are means (n = 4–6) (○), with corresponding se bars. Both calibration curves were calculated under polynomial fitting (order 4) from measured data ratios. B, Real-time cell reaction (25 μm from the hyphal tip) of G. margarita loaded with BCECF to nigericin/potassium addition after 300 s (vertical arrow) at external pH 5.0. The fluorescence ratios (right y axis) for 490-/450-nm excitations and total fluorescence (left y axis) at 450-nm excitation are given. Horizontal arrows indicate the corresponding axes of the two curves.
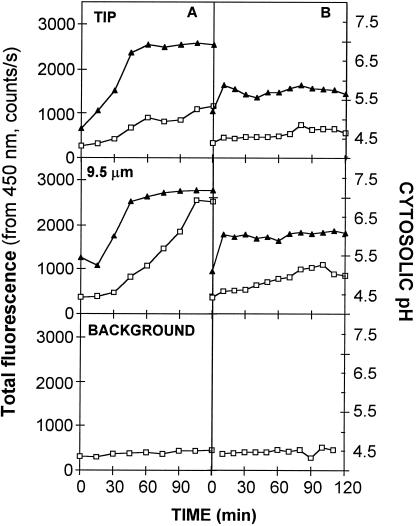
To ensure that the acidity measured at the tip was not an underestimation due to a local, insufficient BCECF concentration, kinetics of BCECF loading were followed at the tip and 9.5 μm behind for G. margarita and G. intraradices (Fig. 6). The kinetics show that pH values stabilize before loading of BCECF is completed. Forty-five minutes of staining for G. margarita and fewer for G. intraradices (perhaps because hyphae have smaller diameter) were necessary for accurate pH measurements. This is true both at the tip and behind. Thus, the staining procedure was standardized to 45 min of hyphal load prior to observation. Once the dye reached the critical concentration, local cytoplasmic movement such as that of the above-mentioned apical organelles, although interfering with both the 450- and 490-nm signal intensities, did not interfere with the ratio measurements.
Figure 6.
Loading kinetics of G. margarita (A) and G. intraradices (B) germ tubes with BCECF-AM at the tip (2 μm) and 9.5 μm behind the tip. ▴, Cytosolic pH; □, total fluorescence at 450-nm excitation. G. intraradices cytosolic pH values are estimations using the calibration relationship established with G. margarita.
Effect of Extracellular pH
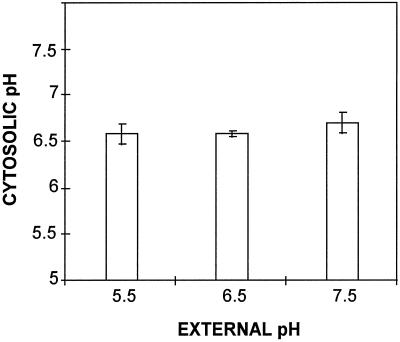
The normal pH of M medium is 5.5 before autoclaving and slightly higher afterward. Experiments with higher pH, buffered at 6.5 and 7.5, did not affect cytosolic pH (Fig. 7). There was no difference observed whether the fungus had grown in the tested medium for several days or whether the pH of the medium was modified 4 h before intracellular pH measurements (not shown). More acidic media (pH 4.0 and 4.5) could not be tested because they caused the formation of two to five successive (over 7 d) short (20–65 μm) germ tubes that were not healthy enough to fluoresce.
Figure 7.
Effect of external pH on cytosolic pH of G. margarita germ tube (tip), measured 4 d after spore germination (n = 10). The external pH was adjusted (with 5 mm sodium phosphate buffer) prior to spore inoculation. Error bars are 95% confidence intervals (se).
AM Fungi Cytosolic pH and Different Physiological States
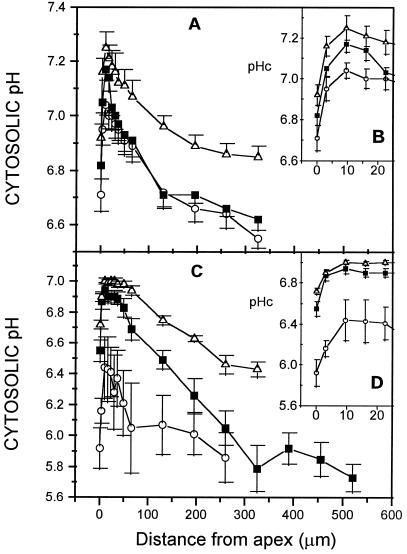
The growth of the G. margarita germ tube was clearly stimulated when cultured in the presence of a root. A significant increase in the number of lateral hyphae was observed, as well as specific “arbuscule-like” structures that are not normally seen in the absence of a root. Under the microscope, apices of growth-stimulated germ tube looked similar to unstimulated tubes in cell organization and diameter (approximately 6.5 μm). However, they showed a significant increase (>95%, Student's t test) of more than 0.2 pH unit (Fig. 8A) of their whole cytosolic pH profile. Cytosolic pH increased from 6.7 ± 0.2 (0–2 μm), 7.0 ± 0.1 (9.5 μm), and 6.6 ± 0.1 (>250 μm) to 6.9 ± 0.2, 7.3 ± 0.2, and 6.9 ± 0.1, respectively. Results with young germ tubes, defined as shorter than one spore diameter, showed intermediate pH values in the first 25-μm region but farther away exhibited a pH similar to the unstimulated, longer hyphae. Morphologically, juvenile germ tubes had larger tube diameters (approximately 8.5 μm).
Figure 8.
Cytosolic pH (pHc) profile in hyphae of G. margarita and G. intraradices under different culture conditions. A, G. margarita juvenile germ tubes defined as hyphae shorter than one spore diameter (n = 8; ▪) and in several-centimeter-long germ tubes growing in the absence (n = 9; ○) or the presence (n = 12; ▵) of a carrot hairy root. B, Magnification of the same curves for the first 20 μm. C, G. intraradices germ tubes (n = 3; ○) and extraradical hypha growing from a mycorrhizal carrot hairy root laid directly on the solid medium (n = 10; ▪) or laid first on a filter paper (n = 7; ▵). D, Magnification of the same curves for the first 20 μm. G. intraradices cytosolic pH values are estimations using the calibration relationship established with G. margarita. Error bars are 95% confidence intervals (se).
Germ tubes of G. intraradices had a small diameter of approximately 3 μm. However, growing hyphae from a mycorrhizal root had larger diameters (approximately 6 μm) in both culture systems on the solid M medium and on the paper support. Germ tubes of this fungus had a pH of 5.9 ± 0.2 at the tip (0–2 μm), 6.4 ± 0.4 behind the tip (9.5 μm), and a plateau of 5.9 ± 0.3 farther away (Fig. 8B). Extraradical hyphae had a significantly higher (>95%, Student's t test) apical cytosolic pH: 6.6 ± 0.2 at the tip and 6.9 ± 0.2 behind the tip (9.5 μm). Nevertheless, the ultimate pH plateau (5.9 ± 0.4) was similar to that of germ tubes. When the mycorrhizal root was separated from the culture medium by a paper filter, hyphae passing through the paper fibers and growing in the solid medium showed a significant increase (>95%, Student's t test) in their distal pH plateau up to 6.4 ± 0.2. Reported pH values for G. intraradices are only estimates and cannot be strictly compared with G. margarita values, since in vivo pH calibration was done with G. margarita hyphae. However, comparisons between G. intraradices pH values are legitimate.
DISCUSSION
Assessment of the Method
The intracellular pH measurements reported in this study were made in coenocytic hyphae characterized by a nonseptate hyphal continuum with highly dynamic cytoplasmic streaming. They were obtained at the photomultiplier with extremely small reading windows (6 μm2 for G. intraradices to 17 μm2 for G. margarita), which could explain the relatively large se values (Fig. 8). These large se values could also be a consequence of dynamic local fluctuations, which were revealed by image analysis (Fig. 1C). However, careful controls were made in this study to assess that the method of intracellular pH measurements was reliable.
The kinetics of BCECF loading (combined with esterase activities) was measured to ensure that pH values were not underestimated (especially at the tip) by insufficient dye concentration (Fig. 6). It was verified that measurements were not biased by optical artifacts such as excessive background. Finally, if external pH had not been the same throughout the tested cultures, they were not responsible for the observed variations of pH profile, since they were shown experimentally not to affect fungal pH (Fig. 7). The same was observed for plant cells within the 4.5 to 7.5 pH range (Gout et al., 1992). To our knowledge, this work shows for the first time the importance of performing kinetic studies of cell loading with BCECF prior to establishing a reliable procedure for photometric or image analyses of intracellular pH.
None of the living hyphae had observable distinct darker or brighter zones (Fig. 1, A and B). The fluorescence was variable but diffuse, with no apparent sequestration. Rapid and selective vacuolization of BCECF has been observed for root-hair cells of maize (Brauer et al., 1994), and Rees et al. (1994) reported similar observations for a wide spectrum of fungal phyla using 6-carboxyfluorescein dye. With the coccolithophore Emiliania huxleyi, Dixon et al. (1989) observed a uniform BCECF fluorescence throughout the cell and discerned two distinct pH zones. Our results suggest that the BCECF-AM dye was preferentially hydrolyzed within the cytosol of the AM fungi.
Loading behavior measured by fluorescence at 450 nm excitation showed a continuous, regular increase in dye hydrolysis (Fig. 6). The significance of this signal kinetics is multiple, because it is the sum of the dye diffusion (within the medium and through the fungal plasma membrane) and the esterase activities. However, pH readings followed a first-order behavior before stabilization to their actual values, suggesting that only one major hydrolysis mechanism was involved, occurring in a unique cell compartment. Moreover, the fungal cell reaction to nigericin addition at acidic external pH was a sudden internal pH increase. It is known that H+-ATPase activities are stimulated by acidic pH. The vacuoles can also help to control cellular pH by sequestration of invading protons (Kurkdjian and Guern, 1989; Gout et al., 1992). If the dye had been located there, vacuolar pH would have shown a decrease instead of an increase. Furthermore, the fluorescence at 450 nm excitation proved not to be directly proportional to the hyphal volume (data not shown), indicating that possible nonloaded volumes were filled by organelles such as vacuoles. Taken together, these observations suggest that the pH values measured were those of the cytosol.
Characteristic pH Profile
Cytosolic pH values were clearly variable, as was observed radially in the hyphae of G. margarita, possibly reflecting local heterogeneity of the cytoplasm (Fig. 1C). Longitudinal pH along hyphae of G. margarita, as shown by image analysis (Fig. 1D) and photometric analysis (Fig. 3B), showed a reproducible, characteristic profile. This typical pH profile was also observed in G. intraradices hyphae (Fig. 8D). The apical acidic gradient suggests that the physiological activity of AM fungi is concentrated at the hyphal tip, as has already been proposed for cells following apical growth (Turian et al., 1985; Jackson and Heath, 1993; Wessels, 1993; Harold, 1994).
The steep pH distribution observed at the hyphal tip could correspond to the steep gradient also observed in various cell activities. For example, the specific apical distribution of the cytoskeleton and vesicles, the calcium gradient, and the cell wall dynamics are all related to apical growth and hyphal morphology (Gooday, 1993; Jackson and Heath, 1993; Wessels, 1993; Bartnicki-Garcia et al., 1995; Kaminskyj and Heath, 1996). The cytosolic apical acidity has also been observed in Neurospora crassa, Achlya bisexualis, Phycomyces blakesleeanus, Penicillium cyclopium, and other nonfungal elongating cells (Turian et al., 1985; Roncal et al., 1993; Harold, 1994). It is thought to be maintained by the activity of plasmalemma H+-ATPases occurring behind the tip.
The proton gradient imposed by this uneven distribution of the proton pumps allows influx of H+, potentially coupled with cotransport of other ions or nutrients, to occur preferentially at the hyphal tip. Working on mycorrhizal interactions, Berbara et al. (1995) showed an inward current at the tip of young G. margarita germ tubes. Since electrical currents are thought to be carried mainly by protons, our results are in agreement with these electrobiological studies. In contrast to our findings and the references cited above, Robson et al. (1996) reported the existence of an alkaline gradient in growing hyphae of N. crassa. They argued that previous work did not use BCECF, a nontoxic, ratiometric dye, and for this reason could have shown artifactual results. Although we used BCECF, our results are in contrast to those of Robson et al. (1996). One hypothesis is that N. crassa hyphae, which exhibited very high extension rates, actually possessed an acidic gradient, but it was so steep that it was undetectable.
Our observations that external acidic pH of 4.0 to 4.5 caused multiple and successive formation of germ tubes with limited growth could be in agreement with the assumption of an ATPase proton-pump regulatory mechanism (Harold, 1994; Berbara et al., 1995). Under these acidic conditions, the germ-tube metabolism may have been energetically insufficient for supporting the alkalinization action of the H+-ATPase pumps (Gout et al., 1992).
Cytosolic pH Is Dependent on Physiological State
The response of G. margarita germinating spores to the presence of transformed carrot roots (or root exudates) expressed in terms of growth stimulation has already been documented (Bécard and Piché, 1989a, 1989b). In the present study the fungal response was observed at the cellular level using intracellular pH as an indicator. Hyphal growth stimulation and the intracellular pH increase are likely to be correlative events, both expressing the presence of root factors involved in some symbiotic process. It remains to be shown how quickly the pH response occurs after the perception of these root factors. Is the pH response a late consequence of the growth stimulation or a prerequisite cellular state before stimulation can occur? The advantage of measuring intracellular pH instead of growth, if the former criterion is an early response, is obvious: It can be utilized for more rapid screening experiments of the root factors and, more importantly, to discover important factors that would not be sufficient by themselves to cause a growth response.
The results obtained with G. intraradices are complementary to the G. margarita results. With this fungus also, hyphal tips in the presence of a root have a higher pH profile. However, they correspond to extraradical extension of intraradical structures and have a symbiotic mode of growth. The use of a filter paper, which prevented direct root contact with the medium, led to an increase of only the nonapical pH value of extraradical growing hyphae. The roots and the fungal hyphae were clearly not in the same physiological state for the two culture systems. With the use of a paper support, roots could be in water and/or nutrient stress, because of minimal surface contact with the nutrient medium. Entrapment of root compounds within the paper fibers could also have occurred, but we did not investigate this possibility. Our results must be considered in relation to the works of St-Arnaud et al. (1996), who observed that growth of extraradical hyphae could be stimulated when hyphae are artificially separated from some hypothetical inhibitory compounds released by the roots.
In a speculative attempt to integrate data obtained with both fungi, our observations can be summarized as follows: (a) the apical region of hyphae presents a typical pH profile: more acidic at the tip, sharply increasing, and then gradually decreasing farther away from the tip; (b) young germ tubes (shorter than 200 μm, G. margarita average spore diameter) exhibited a pH profile that dropped at the tip; (c) the whole pH profile of the germ tube is significantly increased when approaching a compatible host root; (d) extraradical hyphal growth is also associated with a higher pH profile in the apical region of the hyphae; and (e) the pH profile is even higher in extraradical hyphae growing with mycorrhizal roots under water (or nutrient) stress.
More work is required to determine whether fine-cellular mechanisms such as H+-mediated signal transduction or membrane-transport activation were involved in these various fungal responses. Our results show that intracellular pH is an interesting candidate for a physiological marker of the fungal symbiotic state. The experimental setup using photometric or image analysis proved to be suitable to study live communication between the organisms in a plant-fungus interaction. It will be used for further investigations and attempts to answer the above questions.
ACKNOWLEDGMENTS
The authors are grateful to Drs. C. Chavarie and J. Archambault as project initiators, to Dr. M. Buschmann for reviewing this document, and to M. Buée and R.D. Williams for their technical help.
Abbreviation:
- AM
arbuscular mycorrhizal
- BCECF
2',7'-bis-(2-carboxyethyl)-5(and-6)-carboxyfluorescein
- BCECF-AM
acetoxymethyl ester of BCECF
Footnotes
Scholarships to M.J. and M.G. supporting their stay in Toulouse were provided by the Fonds pour la formation de Chercheurs et l'Aide à la Recherche (contract no. 94-CI-0117), and the Conseil Régional de Midi-Pyrénée (contract no. 9300417) funded the spectrofluorometric microscope used in this study.
LITERATURE CITED
- Agutter PS, Malone PC, Wheatley DN. Intracellular transport mechanisms: a critique of diffusion theory. J Theor Biol. 1995;176:261–272. doi: 10.1006/jtbi.1995.0196. [DOI] [PubMed] [Google Scholar]
- Alberts B, Bray D, Lewis J, Raff M, Roberts K, Watson JD (1994) Cell signaling. In B Alberts, D Bray, J Lewis, M Raff, K Roberts, JD Watson, eds, Molecular Biology of the Cell, Ed 3. Garland Publishing, New York, pp 721–787
- Bartnicki-Garcia S, Bartnicki DD, Gierz G, Lopez-Franco R, Bracker CE. Evidence that spitzenkörper behavior determines the shape of a fungal hypha: a test of the hyphoid model. Exp Mycol. 1995;19:153–159. doi: 10.1006/emyc.1995.1017. [DOI] [PubMed] [Google Scholar]
- Bécard G, Fortin JA. Early events of vesicular-arbuscular mycorrhiza formation on Ri T-DNA transformed roots. New Phytol. 1988;108:211–218. doi: 10.1111/j.1469-8137.1988.tb03698.x. [DOI] [PubMed] [Google Scholar]
- Bécard G, Piché Y. New aspects on the acquisition of biotrophic status by a vesicular-arbuscular mycorrhizal fungus, Gigaspora margarita. New Phytol. 1989a;112:77–83. [Google Scholar]
- Bécard G, Piché Y. Fungal growth stimulation by CO2 and root exudates in vesicular-arbuscular mycorrhizal symbiosis. Appl Environ Microbiol. 1989b;55:2320–2325. doi: 10.1128/aem.55.9.2320-2325.1989. [DOI] [PMC free article] [PubMed] [Google Scholar]
- Beever RE, Burns DJW. Phosphorus uptake, storage and utilization by fungi. In: Woolhouse HW, editor. Advances in Botanical Research, Vol 8. New York: Academic Press; 1980. pp. 127–219. [Google Scholar]
- Berbara RLL, Morris BM, Fonseca HMAC, Reid B, Gow NAR, Daft MJ. Electrical currents associated with arbuscular mycorrhizal interactions. New Phytol. 1995;129:433–438. [Google Scholar]
- Bonfante P, Perotto S. Tansley review no. 82: strategies of arbuscular mycorrhizal fungi when infecting host plants. New Phytol. 1995;130:3–21. [Google Scholar]
- Brandao RL, Castro IM, Passos JB, Nicoli JR, Thevelein JM. Glucose-induced activation of the plasma membrane H+-ATPase in Fusarium oxysporum. J Gen Microbiol. 1992;138:1579–1586. doi: 10.1099/00221287-138-8-1579. [DOI] [PubMed] [Google Scholar]
- Brauer D, Otto J, Tu SI. Selective accumulation of the fluorescent pH indicator, BCECF-AM, in vacuoles of maize root-hair cells. J Plant Physiol. 1994;145:257–261. [Google Scholar]
- Chabot S, Bécard G, Piché Y. Life cycle of Glomus intraradix in root-organ culture. Mycologia. 1992;84:315–321. [Google Scholar]
- Dixon GK, Brownlee C, Merrett MJ. Measurement of internal pH in the coccolithophore Emiliania huxleyi using 2′,7′-bis-(-2-carboxyethyl)-5(and-6)-carboxyfluorescein acetoxymethylester and digital imaging microscopy. Planta. 1989;178:443–449. doi: 10.1007/BF00963813. [DOI] [PubMed] [Google Scholar]
- Doner LW, Bécard G. Solubilization of gellan gels by chelation of cations. Biotechnol Tech. 1991;5:25–28. [Google Scholar]
- Elias KS, Safir GR. Hyphal elongation of Glomus fasciculatum in response to root exudates. Appl Environ Microbiol. 1987;53:1928–1933. doi: 10.1128/aem.53.8.1928-1933.1987. [DOI] [PMC free article] [PubMed] [Google Scholar]
- Gianinazzi-Pearson V, Branzanti B, Gianinazzi S. In vitro enhancement of spore germination and early hyphal growth of a vesicular-arbuscular mycorrhizal fungus by host root exudates and plant flavonoids. Symbiosis. 1989;7:243–255. [Google Scholar]
- Giovannetti M, Avio L, Sbrana C. Factors affecting appressorium development in the vesicular-arbuscular mycorrhizal fungus Glomus mosseae (Nicol. & Gerd.) Gerd. & Trappe. New Phytol. 1993a;123:114–122. [Google Scholar]
- Giovannetti M, Sbrana C, Avio L. Differential hyphal morphogenesis in arbuscular mycorrhizal fungi during pre-infection stages. New Phytol. 1993b;125:587–593. doi: 10.1111/j.1469-8137.1993.tb03907.x. [DOI] [PubMed] [Google Scholar]
- Gooday GW. The dynamics of hyphal growth. Mycol Res. 1993;99:385–394. [Google Scholar]
- Gout E, Bligny R, Douce R. Regulation of intracellular pH values in higher plant cells. Carbon-13 and phosphorus-31 nuclear magnetic resonance studies. J Biol Chem. 1992;15:267–287. [PubMed] [Google Scholar]
- Harold FM (1994) Ionic and electrical dimensions of hyphal growth. In Wessels/Meinhardt, ed, The Mycota. I. Growth, Differentiation and Sexuality. Springer-Verlag, Berlin pp 89–109
- Haugland RP. Handbook of Fluorescent Probes and Research Chemicals, Ed 5. Eugene, OR: Molecular Probes; 1992. [Google Scholar]
- Imai T, Ohno T. The relationship between viability and intracellular pH in the yeast Saccharomyces cerevisiae. Appl Environ Microbiol. 1995;61:3604–3608. doi: 10.1128/aem.61.10.3604-3608.1995. [DOI] [PMC free article] [PubMed] [Google Scholar]
- Isfort RJ, Cody DB, Asquith TN, Ridder GM, Stuard SB, Leboeuf RA. Induction of protein phosphorylation, protein synthesis, immediate-early-gene expression and cellular proliferation by intracellular pH modulation—implications for the role of hydrogen ions in signal transduction. Eur J Biochem. 1993;213:349–357. doi: 10.1111/j.1432-1033.1993.tb17768.x. [DOI] [PubMed] [Google Scholar]
- Jackson SL, Heath IB. Roles of calcium ions in hyphal tip growth. Microbiol Rev. 1993;57:367–382. doi: 10.1128/mr.57.2.367-382.1993. [DOI] [PMC free article] [PubMed] [Google Scholar]
- Kaminskyj SGW, Heath IB. Studies on Saprolegnia ferax suggest the general importance of the cytoplasm in determining hyphal morphology. Mycologia. 1996;88:20–37. [Google Scholar]
- Koide RT, Schreiner RP. Regulation of the vesicular-arbuscular mycorrhizal symbiosis. Annu Rev Plant Physiol Plant Mol Biol. 1992;43:557–581. [Google Scholar]
- Kurkdjian A, Guern J. Intracellular pH: measurement and importance in cell activity. Annu Rev Plant Physiol Plant Mol Biol. 1989;40:271–303. [Google Scholar]
- Mosse B, Hepper C. Vesicular-arbuscular mycorrhizal infections in root organ cultures. Physiol Plant Pathol. 1975;5:215–223. [Google Scholar]
- Nair MG, Safir GR, Siqueira JO. Isolation and identification of vesicular-arbuscular mycorrhiza-stimulatory compounds from clover (Trifolium repens) roots. Appl Environ Microbiol. 1991;57:434–439. doi: 10.1128/aem.57.2.434-439.1991. [DOI] [PMC free article] [PubMed] [Google Scholar]
- Novak S, D'Amore T, Stewart GG. 2-Deoxy-d-glucose resistant yeast with altered sugar transport activity. FEBS Lett. 1990;269:202–204. doi: 10.1016/0014-5793(90)81154-g. [DOI] [PubMed] [Google Scholar]
- Powell CL. Development of mycorrhizal infections from endogone spores and infected root segments. Trans Br Mycol Soc. 1976;66:439–445. [Google Scholar]
- Pressman BC. Biological applications of ionophores. Annu Rev Biochem. 1976;45:501–530. doi: 10.1146/annurev.bi.45.070176.002441. [DOI] [PubMed] [Google Scholar]
- Rees B, Shepherd VA, Ashford AE. Presence of a motile tubular system in different phyla of fungi. Mycol Res. 1994;98:985–992. [Google Scholar]
- Robson GD, Prebble E, Rickers A, Hosking S, Denning DW, Trinci APJ, Robertson W. Polarized growth of fungal hyphae is defined by an alkaline pH gradient. Fungal Gen Biol. 1996;20:289–298. doi: 10.1006/fgbi.1996.0043. [DOI] [PubMed] [Google Scholar]
- Roncal T, Ugalde UO, Irastorza A. Calcium-induced conidiation in Penicillium cyclopium: calcium triggers cytosolic alkalinization at the hyphal tip. J Bacteriol. 1993;175:879–886. doi: 10.1128/jb.175.3.879-886.1993. [DOI] [PMC free article] [PubMed] [Google Scholar]
- Simon L, Bousquet J, Levesque RC. Origin and diversification of endomycorrhizal fungi and coincidence with vascular land plants. Nature. 1993;363:67–69. [Google Scholar]
- Smith SE, Gianinazzi-Pearson V. Physiological interactions between symbionts in vesicular-arbuscular mycorrhizal plants. Annu Rev Plant Physiol Plant Mol Biol. 1988;39:221–244. [Google Scholar]
- St-Arnaud M, Hamel C, Fortin JA. Enhanced hyphal growth and spore production of the arbuscular mycorrhizal fungus Glomus intraradices in an in vitro system in the absence of host roots. Mycol Res. 1996;100:332–338. [Google Scholar]
- Taylor TN. Fossil arbuscular mycorrhizae from the Early Devonian. Mycologia. 1995;87:560–573. [Google Scholar]
- Tsien RY. Fluorescent indicators of ion concentrations. Methods Cell Biol. 1989;30:127–156. doi: 10.1016/s0091-679x(08)60978-4. [DOI] [PubMed] [Google Scholar]
- Turian G, Ton-That TC, Perez RO. Acid tip linear growth in fungi: requirements for H+/Ca2+ inverse gradients and cytoskeleton integrity. Bot Helv. 1985;95:311–322. [Google Scholar]
- Yoshida S. Low temperature-induced cytoplasmic acidosis in cultured mung bean (Vigna radiata L. Wilczek) cells. Plant Physiol. 1994;104:1131–1138. doi: 10.1104/pp.104.4.1131. [DOI] [PMC free article] [PubMed] [Google Scholar]
- Watrud LS, Heithaus JJ, III, Jaworski EG. Geotropism in the endomycorrhizal fungus Gigaspora margarita. Mycologia. 1978;70:449–452. [Google Scholar]
- Wessels JGH. Tansley review no. 45: wall growth, protein excretion and morphogenesis in fungi. New Phytol. 1993;123:397–413. doi: 10.1111/j.1469-8137.1993.tb03751.x. [DOI] [PubMed] [Google Scholar]


