Abstract
To identify age and gender differences among teen drivers in fatal crashes, we analyzed FARS data for 14,026crashes during 2007–2009. Compared with female teenagers, crashes of male teenagers were significantly more likely to involve BACs of 0.08% or more (21% vs. 12%), speeding (38% vs. 25%), reckless driving (17% vs. 14%), night driving (41% vs. 36%) and felony crashes (hit-and-run, homicide, or manslaughter) (8% vs. 6%) (all χ2 p<0.001). Conversely, crashes of female teenagers were more likely to involve right angle (“t-bone”) crashes (23% vs. 17%). Some crash characteristics associated with males and known to play a major role in crash causation also are more common in the youngest teenagers; for example, crashes of drivers age 15 or 16 were more likely than crashes of older teens to involve speeding or reckless driving. Crashes of drivers with BACs of 0.08% or higher increased with age in both genders. Some age effects differed by gender: for example, the proportion of crashes of female teens that involved speeding dropped from 38% to 22% between ages 15 and 19, while for males about 38% of crashes at each age involved speeding. The gender and age differences observed in teen drivers suggest opportunities for targeted driver training – for example, simulator training modules specifically tailored for male or female teenagers. Technology-based tools could also be developed to help parents to focus on the reckless driving tendencies of their sons. Insurance companies should consider ways to incentivize young males to drive more responsibly.
INTRODUCTION
The high crash rates of teenage drivers are well known [NHTSA 2009; Williams 2003]. Little attention, however, has been given to age and gender differences among teen drivers and the circumstances of their crashes. Hanna and colleagues (2006), using data from FARS to study unlicensed teen drivers in fatal crashes, identified some gender differences (unlicensed males, for example, exhibited a greater propensity for high-risk driving behaviors than females) and age differences (drivers younger than 16 were more often speeding and/or involved in single-vehicle crashes than drivers ages 16–18). We have not found comparable analyses that include licensed teen drivers and that examine factors by age and gender simultaneously, making it possible to identify gender differences by single year of driver age. Because the teen years are a time when many changes occur, and because females mature at a younger age than males, we decided to separately examine crashes of male and female teen drivers by age. The importance of the age–related changes is reflected in the way that state requirements of Graduated Driver Licensing (GDL) specify different restrictions for teen drivers of various ages [IIHS 2012].
BACKGROUND
Without examining the simultaneous effect of age and gender differences in teen drivers, prior research has revealed constellations of high-risk driving behaviors: the youth risk behavior surveys of high school students revealed that seatbelt use was less for males, students with poor grades, and those who drove after drinking [Briggs, Lambert, Goldzweig 2008]. McCartt, Shabanova, and Leaf (2003) found an association between lower grades and crash risk. Gender differences were noted by Williams and Shabanova (2003) who reported that young males were more likely than young females to be responsible for fatal crashes. Turner and McClure (2003), studying Australian drivers, found that males scored higher, on average, than females in their acceptance of risk and in driver aggression and thrill seeking.
Age differences among teenagers in likelihood of crashing were described by Williams et al. (1995), who reported that per million miles driven, the crash rates for ages 16, 17, and 18–19 were 43, 30, and 15, respectively. Circumstances also differ as teens age; for example, the presence of passengers has a far greater effect on crash rate per 10,000 trips of 16–17-year-old drivers than on those age 18–19 [Williams 2003]. The appropriate starting ages for various restrictions on teen drivers should be informed not only by their crash rates but also by recognition of the changes with age in the characteristics and circumstances of their crashes.
METHODS
Drivers of ages 15 to 19 who were involved in fatal crashes from 2007 through 2009 were identified in the Fatality Analysis Reporting System (FARS) of the National Highway Traffic Safety Administration (NHTSA). Variables in FARS are divided into four general categories: Accident Level, Vehicle Level, Driver Level, and Person Level. Accident Level variables selected for analysis were Atmospheric Conditions, Accident Time, Roadway Function Class, First Harmful Event, Manner of Collision, and Roadway Surface Condition. Vehicle Level variables selected for analysis were Number of Occupants, Rollover, and Most Harmful Event. Driver Level variables selected for analysis were Driver Presence, Previous Recorded Accidents, Violations Charged, and Previous Speeding Convictions. Person Level variables selected for analysis were Age, Sex, Seating Position, Ejection, Police-Reported Alcohol Involvement, Police-Reported Drug Involvement, and Injury Severity. Also downloaded were the Related Factors variables for Accident Level, Vehicle Level, Driver Level and Person Level.
FARS data from 2007 through 2009 were downloaded as .txt files and combined and analyzed in Stata IC v.12 (Stata Corp., College Station, TX). Using the Seating Position variable, we selected drivers. Using the Age variable, we selected for drivers 15 through 19yearsold. Age was analyzed as a variable with 5 categories, not as a continuous variable.
Continuous variables Previous Recorded Accidents, Previous Speeding Convictions, and Number of Occupants were recoded into binary yes/no variables. Roadway Function Class was dichotomized into two variables: urban versus rural roads and highways (interstate and arterials) versus local roads (collectors and local). To improve the power of the statistical tests, we collapsed categorical variables such as Road Surface Conditions (dry roads versus other conditions), Atmospheric Conditions (clear or overcast versus other conditions), and Police-Reported Alcohol Involvement in order to generate larger cell counts. Based on previous studies of crash hour [Shope and Bingham 2008], Accident Time was recoded into three categories in 24-hour time: Morning (0400–1159), Afternoon (1200–1959), and Night (2000-0359). Day of the crash was also examined as traditional weekend (Saturday and Sunday) versus weekday crashes. Manner of Collision was analyzed as a single variable, and then binary variables for single vehicle crashes and front-to-side MVCs were generated to further describe crash types across age and gender. The Violations Charged and Related Factors-Driver Level variables were recoded to capture reckless driving, presence and/or use of a cell phone, speeding, and drivers not obeying traffic signals.
Variables were compared across genders and ages using the χ2 statistic: 2 × k category comparisons were made for male and female drivers and 5 × k category comparisons were made for 15-, 16-, 17-, 18-, and 19-year-old drivers for each gender. Multiple logistic regression models with an interaction term were created to determine if there was an age*sex interaction. Secondary analyses were conducted using multivariate logistic regression for drivers who had previous speeding offenses and for drivers who had a BAC at or above 0.08% because both of these have been shown to predict MVCs ([Cooper 1998; Zador, Krawchuk, Voas 2000]). In both analyses, a binomial variable for the potential effect modifier (BAC, prior speeding conviction) was entered into a logistic regression with age and sex. We compared these results to the same model without the modifier to see if there was a change in odds ratios for age or sex.
RESULTS
A total of 14,026 teen drivers were involved in 5,408 fatal crashes in 2007, 4,459 fatal crashes in 2008, and 4,159 fatal crashes in 2009. Of these 14,026 drivers, 6,261 were killed in the crash (45%). Males comprised69% of teen drivers involved in fatal crashes, with slight variation for each age (Table 1). Information on previous recorded crashes was available for 91% of crashes and information on prior speeding convictions was available for 97%. For crashes where the data were reported, 14% of male drivers and 12% of female drivers (χ2 p=0.02) had prior crashes and 19% of male and 12% of female drivers (χ2 p<0.001) had prior speeding convictions. In Table 2 we summarize the variables examined, and the significance of χ2 and age*sex interaction analyses. Significant results are described below.
Table 1.
Number and Percent of Crashes for Males and Females by Age of Driver.
| Female | Male | |||
|---|---|---|---|---|
| Age | n | % | n | % |
| 15 | 115 | 31% | 256 | 69% |
| 16 | 671 | 36% | 1,183 | 64% |
| 17 | 1,023 | 34% | 2,024 | 66% |
| 18 | 1,300 | 30% | 3,036 | 70% |
| 19 | 1,191 | 27% | 3,224 | 73% |
| Total | 4,300 | 31% | 9,723 | 69% |
Table 2.
Summary of Tests of Significance for Gender (χ2), Age (χ2), and an Interaction of Age and Gender on Various Crash Risk Factors (N.S.-Not Significant)
| Variable | Gender | Age within males | Age within females | Age-gender interaction |
|---|---|---|---|---|
| Highway vs. local roads | p<.001 | p<.001 | p<.001 | p<.01 |
| Urban vs. rural roads | p<.01 | p<.001 | p<.001 | p<.01 |
| Dry vs. other road surface | p<.05 | N.S. | N.S. | N.S. |
| Clear vs. other weather | p<.001 | N.S. | N.S. | N.S. |
| Crash type | p<.001 | p<.05 | p<.05 | N.S. |
| Ejection | p<.01 | N.S. | N.S. | N.S. |
| Rollover | p<.05 | p<.001 | p<.001 | N.S. |
| Time of day | p<.001 | p<.001 | p<.001 | N.S. |
| Weekend | p<.001 | p<.01 | N.S. | N.S. |
| BAC ≥ 0.08% | p<.001 | p<.001 | p<.001 | N.S. |
| Lane excursions | p<.001 | p<.01 | p<.001 | N.S. |
| Cell phone presence or use | p<.001 | N.S. | N.S. | N.S. |
| Driving recklessly | p<.001 | N.S. | N.S. | N.S. |
| Drowsy driving | p<.05 | N.S. | N.S. | N.S. |
| Ignoring traffic signals | N.S. | N.S. | N.S. | N.S. |
| Passenger Presence | N.S. | p<.001 | p<.001 | N.S. |
| Speeding | p<.001 | N.S. | p<.001 | p<.01 |
Speeding
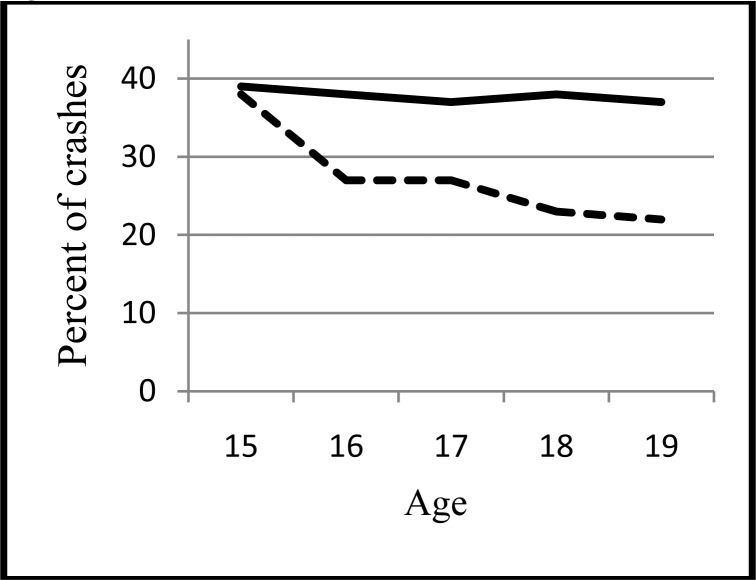
Driving above the posted speed limit or too fast for the conditions was stated for 37% of males and 25% of females (χ2 p<0.001). The percent of male drivers involved in speeding did not change with age, whereas the percentage decreased with age for female drivers, from 38% at age 15 to 22% at age 19 (Figure 1). Drivers with a prior speeding conviction were more likely to be speeding at the time of the fatal crash (OR=1.16, 95%CI (1.04–1.30)).
Figure 1.
Percent of Crashes Involving Speeding for Male (Solid) and Female (Dashed) Teen Drivers, by Age.
Violations
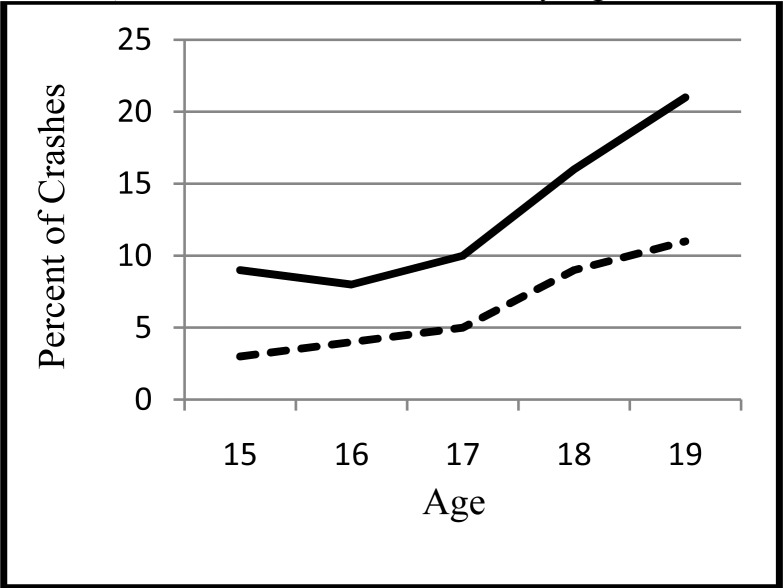
Table 3 displays the results of BAC tests for drivers by gender. The greatest differences were that more male drivers tested at or above 0.08% and that fewer female drivers were administered a blood alcohol test. The percentage of male and female drivers with a BAC at or above 0.08 increased steadily by age: from 4% to 18% from age 15 to 19. The increase followed a similar trend by gender: from 3% to 11% for women and 9% to 21% for 15-through 19-year-old males at 0.08 or higher (Figure 2). A mediating effect for BAC ≥ 0.08 was found for drivers involved in rollover crashes: in Table 2, both male gender and younger age are more related to increased likelihood of rollover (see results below); however, with BAC in the model, there is no longer any gender effect.
Table 3.
Percent of Male and Female Drivers by Blood Alcohol Content (BAC) at Time of Crash.
| Zero BAC | BAC .01–.07 | BAC ≥.08 | No test given | Unknown | |
|---|---|---|---|---|---|
| Female | 38% | 2% | 7% | 44% | 10% |
| Male | 36% | 4% | 14% | 36% | 10% |
Figure 2.
Percent of Male (Solid) and Female (Dashed) Drivers with a BAC>=0.08 by Age.
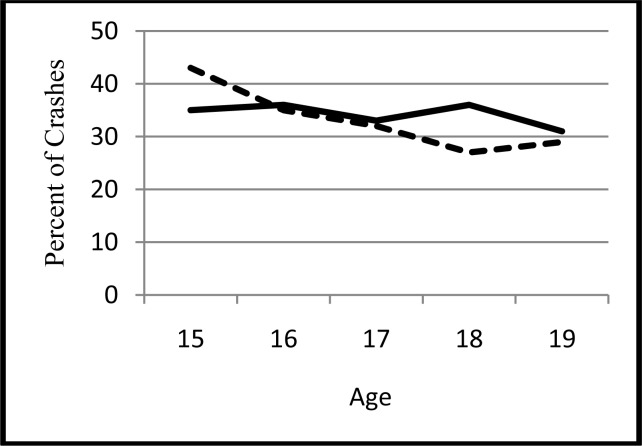
Crash investigations revealed that 34% of male drivers and 30% of female drivers (χ2 p<0.001) were involved in lane excursions. The percent of male drivers involved in lane excursions remained fairly constant (although there was a statistically significant drop from 36% to 31% over the 5 ages) whereas the percent of female drivers decreased with age, from 43% of 15 year olds to 29% of 19 year olds (Figure 3). There was a statistically significant difference for cell phone presence/usage between female (4%) and male (2%) drivers (Table 2); however, there was no difference across age groups, possibly due to low cell counts.
Figure 3.
Percent of Male (Solid Line) and Female (Dashed Line) Drivers Where Lane Excursion was Involved in the Crash.
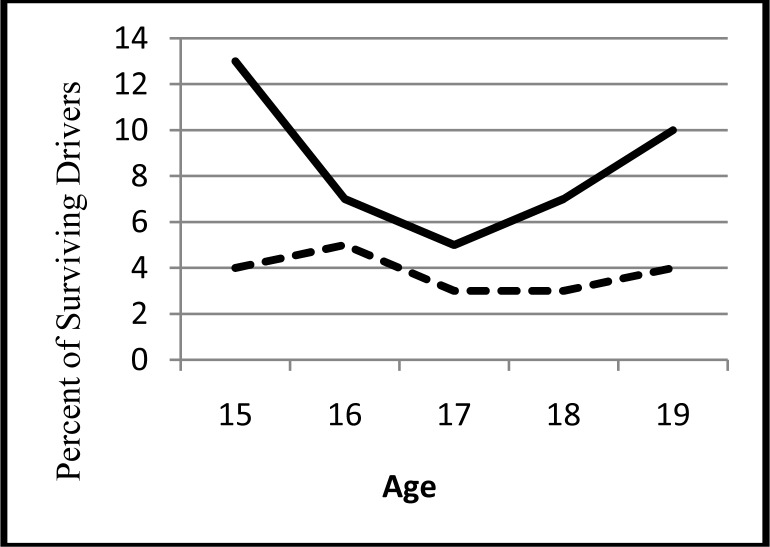
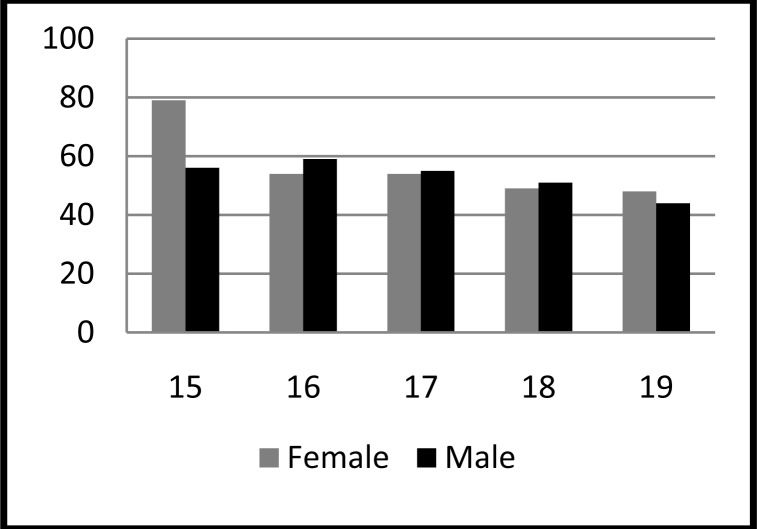
Male drivers were driving in a reckless manner in 18% of fatal crashes versus 15% of female drivers (p<0.001). Further analysis of the 7,762 drivers who were not killed in the crashes found 8% of boys and 4% of girls were charged with felonies like hit-and-run, homicide, manslaughter, or assault (χ2 p<0.001). There was no age difference in percent of these offenses charged to surviving girls, and a U-shaped relationship for surviving boys (χ2 p<0.001) (Figure 4). Gender was not a significant predictor of passenger presence in the crash; however there was an age effect: 78% of 15-year-old females and 59% of 15-year-old males had passengers, which decreased to less than 50% of 19 year olds of either gender with passengers. There was no interaction for age and gender (βage*sex p=0.5).
Figure 4.
Percent of Surviving Males (SolidLine) and Females (DashedLine) Charged with a Felony (e.g. Hit-and-run, Manslaughter, Homicide, or Assault) in TheirCrash.
Manner of Collision
Using Manner of Collision, FARS describes 12 different ways in which the fatal crash occurred. Because of the large number of cells, χ2 tests were significant for gender (χ2 p<.001) and age (p<0.05 for males and females). However, two major gender differences became apparent in Manner of Collision. First, male drivers were more likely than female drivers (53% versus 44%, χ2 p<0.001) to be in single vehicle crashes. Second, female drivers were more likely to be in front-to-side crashes (33% versus 25% of male crashes, χ2 p<0.001). Of special note, almost one quarter of female MVCs were right angle front-to-side crashes (i.e. t-bone) versus only 17% of males’ crashes. All other collision types (e.g., front-to-front, sideswipe) occurred with similar percentages for male and female drivers. For both genders percent of front-to-side crashes increased with age (χ2 males p<.01, females p<.05). There was no difference by age for males in single-vehicle crashes, whereas these were more common for 15-year-old females than any other age (χ2 p<.01). Males were more likely than females to be involved in a rollover crash (χ2 p=.04). For males, there was a small negative relationship between age and rollover (31% for 15-year-old to 27% of 19-year-olds, p=.004); whereas for females, there was a more pronounced relationship (44% at age 15 to 24% at age 19, p<.001). As mentioned above, BAC mediated the effects of gender and rollover. The percentage of drivers ejected was slightly higher for males than females (χ2 p=0001).
Time of Day
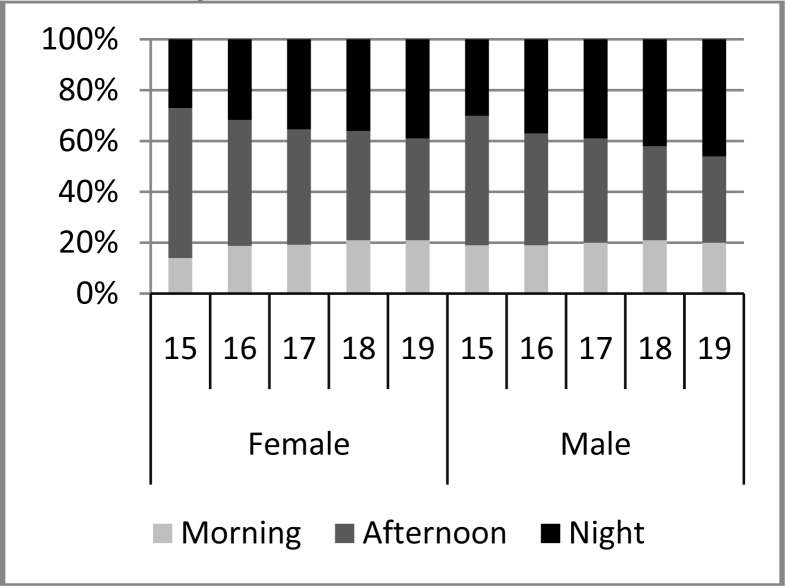
While 20% of crashes of both male and female drivers occurred in the morning (4:00 a.m. to 12:00 p.m.), 44% of female’s crashes occurred in the afternoon (versus 39% of males) and 41% of male crashes (versus 36% of females) occurred at night, 8:00 pm. through 4:00 a.m. Percentage of crashes at night increased as age increased for both males and females (Figure 5). For males, the percentage of crashes at night was the same as the percentage in the afternoon at age 17. Female drivers did not reach such equivalence until age 19.
Figure 5.
Percent of Crashes by Time of Day by Gender and Age of Drivers.
Day of Week
Crashes peaked for male drivers on Saturday (20%) and Sunday (18%) and for female drivers peaked on Saturday (18%) and Friday (17%). Carpenter and Pressley (2012) identified the “social weekend” (from 5:00 p.m. Friday through 4:00 a.m. Sunday) as a time for increased crash risk versus the convention of designating all MVCs on Saturday and Sunday. The social weekend is only 21% of the week, but 35% of males and 31% of females (χ2 p<0.001) experienced their crashes during this time. Although 3% more crashes occurred on Saturday and Sunday versus the social weekend, all χ2 tests had the same level of significance and outcome for either the weekend or social weekend.
Road Type and Crash Conditions
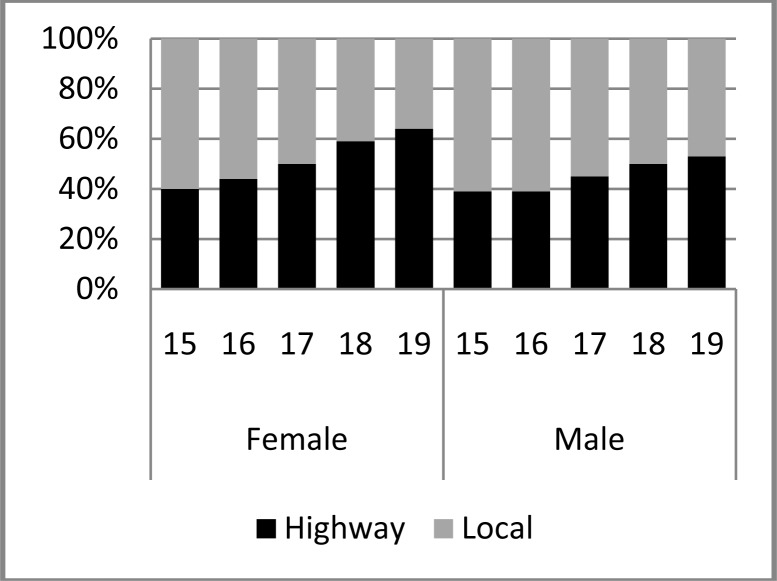
Crashes were more likely to have occurred for women versus men(χ2p<0.001) on interstate highways and arterial roads (56% vs. 48%). For both male and female drivers, the percent of crashes on interstate and arterial roads increased as age increased. The difference between male and female drivers involved in highway crashes increased as age increased (βage*sex p=0.001) (Figure 6). There was a small, statistically significant difference in the percent of crashes that occurred on urban roads for females and males, 40% and 43%, respectively (χ2 p=0.008). For males, the percent of crashes on urban roads increased from 34% for 15 year olds to 45% for 19 year olds (χ2 p<0.001); for females, the percent of crashes on urban roads increased from 27% to 47% (χ2 p<0.001). There was an age*gender interaction, as the percent of crashes on urban roads increased with age at a higher rate for females versus males (βage*sex p=0.004)and was higher for females at each age.
Figure 6.
Percent of Crashes on Highways vs. Local Roads by Age and Gender of Driver.
The majority of crashes (84%) occurred on dry roads, with the remaining 16% occurring on wet or “other” (ice, snow, standing water, etc.) roads. Similarly, the majority of crashes (88%) occurred in clear/cloudy non-adverse weather; 8% of crashes occurred in rainy conditions; the remaining 4% occurred in “Other” conditions such as snow, fog, blowing dust, or severe crosswinds. Statistically significant 2% differences between genders for atmospheric and road conditions were found (Table 2).
DISCUSSION
The fact that more male teenage drivers were involved in fatal crashes than female teenage drivers comes as no surprise. These results show, however, that the contributing factors in these severe crashes are not equally distributed between genders and, furthermore, that the crash characteristics within a given gender are not homogeneously distributed by age. Both the similarities and differences by gender and age should be informative as to how we target training for teen drivers as well as driving restrictions and regulations.
Much of these data support the commonly accepted idea that male teenage drivers are more reckless than female teenage drivers. Male drivers were speeding more often at the time of the crash, were driving out of their lane (lane excursions), were drinking alcohol, were driving recklessly, and were charged with a serious violation, such as hit-and-run or manslaughter.
For male drivers, aside for a spike in 15-year-olds charged with felonies, Figures 2 and 4 displays a trend increasing with age from both BAC ≥ 0.08 and crash survivors charged with felonies, respectively. Bivariate regression analysis shows that males who had a BAC ≥ 0.08 and survived their crash were 4 times as likely to be charged with hit-and-run, manslaughter, or homicide as those with a BAC <0.08(OR=4.4, χ2 p =0.001). This effect was still present when gender and BAC were both entered into a regression on these severe violations. (Yet BAC did not mediate the effects of age or gender on these types of crashes). This is consistent with previous findings that driver alcohol use was associated with hit-and-run fatalities of pedestrians [MacLeod, Griswold, Arnold 2012]. Alcohol use (as indicated by BAC ≥ 0.08) did mediate the effects of gender for rollover crashes; this is the only instance where alcohol use explained the gender effects. So although important, alcohol use does not wholly explain the recklessness of male drivers.
Rodes and Pivik (2011) reported that driver affect and perceived crash risk mediate the relationship of crash risk to age and gender. These authors reviewed how overestimation of driving skill and capability of hazard recognition as well as underestimation of crash consequences increase the risk of a crash. These characteristics are found most often in young, male drivers, helping to explain why crash risk is highest for male teens. Further evidence of the recklessness of male teen drivers is the proportion of single-vehicle crashes. Williams, Preusser, and Ulmer (1995) found that single-vehicle crashes commonly involved speeding, night driving, and high vehicle occupancy, all risk factors for crashes.
As both male and female drivers age, the percent of crashes in the afternoon decreases as the percent of crashes at night increases (Figure 5). An important component of graduated driver licensing (GDL) programs is a nighttime restriction on young drivers [Chen, Baker, Li 2006]. If 17-year-old drivers are no longer under a curfew restriction, then their risk of night crash may increase. Because more 17 year olds are legally allowed to drive at night, this might explain why the proportion of night crashes jumps at 17 for boys. However, we would expect a similar increase at 17 for girls, but the proportion of nighttime crashes increases more slowly for girls.
Closer examination of crashes involving female drivers finds that they are much less reckless than male drivers. The percent of crashes involving lane excursions (Figure 4) decreased with age for females, as does the percentage of crashes involving speeding. Even the percent of drivers with passengers in the vehicle decreases with age for female drivers, whereas it remains constant for male drivers (Figure 7).
Figure 7.
Percent of Crashes with One or More Passenger in the Vehicle, by Gender and Age.
One result for female drivers that requires further study is right-angle crashes. All crashes classified as front-to-side (including right-angle) by FARS comprised 33% of female crashes and only 25% of male crashes. Ryan and colleagues [1998] find that right-angle crashes occur in this proportion for drivers 50 and older. These same authors describe such collisions as arising out of complex situations at intersections requiring the processing of many stimuli. One possibility is that these female drivers were distracted by internal or external objects or events [Ranney 2008; Ascone, Lindesy, Varghese 2009]; however, the only information we have on distraction in this database is cell phone presence and/or use, and these driver-related factors were reported in only 4% of female crashes. The reporting of cell phone use in this study is lower than found in studies examining cell phone use prevalence [Farmer, Braitman, Lund 2011; Eby, Vivoda, St. Louis 2006]. The 2010 FARS database includes variables to better describe sources of distraction [NHTSA 2011], so it will be possible to analyze distraction type by age and gender in future studies.
Many factors contribute to rural crash rates being higher than urban crash rates in the United States [Wylie and Kimball 1997]. In the present study, both male and female drivers were similarly likely to be involved in crashes in urban vs. rural areas, yet the percent of crashes on urban roads increased with age. McCartt et al (2003) found that crash risk is substantially higher for the first month of licensure (versus the rest of the first year) and during the first 250 miles of driving experience. These authors also found that rural drivers accumulated more miles driven in the first year of licensure than urban and suburban drivers. A higher proportion of older teen drivers than younger teen drivers are licensed; and they also drive more miles per license holder [Williams et al 1995]. It could be that younger, rural teens are amassing the necessary driving exposure for crashes whereas urban teen drivers reach this exposure later in their teen years. Developing a strategy specifically targeted to reduce rural crashes will require a thorough understanding of rural culture [Hartley 2004].
Policy Implications
Although great strides have been made in injury and death prevention for teenage drivers(e.g., GDL laws [Chen et al 2006]and vehicle safety improvements)teen boys remain more hazardous drivers than girls. Therefore, tailoring interventions may be appropriate to reduce the gender disparity.
The gender differences in circumstances of crashes suggest the need for new approaches to training teen drivers. Parents might not consider training their male and female children differently. Yet with what we know about how crash scenarios differ for males and females, specialized training could offer somewhat different components. For example, simulator training software for boys could be tailored to place slightly more emphasis on speeding and reckless driving than for girls. With simulator training becoming more common and affordable, the potential for modifying it to address specific groups of drivers should be recognized.
Another potential technological intervention to address risky driving is in-car devices that monitor driving behavior and/or limit the performance and capabilities of the automobile. A number of such products are currently available and in the market place. Ford Motor Company now offers the MyKey System that allows parents to limit maximum speed and audio volume, as well as providing auditory warnings when seat belts are not used and when vehicle speed thresholds are reached (e.g., 45, 55 or 65 MPH). (http://media.ford.com/article_display.cfm?article_id=29172). Monitoring products such as CarChip and DriveCam allow parents to monitor the driving behavior of their teens, thus allowing for the opportunity to correct bad driving behavior early. DriveCam has been implemented in conjunction with weekly parental reviews of safety incidents, and initial evaluation suggests the potential to reduce risk among at-risk teens [McGehee, Raby, Camey 2007].
Parental involvement is important in teen driver safety [Shope and Bingham 2008]. Parental restrictions on teen drivers have been shown to be effective in crash prevention [McCartt et al 2003] and in reducing risky driving behavior [Beck, Hartos, Simmons-Morton 2006]. States (e.g. http://www.mass.gov/rmv/jol/JOLcontract.pdf)as well as insurance companies (e.g. https://www.travelers.com/personal-insurance/auto-insurance/docs/teen-parent-contract.pdf) encourage parents or guardians to sign Teen Driver Contracts laying out the rules under which a teen will drive; however, these contracts don’t carry enforcement beyond the parents/guardians stating that they would restrict driving privileges if/when the contracts are broken.
State GDL laws apply equally to male and female drivers. The data support considering such extreme interventions as allowing females to be licensed at a younger age than males; however, the political feasibility of such a measure seems minimal. An alternative might be to focus on insurance companies as an avenue to develop additional restrictions on young male drivers. Insurance rates are typically higher for male teens versus female teens because of the recognized increased risk of insuring boys, yet the increased cost of insuring male teens is not a sufficient deterrent to reduce the crash rates in male teens. Insurance policies for boys could in corporate parent-teen contracts, or technological innovations with predetermined penalties such as termination of insurance and/or premium rate increases for violations. Conversely, discounts could be given to parents who more closely monitor their teen’s driving with DriveCam, or similar technology. Although the up-front cost for an insurance company might be higher for further training or in-vehicle technology, preventing teens’ crashes could reduce their future expenditures on paying out policies after a crash.
Limitations
This study examined only teens involved in fatal crashes. Future studies could determine if these results are consistent for teen drivers in less severe crashes. Ascone et al (2009) reviewed some of the limitations of the police reports and other data sources used to create the FARS database. The present study examined proportions of crashes and not rates. This means that as any factor increases, all other factors in the same series must decrease in order for the total of the series to be 100%. Therefore, it might be the case that males had higher rates (per vehicle miles traveled) of right-angle collisions than females, yet it appeared that these crashes were more common for women due to the high rate of single-vehicle crashes in males.
CONCLUSION
Male teen drivers involved in fatal crashes from 2007–2009 were often engaged in risky driving activities such as speeding and drunk driving. Parents, State governments, and insurance companies could take steps to ensure that male teens are more adequately trained, more closely monitored, and adhere to safe driving practices.
REFERENCES
- Ascone DS, Lindsey T, Varghese C. Washington, D.C.: 2009. An Examination of Driver Distraction as. Recorded in NHTSA Databases NHTSA Report No DOT HS 811 216. [Google Scholar]
- Beck KH, Hartos JL, Simons-Morton BG. Relation of Parent-Teen Agreement on Restrictions to Teen Risky Driving over 9 Months. American Journal of Health Behavior. 2006;30(5):533–543. doi: 10.5555/ajhb.2006.30.5.533. [DOI] [PubMed] [Google Scholar]
- Briggs NC, Lambert EW, Goldzweig IA, Levine RS, Warren RC. Driver and Passenger Seatbelt Use Among U.S. High School Students. American Journal of Preventive Medicine. 2008;35(3):224–229. doi: 10.1016/j.amepre.2008.03.038. [DOI] [PubMed] [Google Scholar]
- Carpenter D, Pressley JC. Graduated Driver License Nighttime Compliance in U.S. Teen Drivers Involved in Fatal Motor Vehicle Crashes. Accident Analysis and Prevention. 2012. E-pub ahead of print. [DOI] [PubMed]
- Chen LH, Baker SP, Li G. Graduated Driver Licensing Programs and Fatal Crashes of 16-Year-Old Drivers: A National Evaluation. Pediatrics. 2006;118(1):56–62. doi: 10.1542/peds.2005-2281. [DOI] [PubMed] [Google Scholar]
- Cooper PJ. The Relationship between Speeding Behavior (as Measured by Violation Convictions) and Crash Involvement. Journal of Safety Research. 1998;28(2):83–95. [Google Scholar]
- Eby DW, Vivoda JM, St. Louis RM. Driver Hand-Held Cellular Phone Use: A Four-Year Analysis. Journal of Safety Research. 2006;37:261–265. doi: 10.1016/j.jsr.2006.02.003. [DOI] [PubMed] [Google Scholar]
- Farmer CM, Braitman KA, Lund AK. Cell Phone Use While Driving and Attributable Crash Risk. Traffic Injury Prevention. 2010;11(5):466–470. doi: 10.1080/15389588.2010.494191. [DOI] [PubMed] [Google Scholar]
- Hartley D. Rural Health Disparities, Population Health, and Rural Culture. American Journal of Public Health. 2004;94(10):1675–1678. doi: 10.2105/ajph.94.10.1675. [DOI] [PMC free article] [PubMed] [Google Scholar]
- Insurance Institute of Highway Safety. U.S. young driver licensing systems. 2012. Available online at http://www.iihs.org/laws/graduatedLicenseIntro.aspx (Accessed 30 April 2012)
- MacLeod KE, Griswold JB, Arnold LS, Ragland DR. Factors Associated With Hit-and-run Pedestrian Fatalities and Driver Identification. Accident Analysis and Prevention. 2012;45:366–372. doi: 10.1016/j.aap.2011.08.001. [DOI] [PubMed] [Google Scholar]
- McCartt AT, Shabanova VI, Leaf WA. Driving Experience, Crashes and Traffic Citations of Teenage Beginning Drivers. Accident Analysis and Prevention. 2003;35:311–320. doi: 10.1016/s0001-4575(02)00006-4. [DOI] [PubMed] [Google Scholar]
- McGehee DV, Raby M, Carney C, Lee JD, Reyes ML. Extending Parental Mentoring Using an Event-Triggered Video Intervention in Rural Teen Drivers. Journal of Safety Research. 2007;38:215–227. doi: 10.1016/j.jsr.2007.02.009. [DOI] [PubMed] [Google Scholar]
- National Highway Transportation Safety Administration. Traffic Safety Facts: 2008. Washington, D.C.: 2009. US Department of Transportation Report No DOT HS 811 170. [Google Scholar]
- National Highway Traffic Safety Administration. 2010 Fatality Analysis Reporting System (FARS) Coding and Validation Manual. Washington, D.C.: 2011. US Department of Transportation Report No DOT HS 811 530. [Google Scholar]
- Ranney T. Driver distraction: A Review of the Current State-of-Knowledge. Washington, D.C.: 2008. NHTSA Report no. DOT HS 810 787. [Google Scholar]
- Rhodes N, Pivik K. Age and Gender Differences in Risky Driving: The Roles of Positive Affect and Risk Perception. Accident Analysis and Prevention. 2011;43:923–931. doi: 10.1016/j.aap.2010.11.015. [DOI] [PubMed] [Google Scholar]
- Ryan GA, Legge M, Rosman Age Related Changes in Drivers’ Crash Risk and Crash Type. Accident Analysis and Prevention. 1998;30(3):379–387. doi: 10.1016/s0001-4575(97)00098-5. [DOI] [PubMed] [Google Scholar]
- Shope JT, Bingham R. Teen Driving, Motor-Vehicle Crashes and Factors that Contribute. American Journal of Preventive Medicine. 2008;35(3S):S261–S271. doi: 10.1016/j.amepre.2008.06.022. [DOI] [PubMed] [Google Scholar]
- Turner C, McClure R. Age and Gender Differences in Risk-Taking Behavior as an Explanation for High Incidence of Motor Vehicle Crashes as a Driver in Young Males. Injury Control and Safety Promotion. 2003;10(3):123–130. doi: 10.1076/icsp.10.3.123.14560. [DOI] [PubMed] [Google Scholar]
- Williams AF, Preusser DF, Ulmer RG, Weinstein HB. Characteristics of Fatal Crashes of 16-Year-Old Drivers: Implications for Licensure Policies. Journal of Public Health Policy. 1995;16(3):347–360. [PubMed] [Google Scholar]
- Williams AF. Teenage Drivers: Patterns of Risk. Journal of Safety Research. 2003;34:5–15. doi: 10.1016/s0022-4375(02)00075-0. [DOI] [PubMed] [Google Scholar]
- Williams AF, Shabanova VI. Responsibilities of Drivers, by Age and Gender, for Motor-Vehicle Crash Deaths. Journal of Safety Research. 2003;34(5):527–531. doi: 10.1016/j.jsr.2003.03.001. [DOI] [PubMed] [Google Scholar]
- Wylie MAT, Kimball RB. Rural Motor Vehicle Crashes: Can We Prevent Them? Journal of Emergency Nursing. 1997;23(6):542–544. doi: 10.1016/s0099-1767(97)90266-x. [DOI] [PubMed] [Google Scholar]
- Zador PL, Krawchuk SA, Voas RB. Alochol-Related Relative Risk of Driver Fatalities and Driver Involvement in Fatal Crashes in Relation to Driver Age and Gender: An Update Using 1996 Data. Journal of Studies on Alcohol and Drugs. 2000;61:387–395. doi: 10.15288/jsa.2000.61.387. [DOI] [PubMed] [Google Scholar]


