Abstract
Background and Aims
How plant cell-cycle genes interface with development is unclear. Preliminary evidence from our laboratory suggested that over-expression of the cell cycle checkpoint gene, WEE1, repressed growth and development. Here the hypothesis is tested that the level of WEE1 has a dosage effect on growth and development in Arabidospis thaliana. To do this, a comparison was made of the development of gain- and loss-of-function WEE1 arabidopsis lines both in vivo and in vitro.
Methods
Hypocotyl explants from an over-expressing Arath;WEE1 line (WEE1oe), two T-DNA insertion lines (wee1-1 and wee1-4) and wild type (WT) were cultured on two-way combinations of kinetin and naphthyl acetic acid. Root growth and meristematic cell size were also examined.
Key Results
Quantitative data indicated a repressive effect in WEE1oe and a significant increase in morphogenetic capacity in the two T-DNA insertion lines compared with WT. Compared with WT, WEE1oe seedlings exhibited a slower cell-doubling time in the root apical meristem and a shortened primary root, with fewer laterals, whereas there were no consistent differences in the insertion lines compared with WT. However, significantly fewer adventitious roots were recorded for WEE1oe and significantly more for the insertion mutant wee1-1. Compared with WT there was a significant increase in meristem cell size in WEE1oe for all three ground tissues but for wee1-1 only cortical cell size was reduced.
Conclusions
There is a gene dosage effect of WEE1 on morphogenesis from hypocotyls both in vitro and in vivo.
Keywords: Arabidopsis thaliana, cell cycle, development, growth, hypocotyl, tissue culture, WEE1
INTRODUCTION
The cell cycle is regulated by protein kinase complexes which, in their minimal configuration, consist of a Ser/Thr cyclin dependent kinase (CDK), and a regulatory cyclin subunit (Norbury and Nurse, 1992). CDK activity is also subject to negative regulation imposed by specific inhibitory kinases. In fission yeast, at the G2/M transition, MIK1/WEE1 kinases act as inhibitors by phosphorylating Tyr15 of the CDK and, in animals, there is a further involvement of the Thr14/Tyr15 MYT1 kinase (Russell and Nurse, 1987; Mueller et al., 1995). Neither MIK1 nor MYT1 features in the arabidopsis genome but WEE1 kinase has been cloned in a range of higher plants (reviewed by Shimotohno and Umeda, 2007).
Expression of arabidopsis WEE1 (Arath;WEE1) is highest in proliferative regions of the plant (Sorrell et al., 2002), including young roots (Rhee et al., 2003) (Supplementary Data Fig. S1). However, the expression of a WEE1p::GUS construct in root tips was only detected occasionally as a faint signal under normal growth conditions (De Schutter et al., 2007). Moreover, a T-DNA insertion mutant developed normally, raising doubts about WEE1's role in normal cell cycles. Possible functional redundancy of negative G2/M regulators could explain the apparently normal development of the T-DNA insertion line. However, the expression of the tomato WEE1 homologue, Solly;WEE1 in BY-2 cells delayed entry of cells into mitosis (Gonzalez et al., 2007) and over-expression of Arath;WEE1 driven by a strong activatable promoter resulted in arrest of root growth and a block on cells at G2 (De Schutter et al., 2007).
Unpublished observations in our laboratory indicated that over-expression of Arath;WEE1 repressed growth and development of arabidopsis seedlings and that over-expression of tobacco WEE1 delayed entry into mitosis in synchronized BY-2 cells. Given these negative effects of plant WEE1 on growth and development we decided to test the genetic basis of these responses by expanding the analysis to include two T-DNA insertion lines for WEE1. In particular, we analysed the gene dosage effects of WEE1, in the series WEE1 over-expressors, wild type (WT) and wee1 insertion mutants, testing the morphogenetic competence of arabidopsis hypocotyls in vitro and seedling growth and development in vivo. We used the Inoue et al. (2001) grid system that tests the responses of explanted hypocotyls to two-way auxin and cytokinin gradients. Qualitative data are consistent in showing excess WEE1 represses growth and morphogenesis from hypocotyls in vitro. Quantitative data at specific kinetin/naphthyl acetic acid (NAA) combinations, confirmed WEE1's repressive effects which were reversed in the T-DNA insertion lines in vitro. Further morphogenetic data in vivo showed a similar trend in adventitious-root formation.
MATERIALS AND METHODS
Arabidopsis lines
Arath;WEE1 was expressed in the BIN HYG TX vector (Gatz et al., 1992) under an attenuated form of the 35S promoter and transformed into Arabidospis thaliana ecotype Columbia using the floral dip method (Clough and Bent, 1998) and selected on hygromycin. The full open reading frame of Arath;WEE1 was PCR amplified from seedling cDNA using primers FW 5'-AGGCCCGGGCTCGAGATGTTCGAGAAGAACGG-3' and RV 5'-GCACACTAGTCGACTCAACCTCGAATCCTAT-3', that included SmaI and SalI sites respectively. The PCR product was cloned and fully sequenced to ensure errors had not been introduced by the PCR. Primers for measuring expression of Arath;Act2 were as described in Sorrell et al. (2002). Over-expression of the Arath;WEE1 was checked by semi-quantitative RT-PCR (as described below) using primers Atwee1F 5'-AGCTTGTCAGCTTTGCCT-3' and Atwee1R 5'-CGTGCATCCCTCCTTCTTCTACT-3'. The number of PCR cycles for the target gene was optimized with the specific gene primer pairs and each cDNA batch. Dilutions of the cDNA were run with each experiment to ensure that the PCR reaction was in the linear exponential phase and that product fluorescence [as measured by ethidium bromide fluorescence using a Gene Genius Bioimaging System (Syngene Ltd)] was linear. Relative cDNA amounts were normalized using 18S rRNA target primers as described previously (Price et al., 2008), again optimizing cycle number for each cDNA batch. Two lines over-expressing Arath;WEE1 (WEE1oe lines #58 and #61) which showed strong expression of the transgene by RT-PCR were selected for further experiments. RT-PCR to demonstrate the expression of Arath;WEE1 in root tips used primers as described in Sorrell et al. (2002). One primer from each pair spanned an intron junction and thus avoided the risk of amplification from residual contaminating genomic DNA.
Homozygous T-DNA insertion lines for Arath;WEE1 (wee1-1 and wee1-4) were obtained from the GABI-Kat collection of T-DNA insertion lines (Rosso et al., 2003) (GABI_270E05;GABI_006C10).
Culture of hypocotyls on grids: qualitative assessment
Arabidopsis seedlings were grown aseptically on Murashige and Skoog (MS) medium (Murashige and Skoog, 1962) in a Sanyo–Gallenkamp arabidopsis chamber with 16 h light (fluence rate = 300 µmol m−2 s−1) and 8 h dark at 21 °C. Five-millimetre-long segments from the middle of hypocotyls were excised from 14-d-old seedlings and cultured using a two-way grid system. Hypocotyls were cultured on a modified MS medium: 4·3 g l−1 MS salts (Duchefa Biochemie, Melford Laboratories) with Gamborg's vitamins (Sigma-Aldrich), 2 % sucrose and 0·8 % agar (DifcoTM ) adjusted to pH 5·7 (Inoue et al., 2001). Sterilin® plates (5 × 5 squares) enabled a two-way increasing concentration range of cytokinin (kinetin, x-axis) and auxin (NAA, y-axis] to be established. The exogenous concentration of the plant growth regulators ranged from 25 ng mL−1 to 300 ng mL−1. The grids were cultured as above and analysed 30 d later. Three replicate experiments were performed. Hypocotyl explants were scored for growth of callus and presence or absence of shoots and/or roots using a dissecting microscope (Nikon Z-100).
Culture of hypocotyls in Petri dishes: quantitative assessments
Replicate hypocotyls of each line (n = 25) were excised aseptically and cultured on Petri dishes containing MS medium modified as above and supplemented with selected concentrations of NAA and kinetin as above. After 30 d, cultures were scored as above and the area of the callus was determined by image analysis (SigmaScanPro®).
Analysis of root and root apical meristem (RAM) phenotypes
Seeds were sown aseptically 1·5 cm apart on 200-mm square Petri dishes containing MS medium and stratified for 48 h (5 °C). Seedlings were grown vertically as described above. Primary root length was measured daily for 16 d. A regression analysis was applied to each sub-set of data using Minitab version15. Seedlings were also fixed in 3 : 1 absolute ethanol : glacial acetic acid and Feulgen stained (Armstrong and Francis, 1985). Using a stereo dissecting microscope (Nikon Z100), primary root length, the number of lateral root primordia and number of lateral roots were recorded. Additionally, hypocotyls were excised from the main root system and the number of adventitious roots forming on them was scored similarly.
Seventeen-day-old seedlings were used for the RAM analyses. Roots were fixed and mounted on slides in 8 : 3 : 1 chloral hydrate : distilled water : glycerol taking care to gently apply a coverslip (Perilli and Sabatini, 2010). Cell length, breadth and number were measured in three tissues of the RAM – epidermis, cortex and stele – using a ZeissAxiophot set for DIC (differential interference contrast) interfaced to image analysis software [PixiLINK (C) Capture S.E.]. Measurements were taken along longitudinal files of cells of epidermis, cortex and mid-stele until the parameter spanned a cell that suddenly increased its cell length/width substantially compared with the previous one. For all genotypes, and for all tissues, this was between a 1·40- and a 1·95-fold increase. This was the transition point beyond which those cells began to elongate substantially and is taken to be the basipetal border of the promeristem for each tissue.
Cell-doubling times (CDTs)
Primary root tips of 12-d-old seedlings were exposed to a 0·125 % (w/v) solution of colchicine (Sigma). At 30-min intervals seedlings were fixed in 3 : 1 absolute ethanol : glacial acetic acid, hydrolysed in 5 m HCl for 20 min at 25 °C and stained with Feulgen and monolayers of RAMs were prepared in Acetic Orcein stain (Armstrong and Francis, 1985). CDTs were calculated from the linear rate of metaphase accumulation (linear regression coefficient) using the formulae of Clowes (1976) and methods of Evans et al. (1957).
RESULTS
Altering the expression of WEE1 affects morphogenesis from hypocotyls in vitro
In a previous report, De Schutter et al. (2007) were unable to generate a line constitutively over-expressing WEE1 using the 35S promoter. To study the potential effects of Arath;WEE1 expression on arabidopsis growth and development, we have been able to generate transgenic lines in which Arath;WEE1 expression is driven by an attenuated CaMV 35S promoter (Gatz et al., 1992). Two lines showing a high level of expression of Arath;WEE1 (WEE1oe #58 and #61) were selected by RT-PCR (Fig. 1). Compared with WT, the level of WEE1 expression was 10- and 54-fold higher in lines #58 and #61, respectively (Fig. 1). Given the reported negative effects of a strong constitutive expression of WEE1 described by De Schutter et al. (2007), we chose line #58, showing weaker over-expression, for most of the measurements reported here, although comparative phenotypic data for both lines #58 and #61 indicate very similar responses between these genotypes. We further employed two T-DNA insertion lines for WEE1, wee1-1and wee1-4. The former has a T-DNA insertion in the seventh intron and has been characterized by De Schutter et al. (2007) as a line lacking WEE1 transcription. The latter originated from the GABI-Kat collection of T-DNA insertion lines (Rosso et al., 2003) and carries an insertion in the 5'-UTR. Neither of these lines exhibited WEE1 kinase activity either in the presence or absence of hydroxyurea (Lentz Grønlund, 2007), a drug known to cause transcriptional up regulation of WEE1 and induction of WEE1 kinase activity in wild-type arabidopsis (De Schutter et al., 2007; Lentz Grønlund, 2007).
Fig. 1.
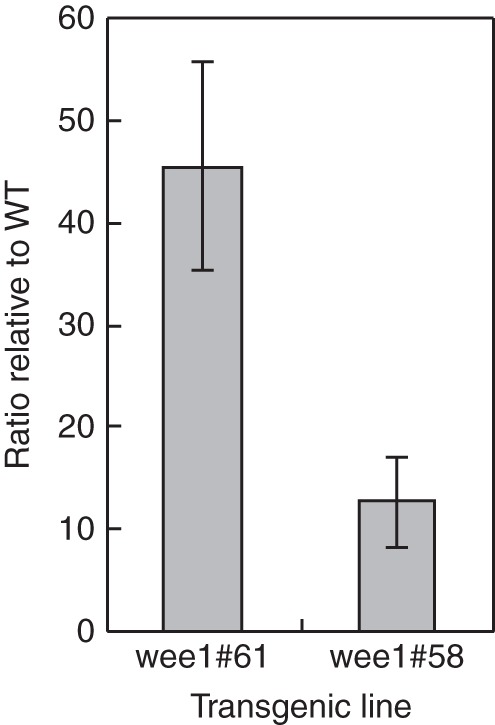
Molecular characterization of WEE1oe genotypes: semi-quantitative RT-PCR of Arath;WEE1 showing increased expression in the two transgenic lines (#58 and #61) compared with WT (mean ± s.e., n = 3).
In initial experiments, we applied the Inoue et al. (2001) tissue culture system comprising a two-way grid of increasing auxin (NAA) and cytokinin (Kin) concentrations ranging from 25 to 300 ng mL−1 (Supplementary Data Fig. S2). From here on, these are represented by a simplified notation. For example, 25NAA/50Kin represents 25 ng mL−1 of NAA and 50 ng mL−1 of kinetin. Hypocotyl culture was performed with the two independent WEE1 over-expressing lines but as there was no significant difference in the in vitro response between the two lines, results are from one set of grids (Arath;Wee1oe #58).
In the absence of NAA there was neither growth nor morphogenesis in cultured hypocotyls in any of the genotypes (observations not shown) indicating an auxin requirement for arabidopsis hypocotyls in culture, confirming the results of Inoue et al. (2001). A minimum level of NAA (25 ng mL−1) was required for callus induction from hypocotyls in all genotypes. In the absence of kinetin, callus formed providing NAA was added (25NAA/0Kin), but morphogenesis did not occur (observations not shown).
In general, levels of morphogenesis in WT hypocotyls increased when both NAA and kinetin concentrations were raised, confirming the results of Inoue et al. (2001) (Supplementary Data Fig. S2). However, hypocotyls from WEE1oe (Arath;WEE1 over-expressing) plants exhibited poor morphogenetic responses compared with WT at ≥100 NAA. In other words, a repression of growth and morphogenesis in hypocotyls of WEE1oe was more acute at a threshold ≥100 NAA.
The grid responses for the T-DNA insertion lines were more similar to WT than the WEE1oe (Supplementary Data Fig. S2) but overall there was a higher level of morphogenesis in wee1-1 and wee1-4 compared with WT. This is consistent in showing a WEE1 gene dosage effect on morphogenetic competence of cultured hypocotyls at NAA concentration ≤50 NAA albeit more so for wee1-1 than wee1-4.
Following this initial qualitative analysis across a wide range of NAA/Kin concentrations, we selected three combinations of exogenous NAA/Kin concentrations from the grid system that induced typical differential responses of hypocotyls of WEE1oe relative to WT and the two T-DNA insertion lines for a more rigorous quantitative analysis using 25 replicates per genotype. These were: firstly, 25NAA/25Kin and, secondly, 50NAA/200Kin for which callus growth was not evident in WEE1oe; thirdly, 200NAA/50Kin in which WT, wee1-1 and wee1-4 exhibited morphogenesis but WEE1oe did not; and, finally, 300NAA/300Kin in which morphogenesis was strong in WT, wee1-1 and wee1-4 but less so in WEE1oe (Supplementary Data Fig. S2).
At 25NAA/25Kin, there was a significant increase in the number of shoots produced by the wee1-1 and wee1-4 hypocotyls compared with WT (P < 0·02; Fig. 2A). In addition, compared with WT there was a significant increase in the number of roots produced in wee1-1 and wee1-4 (P ≤ 0·05; Fig. 2B). Apart from WEE1oe, the other genotypes produced callus but wee1-1 and wee1-4 produced a significantly greater area of callus compared with WT (Fig. 2C; P ≤ 0·05). At 50NAA/200Kin, a significantly greater number of shoots, but not roots, was produced by wee1-1 and wee1-4 hypocotyls (P < 0·002) (Fig. 2A, B). Note the null growth response of WEE1oe hypocotyls at ≤50 NAA (Fig. 2A–C) confirming the original qualitative grid observations.
Fig. 2.
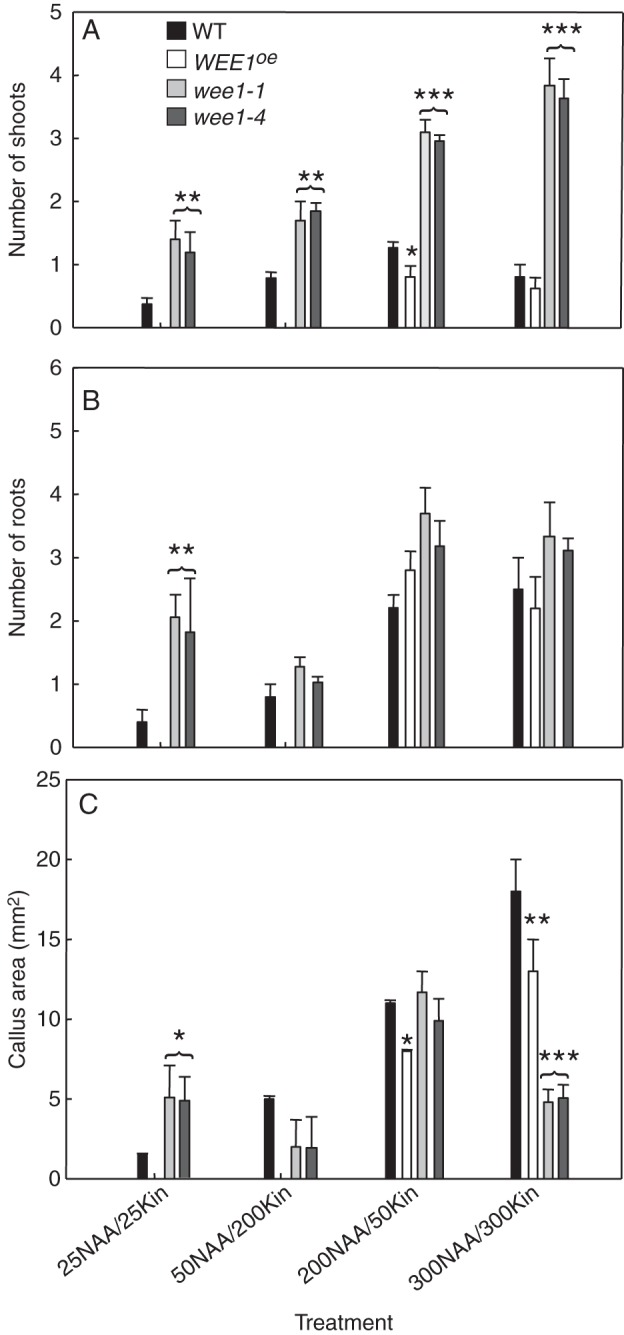
Differential growth and morphogenetic responses from hypocotyls in vitro. Mean number (± s.e.) of (A) shoots (B) roots (C) callus area in 30-d-old cultures of 14-d-old hypocotyls of wild type (WT), over-expressing Arath;WEE1 line #58 (WEE1°e), and the T-DNA insertion lines for WEE1, wee1-1 and wee1-4, cultured on MS medium supplied with a range of concentrations of kinetin (Kin ng mL−1) and naphthyl acetic acid (NAA ng mL−1) for 30 d. Significance levels are P-values from Student's t-tests between each genotype and WT: *, P < 0·05; **, P < 0·02; ***, P < 0·001 (n = 25).
At 200NAA/50Kin, the number of shoots forming in wee1-1 and wee1-4 was significantly higher than WT (P < 0·001; Fig. 2A). In WEE1oe, shoots formed at this combination but the mean number was significantly lower than WT (P < 0·05). At this NAA/Kin combination there were no significant differences in rooting frequency between genotypes (Fig. 2B). At 300NAA/300Kin, significantly more shoots formed in the loss-of-function wee1-1 and wee1-4 genotypes compared with WT (P < 0·001; Fig. 2A) but there was no significant difference in the number of shoots that formed in WEE1°e compared with WT (P > 0·05; Fig. 2A). Regarding roots, there were no significant differences between genotypes at this NAA/Kin combination (P > 0·05; Fig. 2B). Callus growth was significantly less in wee1-1 and wee1-4 (P < 0·001), and so too for WEE1oe compared with WT (P ≤ 0·02) (Fig. 2C).
Overall, the quantitative data show that hypocotyls from wee1-1 and wee1-4 were more competent to root (at 25NAA/25Kin) and shoot (in all combinations) than WT. In contrast, hypocotyls from WEE oe plants neither grew nor initiated morphogenesis at 25NAA/25Kin or 50NAA/200Kin; WEE oe cultures were only able to exhibit morphogenesis once the concentration of NAA was raised to 200 and 300 ng mL−1. In summary, a WEE1 gene dosage effect on morphogenetic competence in both root and shoot production was revealed at 25NAA/25Kin and on shooting in all combinations.
Altering WEE1 expression in arabidopsis seedlings affects root growth and developmental responses in 10-d-old seedlings
Repression of growth and morphogenesis by WEE1oe, contrasting with promotion in wee1-1 and wee1-4 hypocotyl explants prompted an analysis of the root phenotype in both genotypes. Thus, primary root length and the number of lateral roots that formed per unit length of primary were examined in 10- or 24-d-old seedlings of each genotype.
Daily measurements established that root elongation was significantly reduced in WEE1oe compared with WT (Fig. 3A) whereas primary root length per unit time in wee1-1 and wee1-4 was no different from WT (Fig. 3B, C). Note the virtually identical phenotypic response of #58 and #61, and, wee1-1 and wee1-4 (Fig. 4B). Root length is the result of cell division in the RAM and elongation growth of cells displaced from the RAM.
Fig. 3.
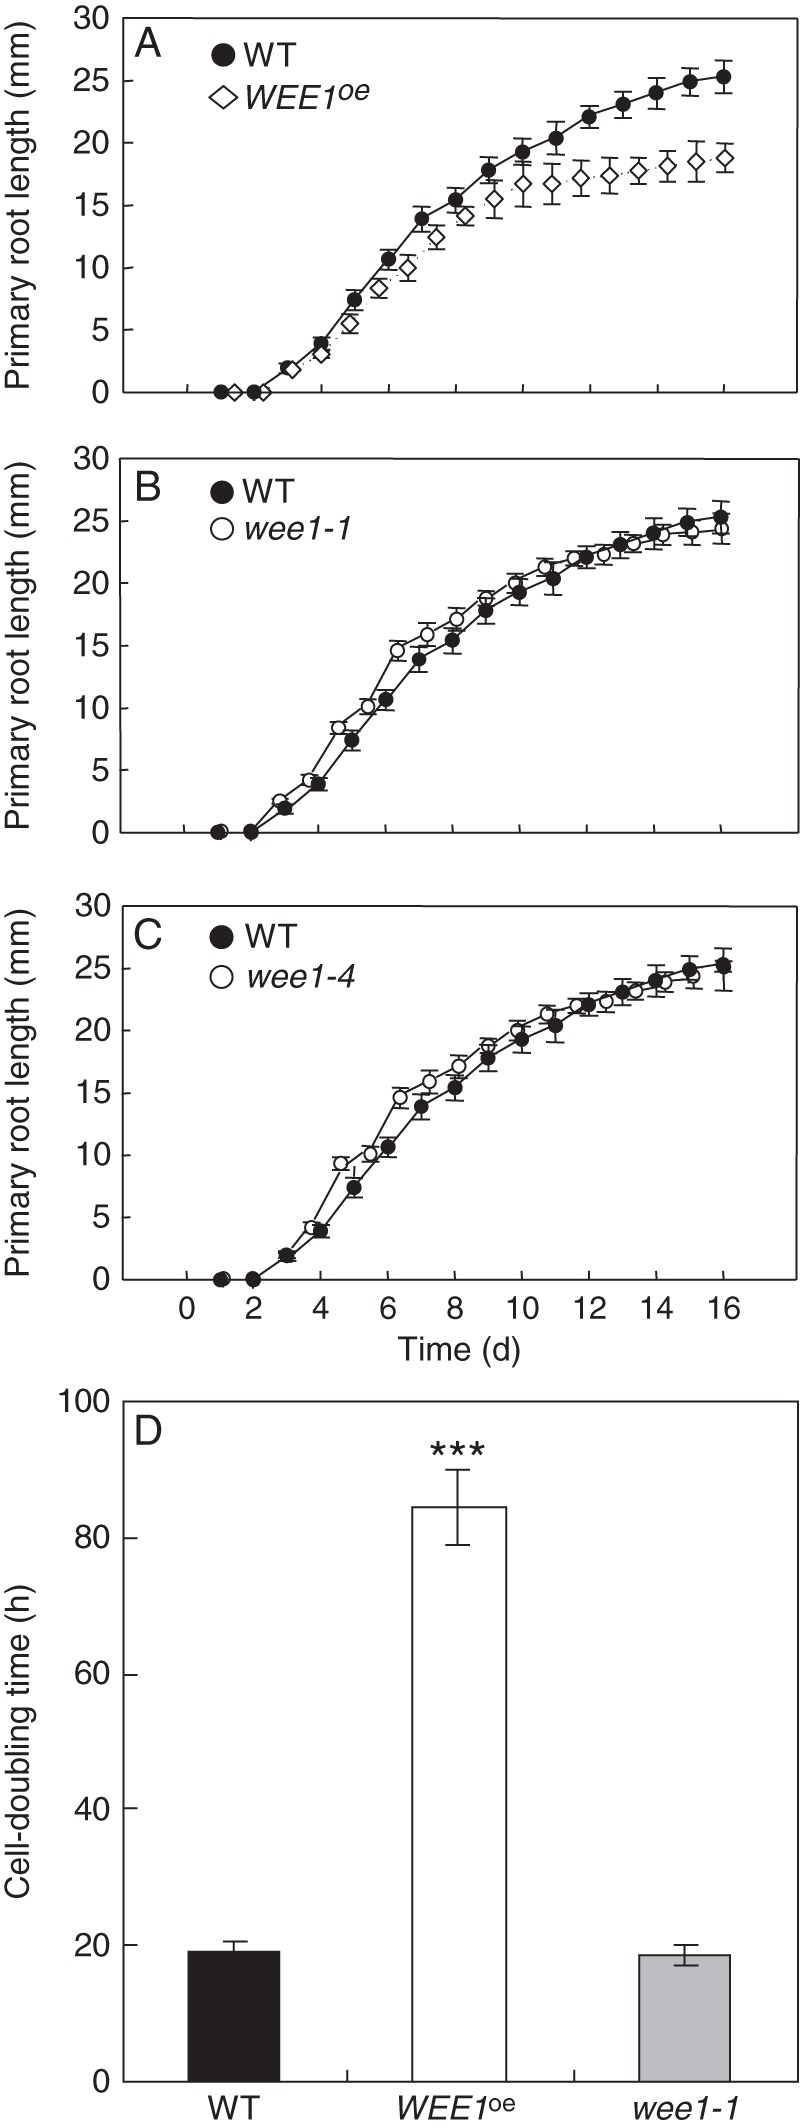
Elongation and cell cycle response in WEE1oe and wee1 mutants compared with wild type (WT). Relationship between mean (± s.e.) primary root length (mm) and time (d) following germination in arabidopsis genotypes: (A) WEE1oe (line #58), (B) wee1-1; (C) wee1-4 at 21 °C (n = 10–15). (D) Mean cell-doubling time in the RAM for WT, WEE1oe and wee1-1. Significance levels are P-values from Student's t-tests between each genotype and WT (n = 6 ± s.e.): ***, P < 0·001.
Fig. 4.
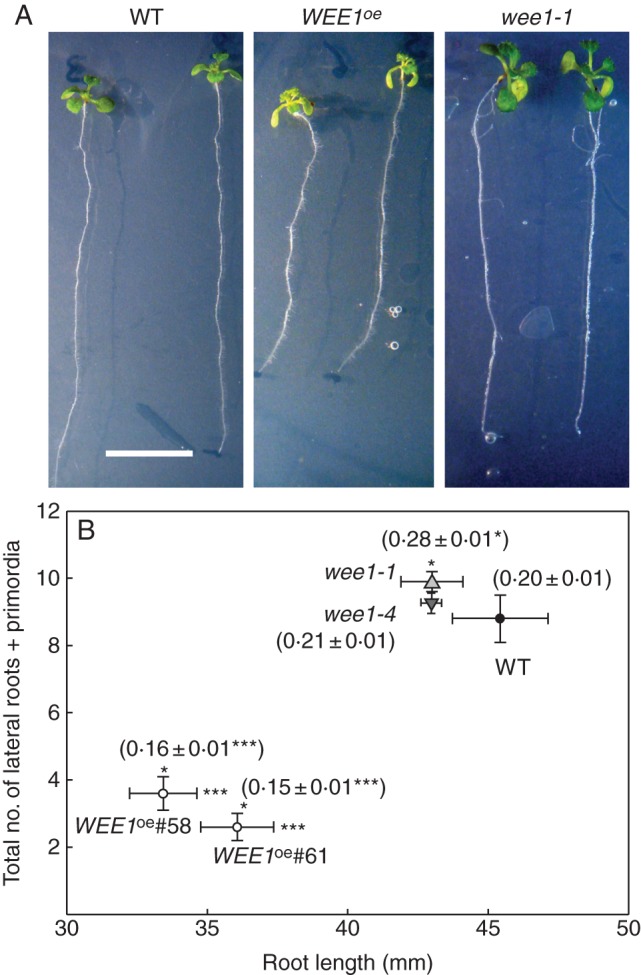
WEE1 represses lateral root formation: WEEoe inhibits and loss-of-function alleles show increased lateral root formation. (A) Phenotypes of 10-d-old arabidopsis seedlings: wild type (WT), WEE1oe (line #58) and wee1-1 (scale bar = 10 mm). (B) The relationship between mean total number of lateral roots and lateral root primordia (± s.e.) and mean primary root length (mm ± s.e.) for 10-d-old seedlings grown at 20 °C: wild type (WT), two WEE1 over-expressing lines (WEE1oe), #58 and #61, and two T-DNA insertion lines wee1-1 and wee1-4. Significance levels are P-values from Student's t-tests between each genotype and WT. Root length was significantly reduced in WEE1oe #58 and #61 compared with WT (*P < 0·05), but was not significantly different from WT (P > 0·05) in wee1-1 and wee1-4. Numbers of laterals and primordia were significantly different from WT in WEE1oe #58 and #61 (***, P < 0·001) and wee1-1 (**, P < 0·02). Mean (± s.e.) rate of lateral root formation per millimetre of primary is indicated in brackets above each symbol (n =10; *, P < 0·05; ***, P < 0·001).
To examine the proliferative contribution to this elongation response, we measured CDTs in the RAM of WEE1oe #58, wee1-1 and WT. Compared with WT there was an over 4-fold lengthening in the CDT in WEE1oe (#58) but there was no clear alteration of CDT in wee1-1 (Fig. 3D). Note that the method used to estimate CDTs relies on temporal accumulation of cells in metaphase per unit time following continuous exposure of roots to colchicine. The method does not lead to definitive measures of rates of cell division in meristems but is used here for comparative purposes. Overall the data are consistent in showing that WEE1 gain-of-function led to a reduction but not complete inhibition of root growth compared with WT, whereas loss-of-function had a null effect (Fig. 3).
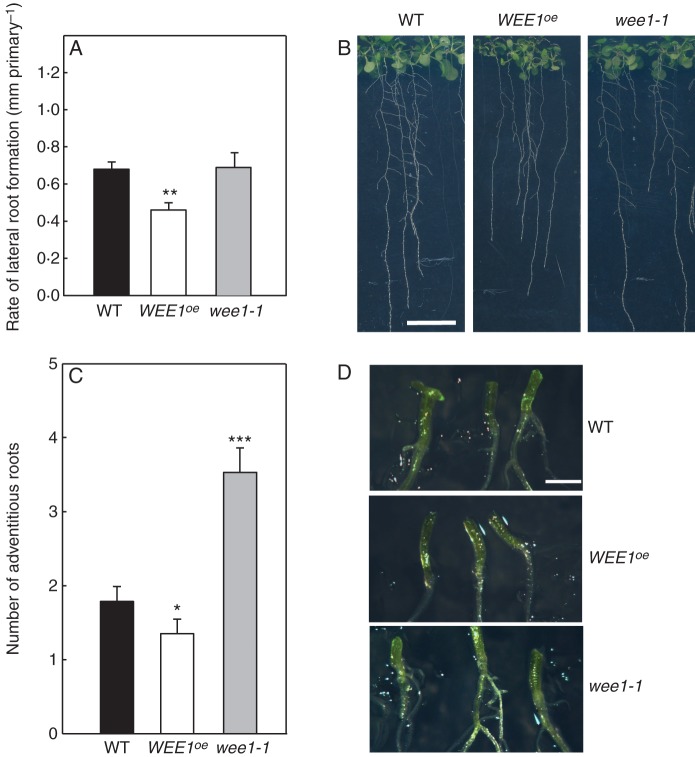
Scoring the number of lateral root primordia and number of emerged lateral roots in 10-d-old seedlings revealed a significant reduction in root length in both WEE1oe lines, and also the rate of lateral root formation was significantly lower in both WEE1oe genotypes (Fig. 4B). Conversely, compared with WT there were significant increases in the number of laterals that formed per millimetre of primary in wee1-1 (Fig. 4B). Hence, compared with WT, the greater morphogenetic competence of wee1-1 and wee1-4 hypocotyls in vitro was also evident in vivo regarding increased numbers of secondary roots per unit length of primary. To check on the relative persistence of the phenotypes, the analysis was repeated on 17-d-old WEE1oe #58 and wee1-1 seedlings. Compared with WT, the rate of lateral root formation was significantly lower (P < 0·02) in the WEE1oe #58 genotype (Fig. 5A, B). However, there was no significant difference between wee1-1 and WT (P > 0·05; Fig. 5A, B).
Fig. 5.
Differential lateral root and adventitious root phenotypes of wild type (WT), WEEoe #58, and the T-DNA insertional line, wee1-1: (A) mean (± s.e.) rates of lateral root formation per millimetre of primary root; (B) primary and lateral roots in 17-d-old seedlings (scale bar = 10 mm); (C) mean number and (D) images of adventitious roots from hypocotyls of 24-d-old seedlings (scale bar = 1 mm). Significance levels are P-values from Student's t-tests between each genotype and WT: *, P < 0·05; **, P < 0·02; ***, P < 0·001 (n= 25).
Given that hypocotyls were the source of explants in the grid experiments, we tested whether the null phenotype of the insertion mutants also applied to adventitious root formation from hypocotyl explants. Compared with WT, there was a significant decrease in the number of adventitious roots recorded in WEE1oe in 24-d-old seedlings (Fig. 5; P < 0·05). Conversely, this score was significantly higher for wee1-1 compared with WT (Fig. 5; P < 0·001). Hence a gene dosage effect on adventitious root formation is clearly observable from hypocotyls, supporting the results obtained from hypocotyls cultured on the grids.
In summary, there were subtle phenotypes in the lines in which WEE1 expression was perturbed. The in vivo lateral root phenotypic analysis revealed no consistent differences between the WEE1 loss-of-function genotype in seedlings compared with WT. However, analysis of hypocotyls in vivo revealed a greater capacity to form adventitious roots in wee1-1 (matching their greater morphogenetic competence in vitro) compared with WT. Conversely WEE1oe was less able to form lateral or adventitious roots compared with WT.
WEE1 over-expression increases cell size and cell number in the RAM
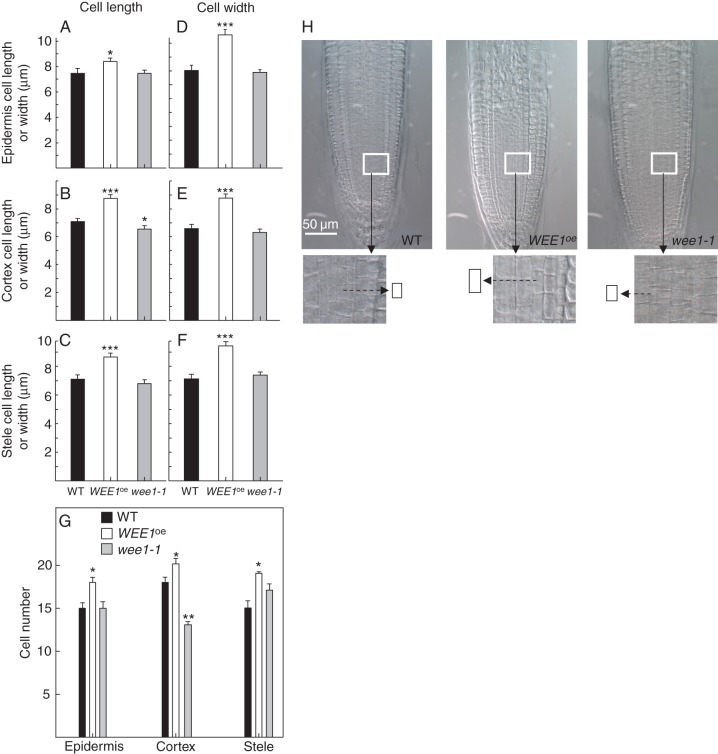
A hallmark feature of Arath;WEE1 is that it induced a longer cell size when over-expressed in fission yeast (e.g. Sorrell et al., 2002). Given WEE1's repressive effect on root growth we next tested its effect on cell size in the RAM. Here, we measured cell length and cell width in the ground tissues of the RAM – epidermis, cortex and mid-stele – identified as spanning from the root cap/apical meristem junction to the transition point when cells in each tissue begin an irreversible mode of cell elongation (see Dello Ioio et al., 2007).
In WEE1oe RAMs, cell length and cell width were significantly longer in all three meristematic tissues compared with WT (Fig. 6 A–F, H) and there was a significantly greater number of cells in epidermal, cortical and stelar lineages of the RAM in WEE1oe compared with WT (Fig. 6G). Although, in wee1-1 RAM, cell length and cell breadth tended to be smaller in each tissue it was only significantly so for cell length in the cortex (Fig. 6B, H). Consequently, cell number in the epidermal and stelar lineages did not differ appreciably in wee1-1 compared with WT, although there were significantly fewer cells in the cortical lineage (Fig. 6G). Hence, a cellular gain-of-function and loss-of-function WEE1 cellular phenotype was restricted to the cortex.
Fig. 6.
Measurements of cell size and cell number in WT, WEE1oe #58 and wee1-1 root meristems: mean ± s.e. cell length (A–C) and breadth (D–F) in epidermis, cortex and stele meristems of wild type (WT), the T-DNA insertional line wee1-1 and in WEE1oe together with mean ± s.e. meristem cell file number × 10−3 for each genotype (G). (A–F) Unpaired Student's t-tests: 25 ≤ n ≤ 95; (G) paired Student's t-tests (***, P < 0·001; *, P < 0·05); (H) representative 17-d-old WT, WEE1oe #58 and wee1-1 whole root tips imaged by DIC microscopy. Magnified sections are shown below, with the size of an individual cell illustrated next to each image, indicating the enlargement of stelar cell size in WEE1oe compared with WT.
DISCUSSION
Our data are consistent in showing a repression of growth and morphogenesis from hypocotyls in vitro when WEE1 is over-expressed. In support of this, the loss of function wee-1-1 and wee1-4 mutant hypocotyls showed a greater capacity for morphogenesis in vitro at specific NAA/Kin combinations. In other words, for hypocotyls in vitro, an abundance and significant loss of WEE1 transcripts is consistent with repressed or enhanced growth/morphogenesis, respectively.
Cultured hypocotyls from Arath;WEE1 over-expressing plants exhibited neither root nor shoot morphogenesis at NAA concentrations of ≤100 ng mL−1 and WEE1oe retarded root growth. When WEE1 is over-expressed in tobacco BY-2 cells, G2 is delayed (Gonzalez et al., 2007). Moreover, WEE1 over-expression caused a marked lengthening of mean CDT in RAMs of arabidopsis. Taken together, these independent experiments show that elevated expression of WEE1 can suppress or delay mitosis, slows cell division and root growth and represses morphogenesis both in vivo and in vitro. That the repression of morphogenesis in the WEE1oe could be partially reversed by exogenous NAA in vitro (≥200 ng mL−1) suggests that WEE1 might be regulated by an auxin signal transduction pathway. Certainly, auxin-regulated SCF complexes serve to remove negative regulators in more defined genetic pathways (e.g. Gray et al., 2001). Note that local production and subsequent accumulation of auxin in pericycle cells converts them into founder cells for lateral root morphogenesis (Dubrovsky et al., 2009). Also, in a global transcriptional analysis of cell cycle genes in arabidopsis it was suggested that the down-regulation of WEE1 might be important for lateral root initiation (de Almeida Engler et al., 2009). Hence, the arrival of auxin and the down-regulation of WEE1 in pericycle cells that then divide may be more than coincidental.
In vivo, WEE1oe repressed primary root growth and decelerated the rate of lateral initiation in seedlings. However, there was no consistent effect of WEE1 loss of function on seedling root growth. That the in vivo data for roots did not entirely support the in vitro data for hypocotyls should not be too surprising given that different tissue systems were assessed. However, in vitro, wee1-1 hypocotyls (the organs used in the grids experiments) did exhibit a significantly higher frequency of adventitious roots compared with WT, whilst WEE1oe hypocotyls formed significantly fewer adventitious roots. Thus, these observations are consistent with a gene dosage effect of WEE1 in arabidopsis hypocotyls. Hence, we suggest that WEE1 might have a role at a growth/developmental interface in addition to its role in cell-cycle checkpoints. Clearly, the primary effect of WEE1 over-expression is to slow down cell division as evidenced by markedly lengthened cell-doubling times (CDTs) and the failure of WEE1oe hypocotyls to exhibit anything other than poor callus growth in vitro (at <100 ng NAA). Hence, the simplest explanation for these results is a dampening of cell division and a consequential lack of morphogenesis in vitro.
At the cellular level in the RAM, WEE1 over-expression induced larger cells in the meristem, whereas in wee1-1 cell size was clearly reduced in the cortex. Thus, Arath;WEE1 over-expression in arabidopsis induces an increased cell size in the RAM as it does in fission yeast (Sorrell et al., 2002). This increase in cell size occurred alongside an increased cell number in cell lineages up to the transition point of each ground tissue of the RAM but occurred alongside substantially slower CDTs and slower rates of primary elongation compared with WT. In contrast, cortical cell size and cortical cell number in the RAM was reduced in wee1-1 compared with WT. This reduction in cortical cell size and number has no effect either on rate of primary root elongation or mean CDT in the RAM of wee1-1 compared with WT. Much conflicting literature exists on cell size and organ growth in plants and hence clear rules have not been established regarding meristem cell size and rates of root elongation (for example, see Barlow and Rathfelder, 1984; Beemster et al., 2003). Our data indicate a WEE1 dosage effect on cortical cell size in RAMs of arabidopsis which is also consistent with the known effect of WEE1 in enlarging cells in tomato fruits (Gonzalez et al., 2007).
Perturbation of cell cycle genes does not always affect development despite effects at a cellular level. For example, a dominant negative Arath;CDKA1;1 allele expressed in tobacco resulted in fewer but larger cells, whilst development of those plants was unaffected (Hemerly et al., 1995). Plants expressing a dominant negative allele of Arath;CDKB1;1 were also normal, but again with fewer and larger cells with long G1 phases (Porceddu et al., 2001). Indeed, these data support the organismal theory of development where cell division is merely a functional consequence of inherent developmental programmes (Kaplan and Hagemann, 1991). On the other hand, perturbation of other cell-cycle genes has profound effects on development. For example, disruption of CDKB2 interfered with normal cell cycle progression and induced severe defects in the shoot apical meristem of arabidopsis (Andersen et al., 2008). CDKB2 featured as a vital cog in a gene expression network that included WUSCHEL and SHOOTMERISTEMLESS, genes that are essential for normal function of the vegetative shoot apical meristem (Andersen et al., 2008). Also, over-expression of KRP1 (an inhibitor of CDK activity) in arabidopsis, resulted in a distinct reduction in the frequency of lateral roots (Himanen et al., 2002). Our data are consistent with a perturbation of WEE1 having consequent effects on development. Indeed, our observations support the conclusion of Wang et al. (2007), from their studies of KRPs, that cell division, growth and development are intrinsically intertwined. However, given that the effects are subtle, this argues for a network of control including other positive and negative regulators probably acting in a partially redundant fashion.
SUPPLEMENTARY DATA
ACKNOWLEDGEMENTS
We are grateful to Lyndon Tuck for assistance with growth of plants, and Steve Hope for sequencing.
LITERATURE CITED
- de Almeida Engler J, De Veylder L, De Groodt S, et al. Systematic analysis of cell-cycle gene expression during Arabidopsis development. The Plant Journal. 2009;59:645–660. doi: 10.1111/j.1365-313X.2009.03893.x. [DOI] [PubMed] [Google Scholar]
- Andersen SU, Buechel S, Zhao Z, et al. Requirement of B2-type cyclin dependent kinases for meristem integrity in Arabidopsis thaliana. The Plant Cell. 2008;20:88–100. doi: 10.1105/tpc.107.054676. [DOI] [PMC free article] [PubMed] [Google Scholar]
- Armstrong SW, Francis D. Differences in cell cycle duration of sister cells in secondary root meristems of Cocos nucifera L. Annals of Botany. 1985;56:803–814. [Google Scholar]
- Barlow PW, Rathfelder L. Correlations between the dimensions of different zones of grass root apices, and their implications for morphogenesis and differentiation in roots. Annals of Botany. 1984;53:249–260. [Google Scholar]
- Beemster GTS, Fiorani F, Inze D. Cell cycle: the key to plant growth control? Trends in Plant Science. 2003;8:154–158. doi: 10.1016/S1360-1385(03)00046-3. [DOI] [PubMed] [Google Scholar]
- Clough SJ, Bent AF. Floral dip: a simplified method for Agrobacterium-mediated transformation of Arabidopsis thaliana. The Plant Journal. 1998;16:735–743. doi: 10.1046/j.1365-313x.1998.00343.x. [DOI] [PubMed] [Google Scholar]
- Clowes FAL. Estimation of growth fractions in meristems of Zea mays L. Annals of Botany. 1976;40:933–938. [Google Scholar]
- Dello Ioio R, Scaglia Linhares F, Scaachi R, Costantino P, Sabatini S. Cytokinins determine Arabidopis root-meristem size by controlling cell differentiation. Current Biology. 2007;17:678–682. doi: 10.1016/j.cub.2007.02.047. [DOI] [PubMed] [Google Scholar]
- De Schutter K, Joubes J, Cools T, et al. Arabidopsis WEE1 kinase controls cell cycle arrest in response to activation of the DNA integrity checkpoint. The Plant Cell. 2007;19:211–225. doi: 10.1105/tpc.106.045047. [DOI] [PMC free article] [PubMed] [Google Scholar]
- Dubrovsky JG, Sauer M, Napsucialy-Mendivil S, et al. Auxin acts as a local morphogenetic trigger to specify lateral root founder cells. Proceedings of the National Academy of Sciences of the USA. 2009;105:8790–8794. doi: 10.1073/pnas.0712307105. [DOI] [PMC free article] [PubMed] [Google Scholar]
- Evans HJ, Neary GJ, Tonkinson SM. The use of colchicine as an indicator of mitotic rate in broad bean root meristems. Journal of Genetics. 1957;55:487–502. [Google Scholar]
- Gatz C, Frohberg C, Wendenberg R. Stringent repression and homogenous derepression by tetracycline of a modified CaMV 35S promoter in intact transgenic tobacco plants. The Plant Journal. 1992;2:397–404. doi: 10.1111/j.1365-313x.1992.00397.x. [DOI] [PubMed] [Google Scholar]
- Gonzalez N, Gevaudant F, Hernould M, Chevalier C, Mouras A. The cell cycle associated protein kinase WEE1 regulates cell size in relation to endoreduplication in developing tomato fruit. The Plant Journal. 2007;51:642–655. doi: 10.1111/j.1365-313X.2007.03167.x. [DOI] [PubMed] [Google Scholar]
- Gray WM, Kepinski S, Rouse D, Leyser O, Estelle M. Auxin regulates SCFTIR1-dependent degradation of AUX/IAA proteins. Nature. 2001;414:271–276. doi: 10.1038/35104500. [DOI] [PubMed] [Google Scholar]
- Hemerly A, de Almeida Engler J, Bergounioux C, et al. Dominant negative mutants of Cdc2 kinase uncouple cell division from iterative plant development. EMBO Journal. 1995;14:3925–3936. doi: 10.1002/j.1460-2075.1995.tb00064.x. [DOI] [PMC free article] [PubMed] [Google Scholar]
- Himanen K, Boucheron E, Vaneste S, de Almeida Engler J, Inze D, Beeckman T. Auxin-mediated cell cycle activation during early lateral root initiation. The Plant Cell. 2002;14:2339–2351. doi: 10.1105/tpc.004960. [DOI] [PMC free article] [PubMed] [Google Scholar]
- Inoue T, Higuchi M, Hashimoto Y, et al. Identification of CRE1 as a cytokinin receptor from Arabidopsis. Nature. 2001;409:1060–1063. doi: 10.1038/35059117. [DOI] [PubMed] [Google Scholar]
- Kaplan DR, Hagemann W. The relationship of cell and organism in vascular plants: are cells the building blocks of plant form? Bioscience. 1991;41:693–703. [Google Scholar]
- Lentz Grønlund A. 2007 Regulatory mechanisms of the plant G2/M transition. PhD Thesis, Cardiff University, Cardiff, UK. [Google Scholar]
- Mueller PR, Coleman TR, Kumagai A, Dunphy WG. Myt1: a membrane-associated inhibitory kinase that phosphorylates Cdc2 on both threonine-14 and tyrosine-15. Science. 1995;270:86–90. doi: 10.1126/science.270.5233.86. [DOI] [PubMed] [Google Scholar]
- Murashige T, Skoog F. A revised medium for rapid growth and bioassays with tobacco tissue cultures. Physiologia Plantarum. 1962;15:473–479. [Google Scholar]
- Norbury C, Nurse P. Animal cell cycles and their control. Annual Review of Biochemistry. 1992;61:441–470. doi: 10.1146/annurev.bi.61.070192.002301. [DOI] [PubMed] [Google Scholar]
- Perilli S, Sabatini S. Analysis of root meristem size development. In: Henig L, Köhler C, editors. Plant developmental biology, methods in molecular biology 655. Heidelberg: Springer; 2010. pp. 177–187. [DOI] [PubMed] [Google Scholar]
- Porceddu A, Stals H, Reichheld JP, et al. A plant-specific cyclin-dependent kinase is involved in the control of the G2M transition in plants. Journal of Biological Chemistry. 2001;276:36354–36360. doi: 10.1074/jbc.M011060200. [DOI] [PubMed] [Google Scholar]
- Price AM, Aros Orellana DF, Stevens R, et al. A comparison of leaf and petal senescence in wallflowers (Erysimum linifolium) reveals common and distinct patterns of gene expression and physiology. Plant Physiology. 2008;147:1898–1912. doi: 10.1104/pp.108.120402. [DOI] [PMC free article] [PubMed] [Google Scholar]
- Rhee SY, Beavis W, Berardini TZ, et al. The Arabidopsis Information Resource (TAIR): a model organism database providing a centralized, curated gateway to Arabidopsis biology, research materials and community. Nucleic Acids Research. 2003;31:224–228. doi: 10.1093/nar/gkg076. [DOI] [PMC free article] [PubMed] [Google Scholar]
- Rosso MG, Li Y, Strizhov N, Reiss B, Dekker K, Weisshaar B. An Arabidopsis thaliana T-DNA mutagenized population (GABI-Kat) for flanking sequence tag-based reverse genetics. Plant Molecular Biology. 2003;53:247–259. doi: 10.1023/B:PLAN.0000009297.37235.4a. [DOI] [PubMed] [Google Scholar]
- Russell P, Nurse P. Negative regulation of mitosis by wee1+, a gene encoding a protein kinase homolog. Cell. 1987;49:559–567. doi: 10.1016/0092-8674(87)90458-2. [DOI] [PubMed] [Google Scholar]
- Shimotohno A, Umeda M. CDK phosphorylation. In: Inze D, editor. Cell cycle control and plant development. Oxford: Blackwell Publishing; 2007. pp. 114–137. [Google Scholar]
- Sorrell DA, Marchbank A, McMahon K, Dickinson JR, Rogers HJ, Francis D. A WEE1 homologue from Arabidopsis thaliana. Planta. 2002;215:518–522. doi: 10.1007/s00425-002-0815-4. [DOI] [PubMed] [Google Scholar]
- Wang H, Zhou Y, Antonio J, Acosta T, Fowke LC. CDK inhibitors. In: Inze D, editor. Cell cycle control and plant development. Oxford: Blackwell Publishing; 2007. pp. 62–86. [Google Scholar]
Associated Data
This section collects any data citations, data availability statements, or supplementary materials included in this article.


