

Abstract
We tested the underlying assumption that citation counts are reliable predictors of future success, analyzing complete citation data on the careers of  scientists. Our results show that i) among all citation indicators, the annual citations at the time of prediction is the best predictor of future citations, ii) future citations of a scientist's published papers can be predicted accurately (
 for a 1-year prediction,
  ) but iii) future citations of future work are hardly predictable.
Introduction
Many decisions with regard to the allocation of research funds and the assignment of positions are based on citation counts [1]–[4]. Citation counts are considered for awarding post-doctoral fellowships, assigning junior faculty positions and tenures [5]–[10]. However, it remains unclear whether citation-based indicators are appropriate measures to judge a scientist's future research quality [1], [11].
In this study, we analyzed complete panel data on the careers of more than  scientists. Considering various metrics of research quality, we tested the assumption that citation counts are reliable predictors of future scientific success, as measured by future citations. Recent studies have partially measured the predictive power of several citation indicators for scientists' future citations [1], [11]–[13]. However, because of the limited availability of data these analyses are performed on a small population of scientists, and hence cannot establish with confidence the connection between past and future citations. “There have been few attempts to discover which of the popular citation measures is best and whether any are statistically reliable” and “existing databases such as the ISI can therefore actively help to improve the situation by compiling field-specific homogeneous data sets similar to what we have generated for SPIRES” [1].
We considered a range of bibliometric indicators to assess scientists' research quality. Productivity and impact are the two main dimensions of research quality [14]–[17]. Some indicators such as the number of published papers and the mean annual number of publications only reflect scientists' productivity. Citation-based indicators, on the other hand, are used to index impact both at the level of single publications [18]–[20] and over individuals' careers (for example a scientist's mean citation per paper, or total number of citations) [5], [21]–[24]. However, the probability of an article being cited depends on various factors (e.g. time, field, journal, availability of the article, authors'social network) [24]–[27].
Hirsch proposed the widely-used h index, which combines both productivity and impact [12]. A scientist's h index value is defined as the maximum Natural number  for which the scientist has
  papers with at least
  citations. This gives a lower bound of
  citations to the scientist. In comparison with the cumulative number of citations, the h index is not critically inflated by a small number of highly cited papers. In the same study, Hirsch defined the m index as a scientist's h index value divided by the time (years) elapsed from the first publication of the focal scientist [12].
The applicability of h to evaluate scientists has been heavily investigated in the literature [12], [28], [29]. High profile scientists (e.g. Nobel laureates and members National of Academy of Sciences) generally score higher h index values. Bornmann and Daniel tested its applicability to junior scientists and showed that the decision of a peer-review committee to award long-term fellowships favored those applicants with higher h index values [30].
A similar citation indicator that combines productivity and impact is the g index [31]. A scientist's g index value it the highest number  of papers that receives
  or more citations. By definition for every scientist
  . The index inherits some good properties of the h index [32], The index has very different value than the h index for those who published few highly cited articles.
Results
We extracted citation information on the careers of  scientists from the Thomson Reuters Web of Science dataset. The careers comprise about 2 million papers and around
  million citations of the papers since
  . The number of papers per decade and the number of starting careers per decade are shows in Fig. 1. We used publication year, author list and list of references of the papers from the Thomson Reuters Web of Science dataset. Author names appeared as pairs of family name and initials (e.g. “S Genoud”). For some of the more recent journals, full first names of authors were also provided. With our dataset, we therefore faced the name ambiguity problem, i.e. an initial may refer to more than one unique author, and an author may have more than one initial. Name ambiguity is a big hurdle in analyzing individual careers for which there exist no standard solution [33]–[35]. A method applicable to one dataset may not perform well for another.
Figure 1. Histograms of a) number of papers per decade and b) number of starting careers per decade.
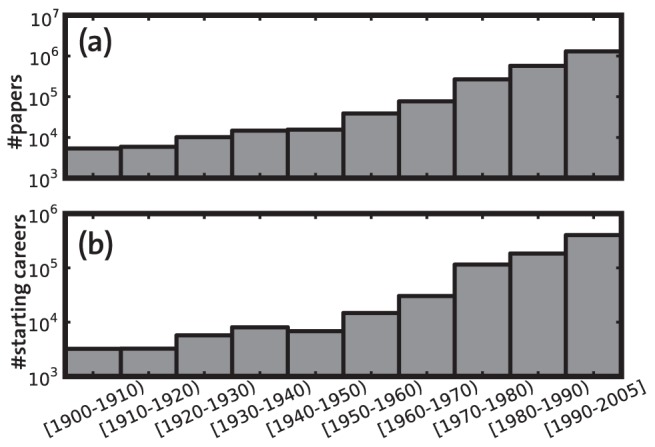
The publication year of a scientist's first paper is considered as the starting year of her career.
In our study, instead of solving the complicated name ambiguity problem, we avoided it by discarding author names that appeared with different initials. For instance, because “A Smith” and “B Smith” both exist in our dataset of more than  million initials, we discarded family name “Smith”, whereas family name “Ambonati” was selected because only one initial “M” was associated with it. This not only removes frequent family names, but also authors with different initials' spellings (e.g. “A Smith”, “AH Smith”, “HA Smith” may actually refer to the same author).
This procedure resulted in extracting more than one million family names associated with unique initials, for a total of about  million entries. Nevertheless, a family name with a unique initial may still refer to at least two authors with different first names (e.g. both Marco Ambonati and Mario Ambonati have initial M). By analyzing the papers for which full first names were also provided, we estimated the probability of such cases to be
  . There is also a miniscule probability that a family name with a unique initial and a unique first name belongs to at least two different authors. However, estimating this probability is impossible with our current data. We performed our analysis on more than
  scientists whose career length, calculated as the time gap between the first and the last paper, was longer than
  years. Our results were not sensitive to the minimum career-length selection criteria.
The result of ambiguity removal procedure is demonstrated in Fig. 2. The most ambiguous family name (“Wang”) appeared in the author lists of about  papers, and obviously does not refer to a unique author (Fig. 2a). After the removal of ambiguous names, the maximum frequency of a last name with unique initial is
  for the name “S Oparil”, as shown in Fig. 2b. Moreover, the general statistics of the selected papers such as the mean number of authors per paper (
 ) or the mean number of references per papers (
 ) remained the same.
Figure 2. Effect of removing authors with ambiguous names.

a) Cumulative distribution of the number of occurrences of family names in the author lists of distinct papers before the removal. b) Cumulative distribution of number of papers per scientists after removing ambiguous names.
At every year  during a scientist's career, our goal is to estimate two quantities: a) the total citations received by her papers published until and including year
  , in the
  subsequent years
  , and b) the citations of her papers published in the
  subsequent years
  , received in the
  subsequent years
  . For
. For  and
and  , for example, we estimated citations to the papers published in the year
  received in the two years
  and
and  . Obviously, the time of prediction
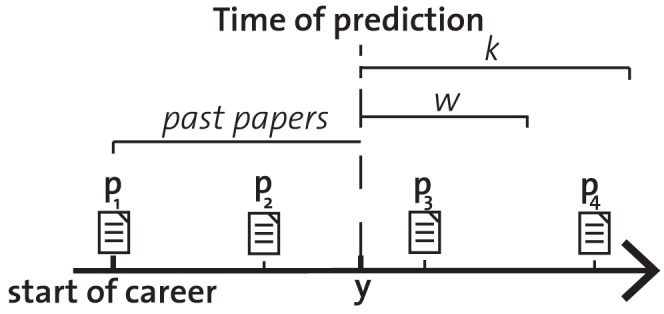
  varies between the publication year of her first to last paper (Fig. 3). Papers published before the time of prediction were treated as past papers and papers published afterwards as future papers. Obviously, future citations may refer to both past papers and future papers. Because the information about past citations of past papers is available at the time of prediction, estimating future citations of past papers is easier.
Figure 3. A schematic career for a scientist with .
 papers
 . We consider her career from her first paper
  . At prediction point
  , we estimate the citations received in
  of both past papers (
 and
and  ), and of future papers published in
  (
( ). Paper
  is a future paper which is not published in time-window
  , and therefore excluded for the time-windows as defined by
  and
and  .
.
The information that we used in our model is the value of  prominent citation indicators at the time of prediction, namely the number of papers, the total number of citations, the career length, the average number of published papers per year, the average annual citations, the annual citations at the time of prediction, the average citations per paper, the h index, the m index, and the g index.
The prediction points were time-lagged according to  and
and  . For
. For  , every
  year we added a prediction point. For
  the problem reduces to the case when
  is equal to
  . Because no paper published after the
  -th year receives citations within the first
  years. The earliest prediction point was
  years after the publication year of first paper. We therefore excluded the scholars with careers shorter than
  years and the initial years (which may include graduate and PhD studies) of scholars with longer careers. This gave us between
  (for 10-year predictions of
  long careers) and
  (for 1-year predictions of all careers) prediction points.
For example, suppose a scientist's first paper was published in  and her last paper was published in
  . For
. For  , we chose prediction years at
  ,
,  , and
, and  . The corresponding future citations periods were then
  ,
,  , and
, and  . Although consecutive samples overlap in citation period, no citation is counted more than once. Because selected papers do not overlap in consecutive samples.
Due to the nested structure of data (within-person time observations), we used multi-level regression models with random effects at the individual level. We implemented the models in “STATA” software using the “xtreg” function with the “mle” option. All variables were added in log scale.
More specifically, we estimated for scholar  the citations to a certain subset of his papers (selected by time-window
  ) in
) in  subsequent years using citation indicators
  as
as
| (1) |
where  is the coefficient of citation indicator
  and
and  is the intercept estimated for scholar
  . Note that intercepts of this model are independently estimated for individual scholars (varying intercept model) and the number of data points for scholars are different. We then compare how well various sets of citation indicators
  can estimate future citations
  by comparing the explained variance
  of the regression models with the same time horizons as defined by
  and
and  .
.
To estimate future citations, we considered the effectiveness of  prominent citation indicators, namely the number of papers, the total number of citations, the career length, the average number of published papers per year, the average annual citations, the annual citations at the time of prediction, the average citations per paper, the h index, the m index, and the g index. The future citations of past and future papers were estimated with multi-level regression models. We compared for various time horizons, the coefficient of determination between models with different predictors (citation indicators).
For various  s and
s and  s , Table 1 compares how well the average citation per paper (
 ), the
  index and the annual received citations
  in the year of prediction
  , and also all the
  indicators can predict future citations.
Table 1. Explained variance of future citations estimated by the average number of citations per paper  (1st column), the
  index (2nd column), the annual citations at the time of prediction
  (3rd column), and all the
  indicators (4th column).
| Time windows | Predictors | |||
 / /
|
 index index |

|
All 10 indicators | |
past, 
|

|

|

|

|
past, 
|

|

|

|

|
 , , 
|

|

|

|

|
 , , 
|

|

|

|

|
 , , 
|

|

|

|

|
 , , 
|

|

|

|

|
First, we consistently found that the annual citations  at the time of prediction
  was the best predictor of future citations among the indicators (Table 1), and that including the remaining
  indicators increased the explained variance only by a small amount. The comparison between
  as a single predictor and all the
  indicators (including
  ) are illustrated in Fig. 4. The model parameter values for various
  s and
s and  s with the single predictor
  are shown in Table 2).
Figure 4. Explained variance of future citations.
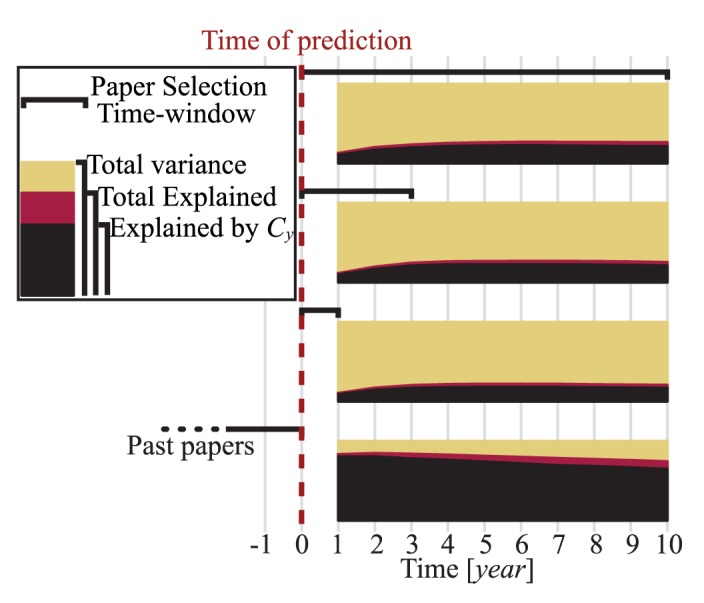
Future citations of published papers (bottom) and of future papers in 
 ,
,  , and
, and  subsequent years (marked with paper selection time-windows in top
  ) for
) for  to
to  years after the time of prediction were estimated. Explained variance by annual citations (
 ) in black; Extra explained variance by including the remaining indicators in red.
Table 2. Future citations of published papers (Model  and
and  ) and future papers (Model
  ,
,  ,
,  and
and  ) at the time of prediction as estimated by the annual citations at the time of prediction.
| Model 1 | Model 2 | Model 3 | Model 4 | Model 5 | Model 6 | |
| Time windows | past, k = 1 | past, k = 10 | w = 1, k = 1 | w = 3, k = 3 | w = 7, k = 7 | w = 10, k = 10 |
| Intercept (SE) |

|

|

|

|

|

|
| b (SE) |

|

|

|

|

|

|
| R-sq |

|

|

|

|

|

|
LR 
|

|

|

|

|

|

|
| # observations |

|

|

|

|

|

|
| # scientists |

|

|

|

|

|

|
Second, for past papers,  explained
  of the variance of future citations in the following year
  slope
slope  , LR
, LR 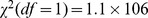 ,
,  . As its prediction power decayed over longer time horizons,
  explained
  of the variance of future citations of past papers for a 10-year prediction (
 , LR
, LR  ,
,  ). When we added the remaining
  indices, the explained variance increased from
  to
to  for the 1-year prediction, and from
  to
to  for the 10-year prediction. For short time horizons (
 ), the future citations of past papers are much better estimated by
  , than the
  index or the average citation per paper (Table 1 for
  and
and  ).
).
Third, the explained variance of future citations to future papers were very small in all the considered models. For the longest prediction horizon ( ,
,  ), where the citations received in
  to papers published in the same period are estimated, not more than
  of variance was explained even when all the
  indicators were included (see last row of Table 1). A similarly weak (
 explained variance) estimation was achieved when
  was the single estimator of our model. Estimating citations for shorter time horizons was generally harder. For the shortest prediction horizon
  ,
,  for example (third row in Table
  ), where the citations to papers published in year
  are estimated in the same year, only
  of variance is explained when all the
  citation indicators were added in the model. Likewise, only
  of variance was explained by
  . The other citation indicators perform even worse if used as single estimator of our regression model.
Discussion
There is disagreement in the literature over the predictive power of the h index and that of the average number of citations per paper [1], [11]. In agreement with Hirsch's study [11], we found that the h index is a better predictor for the future citations of both published papers and future papers (Table 1). None of the studies, however, assessed  , which we found to be the most powerful predictor of future citations. Discipline-wise analysis would require difficult choices in terms of classifying scholars and papers into disciplines. This classification requires extensive technical justifications, and we therefore reserve it for a future paper.
Our results have shown that the existing citation indices do not predict citations of future work well, and hence should not be given significant weight in evaluating academic potential. Including various indicators and testing various prediction time horizons, our results are still in agreement with Hirsch's study “past performance is not predictive of future performance.” [11]. Even combining multiple citation indicators did not significantly improve the prediction: apart from citation indicators, no better predictor of the impact of future work exists.
Acknowledgments
It is a pleasure to acknowledge Thomson Reuters for the use of Web of Science data, and thank Thomas Chadefaux, Michael Mäs, Thomas Grund, Steve Genoud, Karsten Donnay, and George Kampis for helpful comments.
Funding Statement
The author has no support or funding to report.
References
- 1. Lehmann S, Jackson A, Lautrup B (2006) Measures for measures. Nature 444: 1003–1004. [DOI] [PubMed] [Google Scholar]
- 2. Cohen J (2008) Where have all the dollars gone? Science 321: 520–520. [DOI] [PubMed] [Google Scholar]
- 3. Lane J, Bertuzzi S (2011) Measuring the results of science investments. Science 331: 678. [DOI] [PubMed] [Google Scholar]
- 4. Bornmann L, Daniel H (2005) Selection of research fellowship recipients by committee peer review. reliability, fairness and predictive validity of board of trustees' decisions. Scientometrics 63: 297–320. [Google Scholar]
- 5. Petersen A, Wang F, Stanley H (2010) Methods for measuring the citations and productivity of scientists across time and discipline. Physical Review E 81: 036114. [DOI] [PubMed] [Google Scholar]
- 6. Jacob B, Lefgren L (2007) The impact of research grant funding on scientific productivity. Technical report, National Bureau of Economic Research [DOI] [PMC free article] [PubMed] [Google Scholar]
- 7. Boyack K, Börner K (2003) Indicator-assisted evaluation and funding of research: Visualizing the inuence of grants on the number and citation counts of research papers. Journal of the American Society for Information Science and Technology 54: 447–461. [Google Scholar]
- 8. Payne A, Siow A (1999) Does federal research funding increase university research output? Institute of Government and Public Affairs, University of Illinois [Google Scholar]
- 9. Man J, Weinkauf J, Tsang M, Sin J (2004) Why do some countries publish more than others? an international comparison of research funding, english proficiency and publication output in highly ranked general medical journals. European journal of Epidemiology 19: 811–817. [DOI] [PubMed] [Google Scholar]
- 10. Weingart P (2005) Impact of bibliometrics upon the science system: Inadvertent consequences? Scientometrics 62: 117–131. [Google Scholar]
- 11. Hirsch J (2007) Does the h index have predictive power? Proceedings of the National Academy of Sciences 104: 19193. [DOI] [PMC free article] [PubMed] [Google Scholar]
- 12. Hirsch J (2005) An index to quantify an individual's scientific research output. Proceedings of the National Academy of Sciences of the United states of America 102: 16569. [DOI] [PMC free article] [PubMed] [Google Scholar]
- 13. Lehmann S, Jackson A, Lautrup B (2008) A quantitative analysis of indicators of scientific performance. Scientometrics 76: 369–390. [Google Scholar]
- 14. Bornmann L, Daniel H (2009) The state of h index research. is the h index the ideal way to measure research performance? EMBO reports 10: 2. [DOI] [PMC free article] [PubMed] [Google Scholar]
- 15.Egghe L, Rousseau R (1990) Introduction to informetrics: Quantitative methods in library, documentation and information science.
- 16.Garfield E, Merton R (1979) Citation indexing: Its theory and application in science, technology, and humanities, volume 8. Wiley New York.
- 17. Garfield E (2006) Citation indexes for science. a new dimension in documentation through association of ideas. International journal of epidemiology 35: 1123–1127. [DOI] [PubMed] [Google Scholar]
- 18. Radicchi F, Fortunato S, Castellano C (2008) Universality of citation distributions: Toward an objective measure of scientific impact. Proceedings of the National Academy of Sciences 105: 17268. [DOI] [PMC free article] [PubMed] [Google Scholar]
- 19. Boyack K, Klavans R, Börner K (2005) Mapping the backbone of science. Scientometrics 64: 351–374. [Google Scholar]
- 20. Mazloumian A, Eom Y, Helbing D, Lozano S, Fortunato S (2011) How citation boosts promote scientific paradigm shifts and nobel prizes. PloS one 6: e18975. [DOI] [PMC free article] [PubMed] [Google Scholar]
- 21.Moed H (2005) Citation analysis in research evaluation, volume 9. Kluwer Academic Pub.
- 22. Petersen A, Jung W, Yang J, Stanley H (2011) Quantitative and empirical demonstration of the matthew effect in a study of career longevity. Proceedings of the National Academy of Sciences 108: 18–23. [DOI] [PMC free article] [PubMed] [Google Scholar]
- 23. Amsterdamska O, Leydesdorff L (1989) Citations: indicators of significance? Scientometrics 15: 449–471. [Google Scholar]
- 24. Leydesdorff L (1998) Theories of citation? Scientometrics 43: 5–25. [Google Scholar]
- 25. Bornmann L, Daniel H (2008) What do citation counts measure? a review of studies on citing behavior. Journal of Documentation 64: 45–80. [Google Scholar]
- 26. Liu X, Bollen J, Nelson M, Van de Sompel H (2005) Co-authorship networks in the digital library research community. Information processing & management 41: 1462–1480. [Google Scholar]
- 27. Bollen J, Van de Sompel H, Smith J, Luce R (2005) Toward alternative metrics of journal impact: A comparison of download and citation data. Information Processing & Management 41: 1419–1440. [Google Scholar]
- 28. Bornmann L, Daniel H (2007) What do we know about the h index? Journal of the American Society for Information Science and technology 58: 1381–1385. [Google Scholar]
- 29. Petersen A, Stanley H, Succi S (2011) Statistical regularities in the rank-citation profile of scientists. Scientific Reports 1. [DOI] [PMC free article] [PubMed] [Google Scholar]
- 30. Bornmann L, Daniel H (2005) Does the h-index for ranking of scientists really work? Scientometrics 65: 391–392. [Google Scholar]
- 31. Egghe L (2006) An improvement of the h-index: The g-index. ISSI Newsletter 2: 8–9. [Google Scholar]
- 32. Egghe L (2006) Theory and practise of the g-index. Scientometrics 69: 131–152. [Google Scholar]
- 33. Martin B (1996) The use of multiple indicators in the assessment of basic research. Scientometrics 36: 343–362. [Google Scholar]
- 34.Mann G, Yarowsky D (2003) Unsupervised personal name disambiguation. In: Proceedings of the seventh conference on Natural language learning at HLT-NAACL 2003-Volume 4. Association for Computational Linguistics, pp. 33–40.
- 35.Han H, Giles L, Zha H, Li C, Tsioutsiouliklis K (2004) Two supervised learning approaches for name disambiguation in author citations. In: Digital Libraries, 2004. Proceedings of the 2004 Joint ACM/IEEE Conference on. IEEE, pp. 296–305.