

Abstract
Background
VNN1 gene expression levels and the G-137T polymorphism have been associated with high density lipoprotein cholesterol (HDL-C) levels in Mexican American adults. We aim to evaluate the contribution of VNN1 gene expression and the G-137T variant to HDL-C levels and other metabolic traits in Mexican prepubertal children.
Methodology/Principal Findings
VNN1 mRNA expression levels were quantified in peripheral blood leukocytes from 224 unrelated Mexican-Mestizo children aged 6–8 years (107 boys and 117 girls) and were genotyped for the G-137T variant (rs4897612). To account for population stratification, a panel of 10 ancestry informative markers was analyzed. After adjustment for admixture, the TT genotype was significantly associated with lower VNN1 mRNA expression levels (P = 2.9 × 10⁻⁵), decreased HDL-C levels (β = −6.19, P = 0.028) and with higher body mass index (BMI) z-score (β = 0.48, P = 0.024) in the total sample. In addition, VNN1 expression showed a positive correlation with HDL-C levels (r = 0.220; P = 0.017) and a negative correlation with BMI z-score (r = −0.225; P = 0.015) only in girls.
Conclusion/Significance
Our data suggest that VNN1 gene expression and the G-137T variant are associated with HDL-C levels in Mexican children, particularly in prepubertal girls.
Introduction
Low plasma levels of high-density lipoprotein cholesterol (HDL-C) is the most common dyslipidemia in Mexican children and adults [1]–[3], which is modulated by both genetic and lifestyle factors [4], [5]. Several genetic variants affecting HDL-C levels have been identified through candidate gene/genome-wide association studies (GWAS) and replicated in different populations [6]–[8]. However, relatively few genome-wide quantitative gene expression studies identifying expression quantitative trait loci (eQTLs) for HDL-C levels have been reported [9]–[12]. Interestingly, these studies have identified some genes associated with HDL-C levels not previously associated with this trait by GWAS. In this regard, Göring et al. [9] reported that Vanin 1 (VNN1) gene expression levels showed the strongest correlation with HDL-C concentrations in lymphocytes of Mexican-American adults. Moreover, the authors also observed that the functional G-137T polymorphism (rs4897612) was associated with both VNN1 expression levels and HDL-C concentrations in this population, even though the polymorphism had not been previously associated with HDL-C levels in GWAS performed mainly in Caucasians [6]–[8]. Although there is no direct evidence of the role of the VNN1 protein in HDL-C levels regulation, it is known that VNN1 codes for pantetheinase and produces cysteamine, a potent antioxidant that prevents lipid peroxidation [13], [14] and has been associated with other metabolic traits such as obesity in animal models [15]. VNN1 thus can be considered as a reasonable candidate gene to modulate HDL-C levels and perhaps other metabolic traits.
In addition to genetic variation, it is known that environmental factors may modify gene expression [16], [17]. Because environmental exposure is likely to be not as relevant in children than in adults [18], [19], we sought to replicate the VNN1 expression association with the G-137T variant and HDL-C levels in a population sample of Mexican prepubertal children, and to assess whether VNN1 expression is also associated with other metabolic traits.
Materials and Methods
Subjects
We analyzed 224 healthy unrelated school-aged Mexican-Mestizo children (107 boys and 117 girls) aged 6 to 8 years, recruited from a summer camp for children of employees of the Mexican Health Ministry (Convivencia Infantil 2008 and 2009, Secretaría de Salud). Weight, height and waist circumference were measured in all participants. Body mass index (BMI) was calculated as weight in kilograms divided by height in meters squared. BMI z-scores were calculated using age and sex specific BMI reference data, as recommended by the Centers for Disease Control and Prevention [20]. Fat mass percentage was measured using a bioelectric impedance method (Quantum × impedance analyzer, RJL Systems, Detroit, MI). None of the participants had evidence of diabetes, thyroid, renal or liver disease. A parent of each child signed the consent form for participation. The project was approved by the Institutional Committee of Biomedical Research in Humans of the Instituto Nacional de Ciencias Médicas y Nutrición Salvador Zubirán (INCMNSZ).
Biochemical Parameters
Blood samples were drawn from all participants after a 12-hour fast. Total cholesterol (TC), triglyceride (TG), HDL-C and ApoA1 plasma levels were measured at the INCMNSZ with commercially available standardized methods as described by Villarreal-Molina et al. [21]. Hypoalphalipoproteinemia (HA) was defined as HDL-C levels<40 mg/dL [22].
VNN1 mRNA Expression Analysis
Total RNA was extracted from leukocytes using TRIzol (Invitrogen, Life Technologies, Carlsbad, CA, USA). To avoid DNA carryover, DNAse treatment was performed with DNAse I recombinant (Roche, Rotkreuz, Switzerland). To perform the expression analysis, 1000 ng of total RNA was reverse transcribed with TaqMan Reverse Transcription Reagents (Applied Biosystems, Foster City, CA) using random hexamers, according to the protocol recommended by the manufacturer. Real-time PCR was performed in a LightCycler 2.0 (Roche, Rotkreuz, Switzerland), using LNA TaqMan probes from the Universal Probe Library (Roche, Rotkreuz, Switzerland), in combination with intron-spanning specific primers as described previously [23]. The following primers and probes were used to assess VNN1 gene expression in human leucocytes: tcctgaggtgttgctgagtg (forward), agcgtccgtcagttgacac (reverse), and probe #80 (cat. no. 04689038001). Hipoxanthine phosphoribosyl transferase (HPRT) expression was measured as reference using HPRT primers tgatagatccattcctatgactgtaga (forward), caagacattctttccagttaaagttg (reverse), and probe #22 (cat. no. 04688961001); β-actin (ACTB) was measured as reference using Universal ProbeLibrary Human ACTB Gene Assay (cat. no. 05046165001). All assays showed linearity and a coefficient of variation<10%. Relative quantification of gene expression was calculated with the LightCycler Software 4.0.
Single Nucleotide Polymorphisms Genotyping
Genomic DNA was extracted from peripheral blood leukocytes using a QIAamp DNA Blood Kit (Qiagen, Valencia, California). The VNN1 G-137T variant was genotyped using the TaqMan assay C_29857881_10 (ABI Prism 7900HT Sequence Detection System; Applied Biosystems, Foster City, CA). No discordant genotypes were observed in 30 duplicate samples analyzed by direct sequencing. VNN1 G-137T genotype frequencies were tested for Hardy-Weinberg equilibrium, deviation was not observed in any group.
Because the Mexican population resulted from the admixture of mainly European (Spaniard) and Native American populations, it was necessary to assess whether any association could be confounded by population stratification. A panel of 10 ancestry informative markers (AIMs) distinguishing mainly Native American and European ancestry (δ for the minor allele>0.29), was screened in all participants (rs3340, rs1881826, rs2341823, rs4130405, rs1980888, rs1487214, rs726391, rs724729, rs292932 and rs1877751) [24], [25]. Genotyping was performed using TaqMan assays (ABI Prism 7900HT Sequence Detection System; Applied Biosystems, Foster City, CA). Genotyping call rates of each ancestry informative marker exceeded 95%, and no discordant genotypes were observed in 48 duplicate samples. No ancestry informative marker showed significant departure from Hardy-Weinberg equilibrium.
Statistical Analysis
Because gene expression, HDL-C levels and the effect of some polymorphisms on metabolic traits are known to have gender differences [26]–[29], all analyses were performed on the entire sample and stratified by gender. Differences in anthropometric and biochemical parameters were analyzed using Student’s t-test. Because VNN1 gene expression and triglyceride levels were not normally distributed, they were log transformed for analysis. Correlations between VNN1 gene expression and metabolic parameters were analyzed using Pearson’s correlation and partial correlation was used to examine the correlations between gene expression and metabolic phenotypes adjusting for admixture. Differences in anthropometric and biochemical parameters according to G-137T genotype were tested by linear regression analysis. Associations were analyzed using additive (Table S1), dominant (Table S2) and recessive models for the T allele, being the recessive model the most significant. Comparison of VNN1 expression levels between G-137T genotypes was performed using Mann-Whitney U test. All statistical analyses were performed using SPSS version 15.0 (Chicago, IL) and a P-value of less than 0.05 was considered statistically significant. Genetic ancestry estimates were computed from genotypes for 10 AIMs using the program ADMIXMAP [30]. Because the Mexican-Mestizo population derived mainly from Native American and European populations, the model used included two primary parental populations. All analyses were adjusted for admixture and for BMI-z score when appropriate. To address multiple testing, we first determined the average pairwise correlation for all measurements (6 measurements, correlation = 0.38); with this correlation we calculated Bonferroni’s correction using the freely available Simple Interactive Statistical Analyses Software (http://www.quantitativeskills.com/sisa/) and a P-value below 0.017 was considered significant. The study power to detect association of G-137T with HDL-C levels was estimated using QUANTO software (v1.2.4, http://hydra.usc.edu/GxE/) and reached 82.8%, assuming a recessive model with a minor allele (T) frequency of 0.35, beta for HDL-C levels of −6.19 (SE = 2.20) and sample size of 224 individuals. Statistical power stratified by gender was 53.5% for boys and 54.1% for girls.
Results
Anthropometric and Biochemical Characteristics
Table 1 describes the anthropometric characteristics and lipid profile of the children stratified by gender. Fat mass percentage was significantly higher in girls (P = 0.041), but no significant gender differences in BMI-z score or lipid parameters were observed.
Table 1. Anthropometric and biochemical parameters according to gender.
| Characteristic | Total subjects (224) | Boys (107) | Girls (117) | P a |
| Age, years | 7.73±0.97 | 7.84±0.97 | 7.63±0.96 | 0.194 |
| BMI z-score | 0.99±0.98 | 1.0±1.0 | 0.98±0.97 | 0.846 |
| FM, % | 30.03±10.52 | 28.37±11.60 | 31.52±9.25 | 0.041 |
| TG, mg/dL | 98.03±59.09 | 90.95±50.38 | 104.50±65.62 | 0.087 |
| TC, mg/dL | 175.83±31.39 | 173.36±29.90 | 178.09±32.66 | 0.261 |
| HDL-C, mg/dL | 48.58±10.56 | 49.15±10.36 | 48.06±10.75 | 0.442 |
| ApoA1, mg/dL | 168.52±21.74 | 171.08±20.57 | 166.40±22.53 | 0.120 |
| HA (%) | 19.6 | 16.8 | 22.2 | 0.310b |
Data are means ± s.d. or n (%). BMI, body mass index; FM, percent fat mass; TG, triglyceride; TC, total cholesterol; HDL-C, high-density lipoprotein cholesterol; HA, hypoalphalipoproteinemia.
P-values were calculated by t-test;
X2 test.
VNN1 Expression Analysis
VNN1 expression levels were not significantly correlated with HDL-C levels in the entire study population, but showed a significant negative correlation with BMI z-score and TG levels (P = 0.032 and 0.026, respectively) (Table 2). On stratification according to gender, a significant positive correlation of VNN1 expression levels with HDL-C (P = 0.017), and significant negative correlations with BMI z-score and TG levels were observed exclusively in girls (P = 0.015 and P = 0.025). All associations remained significant by further adjustment for admixture, but only the association with BMI-z score was significant after correction for multiple testing.
Table 2. Correlation of VNN1 mRNA levels in leukocytes with metabolic phenotypes.
| Whole Population (n = 224) | Boys (n = 107) | Girls (n = 117) | |||||||
| Metabolic phenotypes | r | P | P a | r | P | P a | r | P | P a |
| BMI z-score | −0.144 | 0.032 | 0.034 | −0.062 | 0.528 | 0.518 | −0.225 | 0.015 | 0.015* |
| FM, % | −0.118 | 0.080 | 0.085 | −0.068 | 0.490 | 0.525 | −0.145 | 0.118 | 0.119 |
| TG, mg/dL | −0.149 | 0.026 | 0.028 | −0.062 | 0.525 | 0.576 | −0.208 | 0.025 | 0.023 |
| TC, mg/dL | −0.056 | 0.402 | 0.396 | −0.047 | 0.631 | 0.643 | −0.051 | 0.586 | 0.586 |
| HDL-C, mg/dL | 0.086 | 0.198 | 0.211 | −0.071 | 0.465 | 0.448 | 0.220 | 0.017 | 0.017 |
| ApoA1, mg/dL | 0.042 | 0.546 | 0.566 | −0.106 | 0.308 | 0.308 | 0.129 | 0.170 | 0.175 |
BMI, body mass index; FM, percent fat mass; TG, triglyceride; TC, total cholesterol; HDL-C, high-density lipoprotein cholesterol.
P-values adjusted for admixture.
Significant after Bonferroni correction.
G137T Variant, VNN1 Expression Levels and Metabolic Parameters
The overall frequency of the T-137 allele was 35%. The TT genotype was significantly associated with lower VNN1 expression levels (P = 2.9 × 10⁻⁵ after adjusting for admixture) (Figure 1). Multiple linear regression analyses to predict VNN1 expression levels revealed that only TT genotype contributed independently to explain 4.8% of the variance at VNN1 gene expression (P = 0.004). In addition, the TT genotype was associated with lower HDL-C and ApoA1 levels (P = 0.005 and 0.044, respectively), and with higher BMI z-score, percent fat mass, TG and TC levels in the whole sample (P<0.05, Table 3). After adjusting for BMI z-score and admixture, only associations with TC and HDL-C remained significant in the whole sample (P = 0.034 and 0.028, respectively). On stratification according to gender, a significant association of TT genotype with lower HDL-C levels was observed exclusively in girls (P = 0.010).
Figure 1. Effect of G-137T variant on VNN1 expression levels in Mexican prepubertal children.
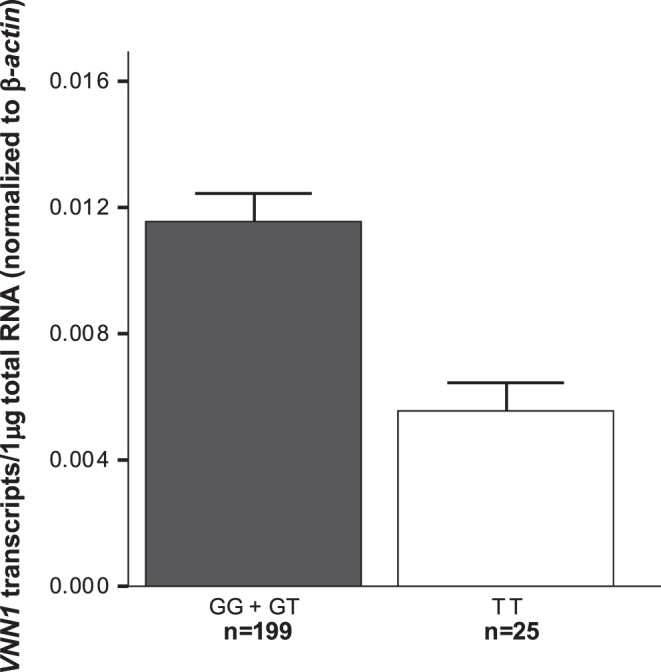
The results are presented as the global mean ± the standard error.
Table 3. Association of G-137T variant with metabolic parameters stratified by gender.
| All children (n = 224) | Boys (n = 107) | Girls (n = 117) | |||||||
| Parameters | Effect (SE) | P | P a | Effect (SE) | P | P a | Effect (SE) | P | P a |
| BMI z-score | 0.48 (0.21) | 0.024 | 0.024 | 0.69 (0.36) | 0.061 | 0.063 | 0.38 (0.26) | 0.146 | 0.156 |
| FM, % | 5.66 (2.25) | 0.012 | 0.012* | 6.45 (4.24) | 0.131 | 0.123 | 4.56 (2.46) | 0.067 | 0.072 |
| TG, mg/dL | 25.76 (12.45) | 0.040 | 0.194 | −1.65 (17.63) | 0.926 | 0.371 | 39.53 (17.34) | 0.024 | 0.079 |
| TC, mg/dL | 16.35 (6.58) | 0.014 | 0.034 | 10.64 (10.41) | 0.309 | 0.423 | 18.93 (8.64) | 0.031 | 0.057 |
| HDL-C, mg/dL | −6.19 (2.20) | 0.005 | 0.028 | −2.10 (3.62) | 0.562 | 0.994 | −8.47 (2.80) | 0.003 | 0.010* |
| ApoA1 mg/dL | −9.66 (4.77) | 0.044 | 0.093 | −5.95 (8.72) | 0.497 | 0.969 | −12.44 (5.98) | 0.040 | 0.093 |
Effect values are presented as effect for two T copies (recessive model), standard error (SE). Genotype frequencies: all children (GG, 41.1%; GT, 47.7%; TT, 11.2%); boys (GG, 42.1%; GT, 49.5%; TT, 8.4%); girls (GG, 40.2%; GT, 46.1%; TT, 13.7%). BMI, body mass index; FM, percent fat mass; TG, triglyceride; TC, total cholesterol; HDL-C, high-density lipoprotein cholesterol.
P-values adjusted for admixture in all tests and for BMI z-score when appropriate.
Significant after Bonferroni correction.
Discussion
Several epidemiological studies report that the onset of metabolic disease is occurring at increasingly earlier ages [31], [32]. In the Mexican population, low HDL-C levels is the most common dyslipidemia in both adults and adolescents [1]–[3], and was also found to be common in prepubertal children aged 6–8 years (20%), showing that low HDL-C levels are present since childhood in this population.
Several studies have shown that variation in gene expression is probably an important mechanism influencing HDL-C levels [9]–[11], [33]. Göring et al. observed that VNN1 expression levels showed the strongest correlation with HDL-C concentrations in lymphocytes of Mexican-American adults, (r = 0.28, P = 4 × 10⁻⁹). Similarly, we observed a positive correlation of VNN1 expression levels in leukocytes with HDL-C levels in Mexican prepubertal children, which was significant only in girls (r = 0.22, P = 0.017). We also observed a negative correlation of VNN1 expression levels with triglyceride levels and BMI z-score in the whole sample, again with gender-specific differences. Although the mechanism by which VNN1 function may affect these metabolic traits is largely unknown, there is experimental evidence that Vanin 1 is a central regulator of lipid biosynthesis by controlling the flux through the fatty acid and/or cholesterol biosynthetic pathways [34]. Because to our knowledge this is the only study analyzing the effects of VNN1 expression levels on metabolic traits in children, further studies are required to confirm this finding and to further characterize the gender differences observed.
The VNN1 T-137 allele frequency in the Mexican children population (35%) was similar to the 33% frequency reported in Mexican-American population and lower than in European populations (67%) [35]. Several studies have reported an effect of genetic ancestry on both global gene expression and associations of gene variants with disease [36], [37]. Because the Mexican population is the result of admixture, mainly of Spanish and Native American populations [25], [38], we included ancestry as a confounding factor to test for associations. Although the panel of AIMs analyzed is small (10 AIMs), the mean admixture proportions of the population were estimated as 65% Native American and 35% European, in agreement with previous studies in the population of Mexico City using 69 AIMs [25]. All associations reported in the present study remained significant after adjusting for admixture, suggesting that population stratification was not an important confounding factor in our analysis.
The TT genotype was significantly associated with lower VNN1 expression and HDL-C levels, in accordance with the findings of Göring et al. in Mexican-American adults. Although experimental evidence strongly supports that this promoter polymorphism has functional consequences with respect to binding transcription factors [9], this genotype contributed independently to explain only 4.8% of the variance at VNN1 gene expression. While this is consistent with the previously reported range of the effect of SNPs on gene expression variability [11], the genetic and environmental factors explaining most of VNN1 gene expression variability remain to be determined.
Interestingly, associations of the TT genotype with higher TG and TC levels were observed in girls. However, these associations lost significance after adjusting for BMI z-score, suggesting they may be mediated by an effect on body fat. To our knowledge, there is no previous experimental evidence of the role of VNN1 in human adipocyte function, however it was identified as an obesity-related gene in mice [15] and is known to induce lipolysis in rat adipose tissue [39]. Because VNN1 gene variants have not been previously found to be associated with obesity in GWAS [40], [41] and because the sample number analyzed here is reduced, these associations should be interpreted with caution. Additional studies are required to confirm and further understand the role of VNN1 in human obesity.
The gender differences observed are noteworthy, particularly because it involved prepubertal children. Mexican prepubertal girls showed significantly higher fat mass percentage than boys, which could explain at least part of the gender differences observed for genetic associations and correlations. Gender differences in the effect of polymorphisms on lipid traits have been previously observed in prepubertal children [28], apparently explained by dehydroepiandrostenone-sulfate (DHEA-S) level variation [42]. Because we did not measure DHEA-S levels, we cannot rule out whether this factor modulates the effect of VNN1 gene expression levels and the G-137T variant on metabolic traits in this study.
In conclusion, our data suggest that VNN1 gene expression levels and the G-137T variant are associated with lipid traits (particularly HDL-C levels) in Mexican prepubertal girls. However, these results should be interpreted with caution and further studies with larger samples sizes are required to confirm these findings.
Supporting Information
Association of G-137T variant with metabolic parameters stratified by gender (additive model).
(DOC)
Association of G-137T variant with metabolic parameters stratified by gender (dominant model).
(DOC)
Acknowledgments
We thank Salvador Ramírez-Jiménez and Luz E. Guillén-Pineda for their technical assistance.
Funding Statement
This research was supported by grant 85010 from the Consejo Nacional de Ciencia y Tecnología (CONACyT, http://www.conacyt.mx/Paginas/default.aspx) and was partially supported by PAIP 4194-16. LJA is in the PhD Program from Ciencias Biomédicas at Universidad Nacional Autónoma de México (UNAM). LJA, HVR and PLM are recipients of the CONACyT scholarship number 195399, 244112 and 234714, respectively. The funders had no role in study design, data collection and analysis, decision to publish, or preparation of the manuscript.
References
- 1. Aguilar-Salinas CA, Olaiz G, Valles V, Torres JM, Gómez Pérez FJ, et al. (2001) High prevalence of low HDL cholesterol concentrations and mixed hyperlipidemia in a Mexican nationwide survey. J Lipid Res 42: 1298–307. [PubMed] [Google Scholar]
- 2. Posadas-Sánchez R, Posadas-Romero C, Zamora-González J, Mendoza-Pérez E, Cardoso-Saldaña G, et al. (2007) Lipid and lipoprotein profiles and prevalence of dyslipidemia in Mexican adolescents. Metabolism 56: 1666–72. [DOI] [PubMed] [Google Scholar]
- 3. Flores-Dorantes T, Arellano-Campos O, Posadas-Sánchez R, Villarreal-Molina T, Medina-Urrutia A, et al. (2010) Association of R230C ABCA1 gene variant with low HDL-C levels and abnormal HDL subclass distribution in Mexican school-aged children. Clin Chim Acta 411: 1214–7. [DOI] [PubMed] [Google Scholar]
- 4. Qasim A, Rader DJ (2006) Human genetics of variation in high-density lipoprotein cholesterol. Curr Atheroscler Rep 8: 198–205. [DOI] [PubMed] [Google Scholar]
- 5. Lusis AJ, Fogelman AM, Fonarow GC (2004) Genetic basis of atherosclerosis: part II: clinical implications. Circulation 110: 2066–71. [DOI] [PubMed] [Google Scholar]
- 6. Willer CJ, Sanna S, Jackson AU, Scuteri A, Bonnycastle LL, et al. (2008) Newly identified loci that influence lipid concentrations and risk of coronary artery disease. Nat Genet 40: 161–69. [DOI] [PMC free article] [PubMed] [Google Scholar]
- 7. Kooner JS, Chambers JC, Aguilar-Salinas CA, Hinds DA, Hyde CL, et al. (2008) Genome-wide scan identifies variation in MLXIPL associated with plasma triglycerides. Nat Genet 40: 149–51. [DOI] [PubMed] [Google Scholar]
- 8. Kathiresan S, Melander O, Guiducci C, Surti A, Burtt NP, et al. (2008) Six new loci associated with blood low-density lipoprotein cholesterol, high-density lipoprotein cholesterol or triglycerides in humans. Nat Genet 40: 189–97. [DOI] [PMC free article] [PubMed] [Google Scholar]
- 9. Göring HH, Curran JE, Johnson MP, Dyer TD, Charlesworth J, et al. (2007) Discovery of expression QTLs using large-scale transcriptional profiling in human lymphocytes. Nat Genet 39: 1208–16. [DOI] [PubMed] [Google Scholar]
- 10. Ma J, Dempsey AA, Stamatiou D, Marshall KW, Liew CC (2007) Identifying leukocyte gene expression patterns associated with plasma lipid levels in human subjects. Atherosclerosis 191: 63–72. [DOI] [PubMed] [Google Scholar]
- 11. Zeller T, Wild P, Szymczak S, Rotival M, Schillert A, et al. (2010) Genetics and beyond–the transcriptome of human monocytes and disease susceptibility. PLoS One 5: e10693. [DOI] [PMC free article] [PubMed] [Google Scholar]
- 12. Inouye M, Silander K, Hamalainen E, Salomaa V, Harald K, et al. (2010) An immune response network associated with blood lipid levels. PLoS Genet 6: e1001113. [DOI] [PMC free article] [PubMed] [Google Scholar]
- 13. Yamazaki K, Kuromitsu J, Tanaka I (2002) Microarray analysis of gene expression changes in mouse liver induced by peroxisome proliferator- activated receptor alpha agonists. Biochem Biophys Res Commun 290: 1114–22. [DOI] [PubMed] [Google Scholar]
- 14. Di Leandro L, Maras B, Schininà ME, Dupré S, Koutris I, et al. (2008) Cystamine restores GSTA3 levels in vanin-1 null mice. Free Radic Biol Med 44: 1088–96. [DOI] [PubMed] [Google Scholar]
- 15. Schadt EE, Lamb J, Yang X, Zhu J, Edwards S, et al. (2005) An integrative genomics approach to infer causal associations between gene expression and disease. Nature Genet 37: 710–7. [DOI] [PMC free article] [PubMed] [Google Scholar]
- 16. Crujeiras AB, Parra D, Milagro FI, Goyenechea E, Larrarte E, et al. (2008) Differential expression of oxidative stress and inflammation related genes in peripheral blood mononuclear cells in response to a low-calorie diet: a nutrigenomics study. OMICS 12: 251–61. [DOI] [PubMed] [Google Scholar]
- 17. Idaghdour Y, Storey JD, Jadallah SJ, Gibson G (2008) A genome-wide gene expression signature of environmental geography in leukocytes of Moroccan Amazighs. PLoS Genet 4: e1000052. [DOI] [PMC free article] [PubMed] [Google Scholar]
- 18. Brown WM, Beck SR, Lange EM, Davis CC, Kay CM, et al. (2003) Framingham Heart Study.Age-stratified heritability estimation in the Framingham Heart Study families. BMC Genet 4 Suppl 1 S32. [DOI] [PMC free article] [PubMed] [Google Scholar]
- 19. Dumitrescu L, Brown-Gentry K, Goodloe R, Glenn K, Yang W, et al. (2011) Evidence for age as a modifier of genetic associations for lipid levels. Ann Hum Genet 75: 589–97. [DOI] [PMC free article] [PubMed] [Google Scholar]
- 20. Kuczmarski RJ, Ogden CL, Guo SS, Grummer-Strawn LM, Flegal KM, et al. (2002) 2000 CDC growth charts for the United States: methods and development. Vital Health Stat 246: 1–190. [PubMed] [Google Scholar]
- 21. Villarreal-Molina MT, Aguilar-Salinas CA, Rodríguez-Cruz M, Riaño D, Villalobos-Comparan M, et al. (2007) The ATP-binding cassette transporter A1 R230C variant affects HDL cholesterol levels and BMI in the Mexican population: association with obesity and obesity-related comorbidities. Diabetes 56: 1881–7. [DOI] [PubMed] [Google Scholar]
- 22. Expert Panel on Integrated Guidelines for Cardiovascular Health and Risk Reduction in Children and Adolescents (2011) Expert panel on integrated guidelines for cardiovascular health and risk reduction in children and adolescents: summary report. Pediatrics 128 Suppl 5 S213–56. [DOI] [PMC free article] [PubMed] [Google Scholar]
- 23. Mouritzen P, Noerholm M, Nielsen PS, Jacobsen N, Lomholt C, et al. (2005) ProbeLibrary: a new method for faster design and execution of quantitative real-time PCR. Nat Methods 2: 313–316. [Google Scholar]
- 24. Bonilla C, Parra EJ, Pfaff CL, Dios S, Marshall JA, et al. (2004) Admixture in the Hispanics of the San Luis Valley, Colorado, and its implications for complex trait gene mapping. Ann Hum Genet 68: 139–53. [DOI] [PubMed] [Google Scholar]
- 25. Martinez-Marignac VL, Valladares A, Cameron E, Chan A, Perera A, et al. (2007) Admixture in Mexico City: implications for admixture mapping of type 2 diabetes genetic risk factors. Hum Genet 120: 807–19. [DOI] [PubMed] [Google Scholar]
- 26. Ellegren H, Parsch J (2007) The evolution of sex-biased genes and sex-biased gene expression. Nat Rev Genet 8: 689–98. [DOI] [PubMed] [Google Scholar]
- 27. Feitosa MF, Myers RH, Pankow JS, Province MA, Borecki IB (2009) LIPC variants in the promoter and intron 1 modify HDL-C levels in a sex-specific fashion. Atherosclerosis 204: 171–7. [DOI] [PMC free article] [PubMed] [Google Scholar]
- 28. López-Simón L, de Oya M, Lasunción MA, Riestra P, Benavente M, et al. (2009) Genetic determinants of plasma HDL-cholesterol levels in prepubertal children. Clin Chim Acta 403: 203–6. [DOI] [PubMed] [Google Scholar]
- 29. Weiss LA, Pan L, Abney M, Ober C (2006) The sex-specific genetic architecture of quantitative traits in humans. Nat Genet 38: 218–22. [DOI] [PubMed] [Google Scholar]
- 30. Hoggart CJ, Parra EJ, Shriver MD, Kittles RA, Clayton DG, et al. (2003) Control of confounding of genetic associations in stratified populations. Am J Hum Genet 72: 1492–504. [DOI] [PMC free article] [PubMed] [Google Scholar]
- 31. Saland JM (2007) Update on the metabolic syndrome in children. Curr Opin Pediatr 19: 183–91. [DOI] [PubMed] [Google Scholar]
- 32. Nathan BM, Moran A (2008) Metabolic complications of obesity in childhood and adolescence: more than just diabetes. Curr Opin Endocrinol Diabetes Obes 15: 21–9. [DOI] [PubMed] [Google Scholar]
- 33. Cookson W, Liang L, Abecasis G, Moffatt M, Lathrop M (2009) Mapping complex disease traits with global gene expression. Nat Rev Genet 10: 184–94. [DOI] [PMC free article] [PubMed] [Google Scholar]
- 34. Kaskow BJ, Proffitt JM, Blangero J, Moses EK, Abraham LJ (2012) Diverse biological activities of the vascular non-inflammatory molecules - the Vanin pantetheinases. Biochem Biophys Res Commun 417: 653–8. [DOI] [PMC free article] [PubMed] [Google Scholar]
- 35. International HapMap Consortium.The International HapMap Project (2003) Nature. 426: 789–96. [DOI] [PubMed] [Google Scholar]
- 36. Storey JD, Madeoy J, Strout JL, Wurfel M, Ronald J, et al. (2007) Gene-expression variation within and among human populations. Am J Hum Genet 80: 502–9. [DOI] [PMC free article] [PubMed] [Google Scholar]
- 37. Yang HC, Wang PL, Lin CW, Chen CH, Chen CH (2012) Integrative analysis of single nucleotide polymorphisms and gene expression efficiently distinguishes samples from closely related ethnic populations. BMC Genomics 13: 346. [DOI] [PMC free article] [PubMed] [Google Scholar]
- 38. Lisker R, Ramirez E, Briceno RP, Granados J, Babinsky V (1990) Gene frequencies and admixture estimates in four Mexican urban centers. Hum Biol 62: 791–801. [PubMed] [Google Scholar]
- 39. Bocos C, Herrera E (1998) Pantethine stimulates lipolysis in adipose tissue and inhibits cholesterol and fatty acid synthesis in liver and intestinal mucosa in the normolipidemic rat. Environ Toxicol Pharmacol 6: 59–66. [DOI] [PubMed] [Google Scholar]
- 40. Thorleifsson G, Walters GB, Gudbjartsson DF, Steinthorsdottir V, Sulem P, et al. (2009) Genome-wide association yields new sequence variants at seven loci that associate with measures of obesity. Nat Genet 41: 18–24. [DOI] [PubMed] [Google Scholar]
- 41. Speliotes EK, Willer CJ, Berndt SI, Monda KL, Thorleifsson G, et al. (2010) Association analyses of 249,796 individuals reveal 18 new loci associated with body mass index. Nat Genet 42: 937–48. [DOI] [PMC free article] [PubMed] [Google Scholar]
- 42. Garcés C, Benavente M, Cano B, Viturro E, Ortega H, et al. (2003) Effects of dehydroepiandrosterone-sulfate on the ApoE genotype influence on plasma lipid levels in prepubertal children. J Clin Endocrinol Metab 88: 3997–4000. [DOI] [PubMed] [Google Scholar]
Associated Data
This section collects any data citations, data availability statements, or supplementary materials included in this article.
Supplementary Materials
Association of G-137T variant with metabolic parameters stratified by gender (additive model).
(DOC)
Association of G-137T variant with metabolic parameters stratified by gender (dominant model).
(DOC)