

Abstract
Background
Myocardial strain imaging using echocardiography can be a cost-effective method to objectively quantify ventricular wall motion but few studies have compared strain measured with echocardiography against MRI in small animals.
Methods and Results
We compared circumferential (CS) and radial strain (RS) measured with echocardiography (vector velocity imaging [VVI]) to displacement encoding with stimulated-echo (DENSE) MRI in two mouse models of cardiomyopathy. In 3 month old mice with gene targeted deficiency of cardiac myosin binding protein-C (cMyBP-C−/−, n=6) or muscle LIM protein (MLP−/−, n=6), and wild-type (WT) mice (n=8), myocardial strains were measured at three cross-sectional levels and averaged to obtain global strains. There was modest correlation between VVI and MRI measured strains, with global CS yielding stronger correlation compared to global RS (CS R2 = 0.4452 vs. RS R2 = 0.2794, both p<0.05). Overall, strain measured by VVI was more variable than MRI (p<0.05) and the limits of agreement were slightly, but not significantly (p=0.14) closer for global CS than RS. Both VVI and MRI strain measurements showed significantly lower global CS strain in the knockout groups compared to the wild-type. The VVI (but not MRI) CS strain measurements were different between the two knockout groups (−14.5 ± 3.8% vs. −6.6 ± 4.0%, cMyBP-C−/− vs. MLP−/− respectively, p<0.05).
Conclusions
Measurements of LV circumferential and radial strains are feasible in small animals using 2D echocardiography. VVI and MRI strain measurements correlated modestly and the agreement between the modalities tended to be greater for circumferential than radial strain. Although VVI and MRI strains were able to differentiate between wild-type and knockout mice, only global circumferential VVI strain differentiated between the two models of cardiomyopathy.
Keywords: strain, speckle-tracking echocardiography, magnetic resonance imaging
Two-dimensionally directed echocardiography has arguably become the leading method for assessing left ventricular function in small animals because it is noninvasive, relatively cost effective, widely available, and has short acquisition and post-processing times that allow high throughput. These techniques have proved useful in determining both the interplay between altered cardiovascular gene expression and compensatory physiologic regulation as well as the effects of genetic, surgical, and pharmacological interventions in rodent models of disease.1–3
However, 2D-directed detection of LV dysfunction by conventional echocardiography (M-mode, 2D, Doppler) is considered a late manifestation of cardiac disease that lacks the sensitivity to identify subclinical disease.4–7 Doppler- and 2D echocardiographic-derived myocardial strain (or deformational) imaging are recent advances in non-invasive cardiac imaging intended in part to overcome the limitations that confound the traditional echocardiographic assessment of LV function. Abnormalities of myocardial deformation are seen early in the development of a variety of pathophysiologic states, and thus provide a sensitive means for detecting global and regional myocardial dysfunction.8 Compared to Doppler-determined strain, 2D echocardiographic (2D speckle-tracking or 2D STE) strain is independent of the angle of ultrasound propagation, measures the three normal Lagrangian strains (radial, circumferential, and longitudinal), and is less noisy and more reproducible. 2D STE has been previously described in humans for use in myocardial layer-specific deformation analysis 9 and more recently has been used for phenotyping mice.6 This imaging technique tracks speckle patterns generated by interference between the ultrasound beam and myocardium on 2D echocardiographic images.10 It allows a non-Doppler based assessment of regional myocardial motion and provides information about segmental as well as global LV function with greater sensitivity and specificity compared to conventional echocardiography.6,11,12 Velocity Vector Imaging (VVI; Siemens Medical Solutions, Mountain View, CA) is a novel imaging technique based on 2D STE which incorporates speckle-tracking and endocardial contour tracking that allows angle-independent measurements of strain.8,13
With its high spatial resolution and superb imaging quality, MRI based strain imaging is considered the “gold standard” method for measuring myocardial wall strain.10,14 However, it is costly, time-consuming and not widely available, precluding it from routine use in the small animal research arena; While other studies have compared 2D STE strain measurements with MRI 15, there are no studies to date that have directly compared VVI strain measurements with MRI based strain in small animal models of cardiovascular disease. In this study, we report LV strain measurements in normal mice and in mouse models of hypertrophic and dilated cardiomyopathy using VVI and stimulated-echo (DENSE) MRI, thus providing a direct comparison of the strain measurements in pathological states.
Methods
Experimental Animals
Adult male (8–10 weeks of age) mice with deficiency of either myosin binding protein-C, a thick filament-associated protein of the sarcomere (cMyBP-C−/−; n=6), or muscle LIM protein, a promoter of myogenic cytoskeleton differentiation (MLP−/−; n=6), and their wild type littermates of the SV/129 strain (WT; n=8) were used in this study. These groups served as models of hypertrophic and dilated cardiomyopathy, and controls, respectively.16,17
Mice were placed on a standard mouse chow diet and water ad libitum, and housed in a temperature-controlled environment with an alternating 12-hour light/dark cycle. All procedures involving animal care and handling were performed according to institutional guidelines set forth by the Animal Care and Use Committee at Case Western Reserve University.
MRI
Animals were anesthetized with 2% isoflurane with supplemented O2 in an isoflurane induction chamber and then moved into the magnet and kept under inhalation anesthesia with 1.5% isoflurane. With electrocardiogram and respiratory gating, cardiac functional MRI studies were performed with a 9.4-T Bruker Biospec (Billerica, MA) horizontal scanner using a volume coil. A series of scout images were first acquired to obtain the horizontal long-axis image from which three LV short-axis planes at basal, mid-ventricular, and apical levels were prescribed as perpendicular to the LV long axis with an interslice distance of 1.5 mm. Two-dimensional (2D) myocardial motion was quantified using displacement encoding with stimulated-echo (DENSE) MRI, the details of which has been described previously.18 Data were captured at a rate of 13 frames/cardiac cycle, resulting in a temporal resolution of ~ 9 ms. Image processing (MR image reconstruction) and data analysis were performed offline using custom-built software written in Matlab (MathWorks, Natick, MA). Data acquisition and analysis required ~ 3–3.5 hours and one per animal.
The epicardial and endocardial LV borders were traced using cine images to calculate LV ejection fraction. A 2-D displacement map was calculated by means of vector addition of the displacement from two orthogonal directions to compute Lagrangian strain tensors at the base, mid, and apex of the LV. The circumferential and radial strain measurements at the base, mid, and apex of the LV were averaged to obtain global circumferential and radial strain for each animal (Figure 1A).
Figure 1.
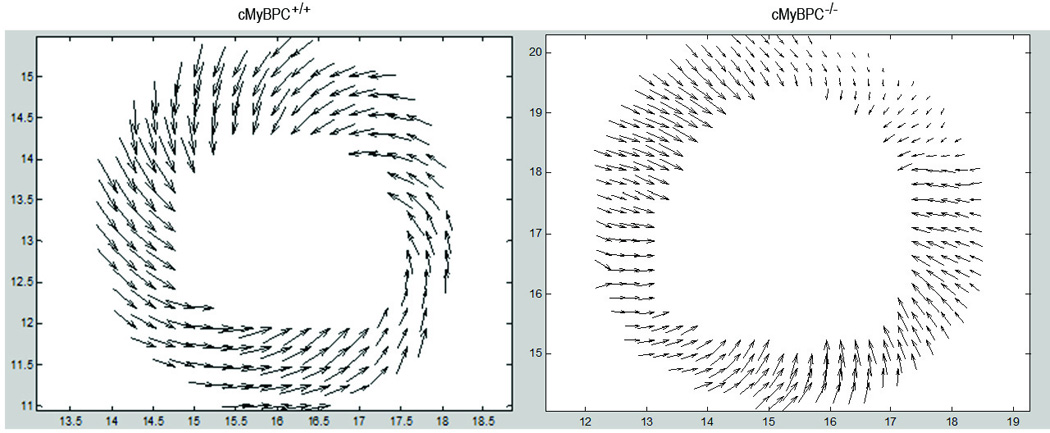
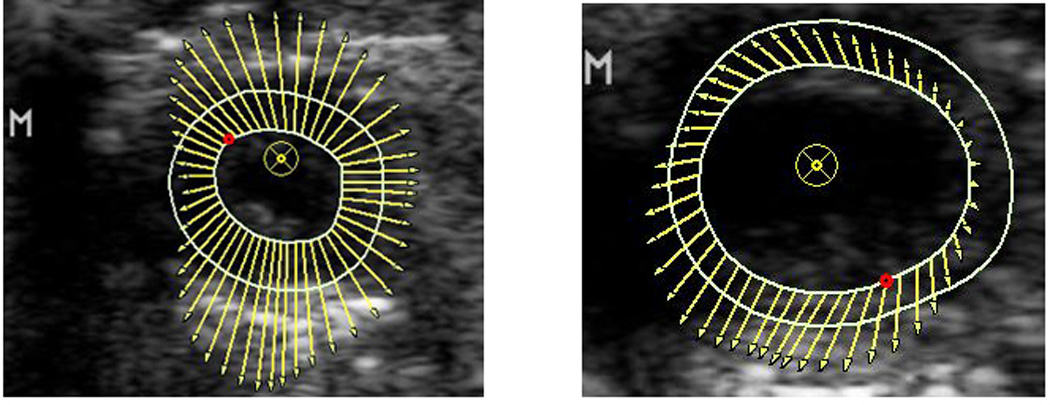
DENSE MRI (1A) and VVI echocardiographic (1B) vector maps for regional strain in wild type (left) vs. KO (right). The KO group has decreased strain compared to the wild type, demonstrated by smaller size of the vectors.
Echocardiography
Echocardiographic studies were performed within five days of the MRI. Animals were anesthetized with 2% isoflurane supplemented with O2 in an isoflurane induction chamber and maintained with 1.5% isoflurane by nose cone. Echocardiography was performed as previously described.19 Acoustic capture B-mode cine clips (120 Hz) were obtained with electrocardiographic gating using a Sequoia ACUSON System (Siemens Medical Solutions, Mountain View, CA) with a 15-MHz linear array transducer. Image processing and data analysis were performed offline using Syngo™ Vector Imaging technology software (Siemens Medical Solutions, Mountain View, CA).
2-D directed M-mode images from the mid-papillary short axis were used to calculate conventional measurements of the LV, which included the LV end-diastolic diameter (LVEDD), end-systolic diameter (LVESD), anterior (AWTh) and posterior wall thicknesses (PWTh), and fractional shortening (LVFS).
B-mode clips were selected based on adequate visualization of the endocardial border and the absence of image artifacts. The epicardial and endocardial LV borders were manually traced and accurate tracking verified over three cycles in the parasternal short axis view at end-systole to calculate Lagrangian strain at the base, mid, and apex of the LV. Peak circumferential and radial strain values for each segment of the LV were recorded and averaged to obtain global strains for each animal (Figure 1B).
Data acquisition (3 short axes) and analysis (circumferential and radial strains) required ~ 15 minutes per animal.
To ensure good quality images for STE- based strain analyses, image acquisition was performed at a high frame rate by using the smallest possible depth and sector size. All image acquisitions and offline measurements were conducted by a single investigator (SA) who was blinded to animal groups. Using a second investigator (BDH), interobserver differences of peak regional systolic radial and circumferential strains were determined from 20 randomly selected clips as 100 times the difference between two observations divided by the mean of the two observations. Intraobserver differences were determined similarly from 20 randomly selected clips measured ten days apart by a single investigator (AL). Intra- and inter-reader coefficients of variation (CV) were estimated as the root mean square of the CV’s and intra- and inter-reader intraclass coefficients (ICC) were calculated using the method of Fleiss 20
Statistical Analysis
The statistical analysis was performed using SigmaPlot 12.0 and SAS version 9.2 commercial software. All values are expressed as mean ± SD. Non-deformation echocardiographic and MRI variables were compared with one way ANOVA with post-hoc Tukey tests. Strain data were analyzed using linear mixed models, fitting a separate model for the radial and circumferential strains at three locations (base, mid, and apex) and a model each for global radial and circumferential strains. Thus, eight models were fit; for each, Tukey multiple comparison procedure with a family-wise error rate of 0.05 was performed for pairwise comparisons of the six groups defined by the three genotypes, and for comparisons between VVI and MRI within a genotype. Bland-Altman plots were constructed to illustrate the agreement between VVI and MRI strain measurements. The Morgan-Pitman test 21 was used to test the hypotheses that variability was greater for VVI than MRI and variability was greater for radial than circumferential strains. A P value (two-sided) < 0.05 was considered as statistically significant.
Results
Echocardiographic and MRI Volumetric Variables
The LV ejection fraction (EF) measured by MRI for the cMyBP-C−/− and MLP−/− groups (33 ± 8 and 29 ± 9%, respectively) was significantly lower than the wild-type group (69 ± 9%; P <0.05), and was similar between the two groups of knockout mice. Similarly, the fractional shortening (FS) measured by 2D-directed M-mode echocardiography was significantly lower for the cMyBP-C−/− and MLP−/− groups (38±6 and 19±5%, respectively) compared to the wild-type group (61±5%) , but was significantly lower in the MLP−/− than cMyBP-C−/− group (Table 1). The LV EDD and LV ESD were greater in the MLP−/− group and wall thicknesses were greater in the cMyBP-C−/−group. There were no differences in heart rate among the three groups of mice.
Table 1.
Echocardiographic Variables
| Wild Type | cMyBP-C−/− | MLP−/− | p for ANOVA | |
|---|---|---|---|---|
| (n=8) | (n=6) | (n=6) | ||
| Weight (g) | 25.0±2.1 | 20.5±1.9* | 23.0±1.9 | .002 |
| Heart rate (bpm) | 436±32 | 453±8 | 441±23 | NS |
| LV EDD (mm) | 0.35±0.04 | 0.39±0.04 | 0.43±0.03 * | .004 |
| LV ESD (mm) | 0.14±0.03 | 0.24±0.02 * | 0.35±0.02 *† | <.001 |
| LV FS (%) | 61±5 | 38±6* | 19±5*† | <.001 |
| AWTh (mm) | 0.09±0.01 | 0.12±0.01 * | 0.07±0.01 *† | <.001 |
| PWTh (mm) | 0.08±0.01 | 0.10±0.01 * | 0.07±0.01† | <.001 |
| Global RS (%) | 23.5±9.2 | 16.4±4.6 | 6.8±4.0*† | .0011 |
| Global CS (%) | −23.9±6.4§ | −14.5±3.8* | −6.6±4.0*† | <.001 |
Data are mean ± SD. LV= left ventricular; EDD= end-diastolic dimension; ESD=end-systolic dimensions; FS=fractional shortening; AWTh=anterior wall thickness; PWTh=posterior wall thickness; RS= radial strain; CS=circumferential strain.
P < 0.05 vs. Wild-Type,
P < 0.05 vs. cMyBP-C−/−,
P < 0.05 vs. MRI strain (Table 2) for pairwise comparisons.
Global Strain (Tables 1 and 2)
Table 2.
MRI Variables
| Wild Type | cMyBP-C−/− | MLP−/− | p for ANOVA | |
|---|---|---|---|---|
| (n=8) | (n=6) | (n=6) | ||
| Heart rate (bpm) | 562±27 | 571±34 | 528±51 | NS |
| LVEF (%) | 69±9 | 33±8* | 29±9* | <.001 |
| Global RS (%) | 24.7±1.0 | 12.7±2* | 14.8±3.2* | <.001 |
| Global CS (%) | −17.6±1.2 | −8.8±1.9* | −9.8±2.2* | <.001 |
Data are mean ± SD. LVEF= left ventricular ejection fraction; other abbreviations as in Table 1
P < 0.05 vs. Wild-Type for pairwise comparisons.
The Bland-Altman limits were narrower for global CS compared to global RS (Figure 2A and 2B), however, the difference was not statistically significant (p=0.14). Additionally, there was modest correlation between VVI and MRI measured strains, with global CS yielding a stronger correlation compared to global RS (CS R2 = 0.4452 vs. RS R2 = 0.2794, both P<0.05). The global RS measured by MRI was greater in the wild type (24.7 ± 1.0%) than knockout mice (cMyBP-C−/−: 12.7 ± 2.0%, MLP−/−: 14.8 ± 3.2%). In contrast, the global RS measured by VVI in the wild-type mice (23.5 ± 9.2%) was statistically similar to that in the cMyBP-C−/− (16.4 ± 4.6%) but significantly greater than in the MLP−/− mice (6.8 ± 4.0%). The global CS determined with either VVI or MRI was significantly lower in the knockout than wild-type mice. However, only VVI showed significantly lower CS strain in the MLP−/− mice (−6.6 ± 4.0%) than the cMyBP-C−/− mice (-14.5 ± 3.8%).
Figure 2.
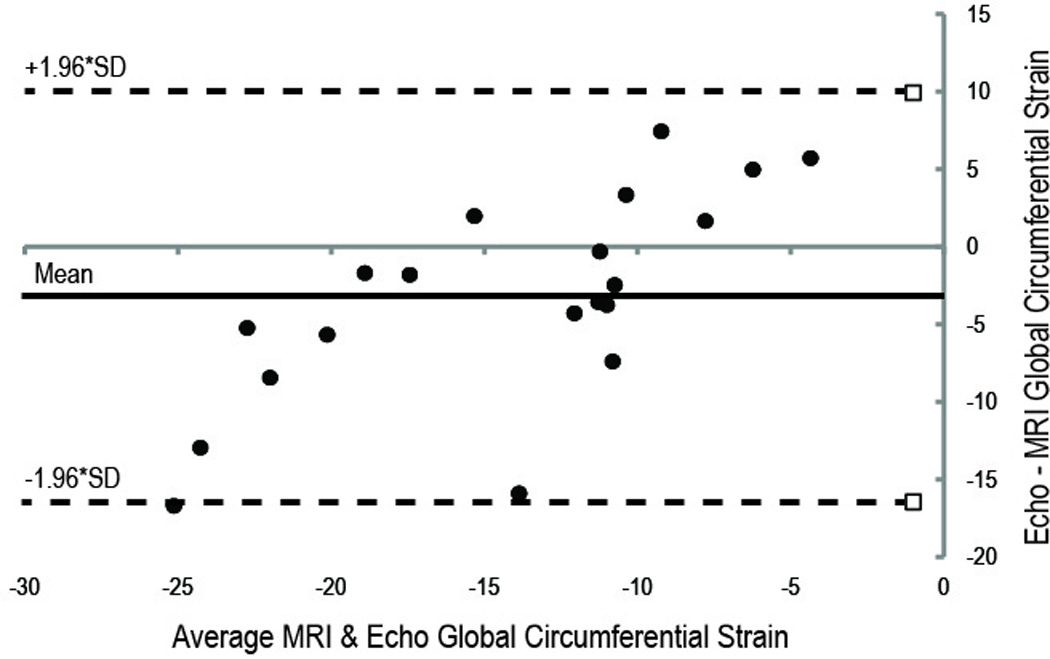
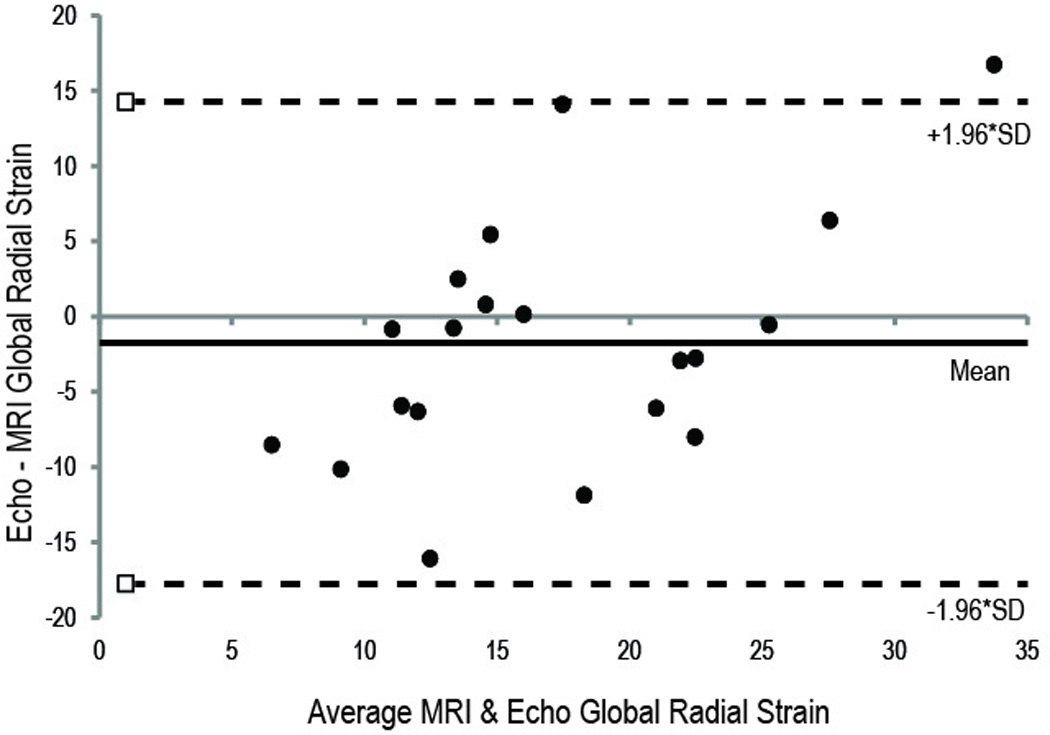
Bland-Altman Plots comparing the MRI- and echo-derived Strain. (A) Circumferential strain measurements. (B) Radial strain measurements. There is closer agreement between the MRI and echo imaging modalities for circumferential strain compared to radial strain measurements. Upper and lower dotted lines are the 95% limits of agreement.
In comparing the VVI and MRI, only global CS strains in the wild-type mice were statistically different, with lower strains measured with MRI compared to VVI. Variability of global CS and RS strains was greater for VVI than MRI (both P<0.05), although variability was similar for global CS and RS (P=0.39).
Regional Strain
Values of regional RS comparing VVI and MRI were similar in both the wild-type and cMyBP-C−/− mice,, and only at the LV base of MLP−/− mice were values significantly different when comparing VVI and MRI (Figure 3). Regional strains measured with MRI in both knockouts were lower than those in the wild-type mice, whereas, only regional RS measured with VVI were significantly lower in the MLP−/− than those in the wild-type mice. When comparing among the two knockout groups, strains measured by VVI were significantly lower in the MLP−/− than cMyBP-C−/− group at the base of the LV; regional RS measured by MRI was similar between the two knockout groups.
Figure 3.
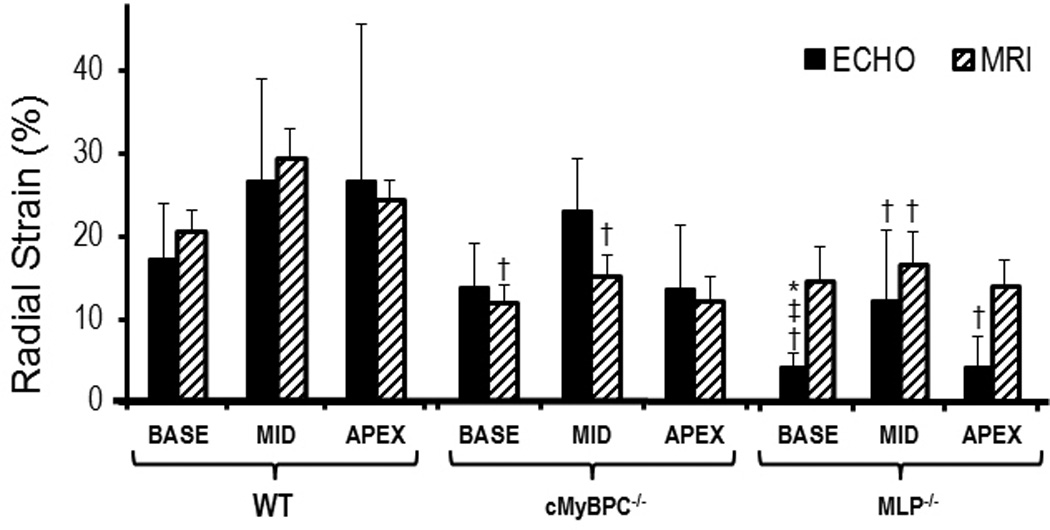
Regional radial strain: (*)P < 0.05 Echo vs. MRI, (†)P < 0.05 Wild type vs. KO, (**)P < 0.05 MyBPC−/− vs. MLP−/− (Echo only). Regional radial strain measurements using MRI and echo in the wild type group are similar. Regional radial strain measurements by MRI in the KO groups are significantly lower compared to the wild type group but more variable via echo.
Values of regional CS comparing VVI and MRI were similar in both the wild-type and MLP−/− mice, and only at the mid LV base of cMyBP-C−/− mice were values significantly different when comparing VVI and MRI Regional CS measured by MRI was lower in the cMyBP-C−/− knockout group compared to the wild-type group at the mid and apex levels, and the MLP−/− knockouts at the mid LV . The regional CS measured by VVI was also lower for both knockout groups compared to wild-type except for regional strain at the mid LV in cMyBP-C−/− mice (Figure 4). Similar to regional RS, VVI regional CS measurements (in this instance, mid LV) was significantly lower in the MLP−/− group compared to cMyBP-C−/− group.
Figure 4.
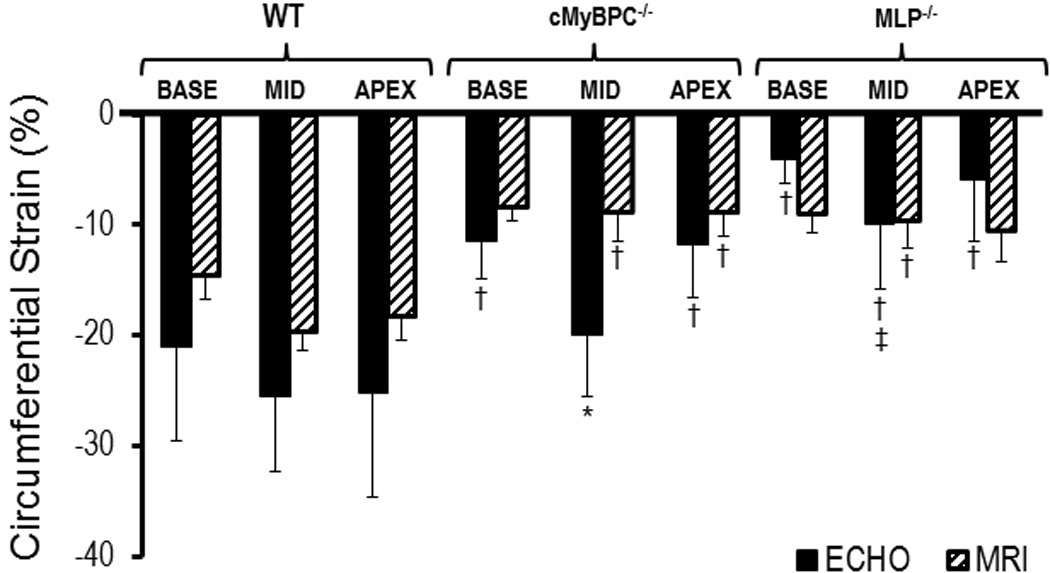
Regional Circumferential Strain: (*)P < 0.05 Echo vs. MRI, (†)P < 0.05 Wild type vs. KO, (**)P < 0.05 MyBPC−/− vs. MLP−/− (Echo only). Regional circumferential strain measurements using MRI and echo in the wild type group are similar. Regional circumferential strain measurements by MRI in the KO groups are significantly lower compared to the wild type group but more variable via echo.
Interpretative Variability
The interobserver differences for circumferential and radial strains were -3.5±14.7 and -3.9±21.9, respectively. Intraobserver differences for circumferential and radial strains were 4.7±9.2% and 4.7±13.0%, respectively. The intra- and inter-reader CV’s were 9.6% and 15.3% for radial strain and 7.2% and 10.4% for circumferential strain, respectively. The intra- and inter-reader ICC’s were .986 and 0.955 for radial strain and 0.990 and 0.932 for circumferential strain, respectively.
Discussion
This is the first study comparing echocardiographic strain imaging using Vector Velocity Imaging (VVI) and MRI in the wild type and genetically altered mouse. The principal results of this study are 1) correlations between MRI and VVI strains are modest and are greater (and agreement tends to be greater) for circumferential than radial strain; 2) strains measured with VVI are more variable than those measured with MRI and the variability is similar for radial and circumferential strains; and 3) VVI-measured strains can be used to rapidly phenotype mouse models of cardiomyopathy. While MRI is currently considered the gold standard for noninvasive myocardial strain imaging, in part because of the ability to evaluate strain in three dimensions, long acquisition and post processing times, expense and limited availability preclude its routine use in the small animal laboratory. Thus, echocardiographic strain is a potentially advantageous method for the objective assessment of global and regional LV function and for high through-put phenotyping of murine models 6.
Bauer et al previously reported speckle tracking strain measurements in wild-type mice which were higher than values obtained in our study. The previous study used speckle-tracking algorithm supplied by VisualSonics (VevoStrain, VisualSonics, Toronto Canada), whereas echocardiographic strain measurements in our study were obtained by VVI algorithm supplied by Siemens Medical Solutions (Syngo™ Vector Imaging technology software, Siemens Medical Solutions, Mountain View CA).6 The proprietary speckle tracking software from the two companies and the superior sampling rates in the VisualSonics software may account for the difference in the strain measurements. Importantly, in this study, the VVI strains are similar to those obtained with MRI and the latter measured in the wild-type mice were similar to MRI strains previously reported.14
Bansal et al previously reported validation of VVI strain with harmonic phase MRI in humans with a very modest correlation between the two modalities, greater with circumferential than radial strain (CS R2 = 0.12 vs. RS R2 = 0.005).13 Similarly, in our study, the correlation between VVI and MRI strain was higher with CS than RS (CS R2 = 0.4452 vs. RS R2 = 0.2794), but both CS and RS correlations in our study were much greater than in that validation study involving human subjects and were similar to both Bansal et al (CS R2=0.397 and RS R2=0.348, both P<0.05) and Cho et al 22 (CS R2=0.26 and RS R2=0.36) using a different speckle-tracking algorithm, automated functional imaging (GE Medical Systems, Milwaukee WI). Nevertheless, our correlations are disappointingly less robust than those reported in a validation study in five mice after myocardial infarction and two control mice using the VisualSonics instrument with EKV (CS R2 = 0.81 and RS R2 = 0.72), which acquires data from multiple cardiac cycles and constructs an image sequence composed of over 100 images per cardiac cycle.15
LV contraction is a complex process involving deformation resulting in shortening in three normal directions; longitudinal, circumferential, and radial. Longitudinal strain, which is a sensitive indicator of subendocardial fiber dysfunction and an early marker of ischemia and increased wall stress, was not evaluated in this study as we were comparing directly with MRI as it is measured in small animals in our institution. In addition, advantages of strain imaging over conventional echocardiographic parameters could not be demonstrated in this study, which was designed to compare strain imaging with MRI in fully developed models of cardiomyopathy. In a previous study in mice, longitudinal strains were sensitive to changes early after experimental myocardial infarction and were able to predict LV remodeling; circumferential and radial strains were not as consistent.6 Longitudinal strain is typically obtained from an apical view (although the parasternal long axis view was used by Bauer et al6), which is difficult to reliably obtain in small animals. Circumferential and radial strains are more influenced by transmural fiber dysfunction (especially the mid-myocardium) and are generally more suited for identifying dysfunction in ventricles with reduced LV systolic function.23
Both MRI and VVI strain measurements were able to differentiate between the wild-type group and the genetic models of cardiomyopathy, reinforcing the potential usefulness of strain measurements in mouse models of LV dysfunction. However, only VVI CS strain differentiated between the two models of cardiomyopathy, which corresponded with differences in their echocardiographic LV fractional shortening.
One potential difficulty is that VVI had greater variability in strain measurement compared to MRI and was particularly problematic in measurement of radial strain. This may be due to the need to track both epicardial and endocardial borders, the former more difficult to identify with a resultant decrease in accuracy. The greater variability has been reported in previous studies.13 Although MRI radial strains are generally more variable than circumferential, in this study, their variability was similar.
Limitations
Several limitations of this study merit consideration. First, for logistic reasons, echocardiography and MRI were not performed on the same day for all the animals. This may be responsible in part for the modest correlations between the two techniques. Second, the echocardiographic images were obtained using 2D rather than 3D imaging used in MRI; translation of the heart remains a problem using 2D acquisition methods as error is introduced to strain measurements when the heart swings out of the imaging plane. In addition, out-of-plane motion occurs due to rotation and motion of the heart; as a result, only a portion of the real motion can be detected. Third, potential sources of variation include the quality of the images obtained for strain analysis. High quality of the 2D images at high frame rates is essential for accurate VVI strain measurements. Moreover, poor quality of images may hinder the investigator’s ability to perform tracing of the endocardium and epicardium which may affect the strain values, thereby introducing another source of variability. Fourth, while temporal resolution for the echocardiograms (120 Hz) was similar (8.3 ms) to the MRI, the accuracy of tracking speckles may theoretically be jeopardized at these frame rates and may have resulted in a significant underestimation of strain values; higher frame rates were reported using different instrumentation and algorithms 6,15. Finally, changes in the imaging angle of incidence can result in capturing different fiber layers at different levels and may introduce variability, particularly since we analyzed exclusively short views which are sensitive to small differences in image angle.6
Conclusion
Despite these limitations, we demonstrate that measuring LV circumferential and radial strains is feasible in small animals using 2D echocardiography with VVI. VVI and MRI strain measurements correlated modestly and the correlation was greater (and agreement tended to be greater) for circumferential than radial strain. VVI had greater variability in strain measurement compared to MRI. Although global VVI and MRI strains were able to differentiate between wild-type and knockout mice, only VVI strain differentiated between the two models of cardiomyopathy.
Acknowledgments
Sources of Funding
This study was supported by National Heart, Lung, and Blood Institute Grants HL-73315 and HL-86935 (XY), HL057506 (BDH) and grants from the American Heart Association 09SDG2050195 (JES).
Footnotes
Publisher's Disclaimer: This is a PDF file of an unedited manuscript that has been accepted for publication. As a service to our customers we are providing this early version of the manuscript. The manuscript will undergo copyediting, typesetting, and review of the resulting proof before it is published in its final citable form. Please note that during the production process errors may be discovered which could affect the content, and all legal disclaimers that apply to the journal pertain.
Disclosures
Dr Hoit is a speaker for Philips Medical.
References
- 1.Popovic ZB, Benejam C, Bian J, Mal N, Drinko J, Lee K, Forudi F, Reeg R, Greenberg NL, Thomas JD, Penn MS. Speckle-tracking echocardiography correctly identifies segmental left ventricular dysfunction induced by scarring in a rat model of myocardial infarction. Am J Physiol Heart Circ Physiol. 2007;292:H2809–H2816. doi: 10.1152/ajpheart.01176.2006. [DOI] [PubMed] [Google Scholar]
- 2.Bachner-Hinenzon N, Ertracht O, Leitman M, Vered Z, Shimoni S, Beeri R, Binah O, Adam D. Layer-specific strain analysis by speckle tracking echocardiography reveals differences in left ventricular function between rats and humans. AJP: Heart and Circulatory Physiology. 2010;299:H664–H672. doi: 10.1152/ajpheart.00017.2010. [DOI] [PubMed] [Google Scholar]
- 3.Hoit BD. Echocardiographic characterization of the cardiovascular phenotype in rodent models. Toxicol Pathol. 2006;34:105–110. doi: 10.1080/01926230500369535. [DOI] [PubMed] [Google Scholar]
- 4.Marwick TH, Raman SV, Carrio I, Bax JJ. Recent developments in heart failure imaging. JACC Cardiovasc Imaging. 2010;3:429–439. doi: 10.1016/j.jcmg.2010.02.002. [DOI] [PubMed] [Google Scholar]
- 5.Borg AN, Ray SG. A unifying framework for understanding heart failure? Response to"left ventricular torsion by two-dimensional speckle tracking echocardiography in patients with diastolic dysfunction and normal ejection fraction" by park sj et al. J Am Soc Echocardiogr. 2009;22:318–320. doi: 10.1016/j.echo.2008.11.026. author reply 321-312. [DOI] [PubMed] [Google Scholar]
- 6.Bauer M, Cheng S, Jain M, Ngoy S, Theodoropoulos C, Trujillo A, Lin FC, Liao R. Echocardiographic speckle-tracking based strain imaging for rapid cardiovascular phenotyping in mice. Circ Res. 2011;108:908–916. doi: 10.1161/CIRCRESAHA.110.239574. [DOI] [PMC free article] [PubMed] [Google Scholar]
- 7.Stanton T, Marwick TH. Assessment of subendocardial structure and function. JACC Cardiovasc Imaging. 2010;3:867–875. doi: 10.1016/j.jcmg.2010.05.011. [DOI] [PubMed] [Google Scholar]
- 8.Hoit BD. Strain and strain rate echocardiography and coronary artery disease. Circ Cardiovasc Imaging. 2011;4:179–190. doi: 10.1161/CIRCIMAGING.110.959817. [DOI] [PubMed] [Google Scholar]
- 9.Adamu U, Schmitz F, Becker M, Kelm M, Hoffmann R. Advanced speckle tracking echocardiography allowing a three-myocardial layer-specific analysis of deformation parameters. Eur J Echocardiogr. 2009;10:303–308. doi: 10.1093/ejechocard/jen238. [DOI] [PubMed] [Google Scholar]
- 10.Chetboul V. Advanced techniques in echocardiography in small animals. Vet Clin North Am Small Anim Pract. 2010;40:529–543. doi: 10.1016/j.cvsm.2010.03.007. [DOI] [PubMed] [Google Scholar]
- 11.Cottrell C, Kirkpatrick JN. Echocardiographic strain imaging and its use in the clinical setting. Expert Rev Cardiovasc Ther. 2010;8:93–102. doi: 10.1586/erc.09.165. [DOI] [PubMed] [Google Scholar]
- 12.Rappaport D, Adam D, Lysyansky P, Riesner S. Assessment of myocardial regional strain and strain rate by tissue tracking in b-mode echocardiograms. Ultrasound Med Biol. 2006;32:1181–1192. doi: 10.1016/j.ultrasmedbio.2006.05.005. [DOI] [PubMed] [Google Scholar]
- 13.Bansal M, Cho GY, Chan J, Leano R, Haluska BA, Marwick TH. Feasibility and accuracy of different techniques of two-dimensional speckle based strain and validation with harmonic phase magnetic resonance imaging. J Am Soc Echocardiogr. 2008;21:1318–1325. doi: 10.1016/j.echo.2008.09.021. [DOI] [PubMed] [Google Scholar]
- 14.Liu W, Ashford MW, Chen J, Watkins MP, Williams TA, Wickline SA, Yu X. MR tagging demonstrates quantitative differences in regional ventricular wall motion in mice, rats, and men. Am J Physiol Heart Circ Physiol. 2006;291:H2515–H2521. doi: 10.1152/ajpheart.01016.2005. [DOI] [PubMed] [Google Scholar]
- 15.Li Y, Garson CD, Xu Y, Beyers RJ, Epstein FH, French BA, Hossack JA. Quantification and MRI validation of regional contractile dysfunction in mice post myocardial infarction using high resolution ultrasound. Ultrasound Med Biol. 2007;33:894–904. doi: 10.1016/j.ultrasmedbio.2006.12.008. [DOI] [PMC free article] [PubMed] [Google Scholar]
- 16.Arber S, Hunter JJ, Ross J, Jr, Hongo M, Sansig G, Borg J, Perriard JC, Chien KR, Caroni P. Mlp-deficient mice exhibit a disruption of cardiac cytoarchitectural organization, dilated cardiomyopathy, and heart failure. Cell. 1997;88:393–403. doi: 10.1016/s0092-8674(00)81878-4. [DOI] [PubMed] [Google Scholar]
- 17.Harris SP, Bartley CR, Hacker TA, McDonald KS, Douglas PS, Greaser ML, Powers PA, Moss RL. Hypertrophic cardiomyopathy in cardiac myosin binding protein-c knockout mice. Circ Res. 2002;90:594–601. doi: 10.1161/01.res.0000012222.70819.64. [DOI] [PubMed] [Google Scholar]
- 18.Zhong J, Yu X. Strain and torsion quantification in mouse hearts under dobutamine stimulation using 2D multiphase MR DENSE. Magn Reson Med. 2010;64:1315–1322. doi: 10.1002/mrm.22530. [DOI] [PMC free article] [PubMed] [Google Scholar]
- 19.Morgan EE, Faulx MD, McElfresh TA, Kung TA, Zawaneh MS, Stanley WC, Chandler MP, Hoit BD. Validation of echocardiographic methods for assessing left ventricular dysfunction in rats with myocardial infarction. Am J Physiol Heart Circ Physiol. 2004;287:H2049–H2053. doi: 10.1152/ajpheart.00393.2004. [DOI] [PubMed] [Google Scholar]
- 20.Fleiss JL. The Design and Analysis of Clinical Experiments. New York: Wiley; 1996. Chapter 1. [Google Scholar]
- 21.Wilcox RR. Comparing the variances of two dependent groups. Journal of Educational and Behavioral Statistics. 1990;15:237–247. [Google Scholar]
- 22.Cho G-Y, Chan J, Leano R, Strudwick M, Marwick TH. Comparison of two-dimensional speckle and tissue velocity based strain and validation with harmonic phase magnetic resonance imaging. Am J Cardiol. 2006;97:1661–1666. doi: 10.1016/j.amjcard.2005.12.063. [DOI] [PubMed] [Google Scholar]
- 23.Geyer H, Caracciolo G, Abe H, Wilansky S, Carerj S, Gentile F, Nesser HJ, Khandheria B, Narula J, Sengupta PP. Assessment of myocardial mechanics using speckle tracking echocardiography: Fundamentals and clinical applications. J Am Soc Echocardiogr. 2010;23:351–369. doi: 10.1016/j.echo.2010.02.015. [DOI] [PubMed] [Google Scholar]