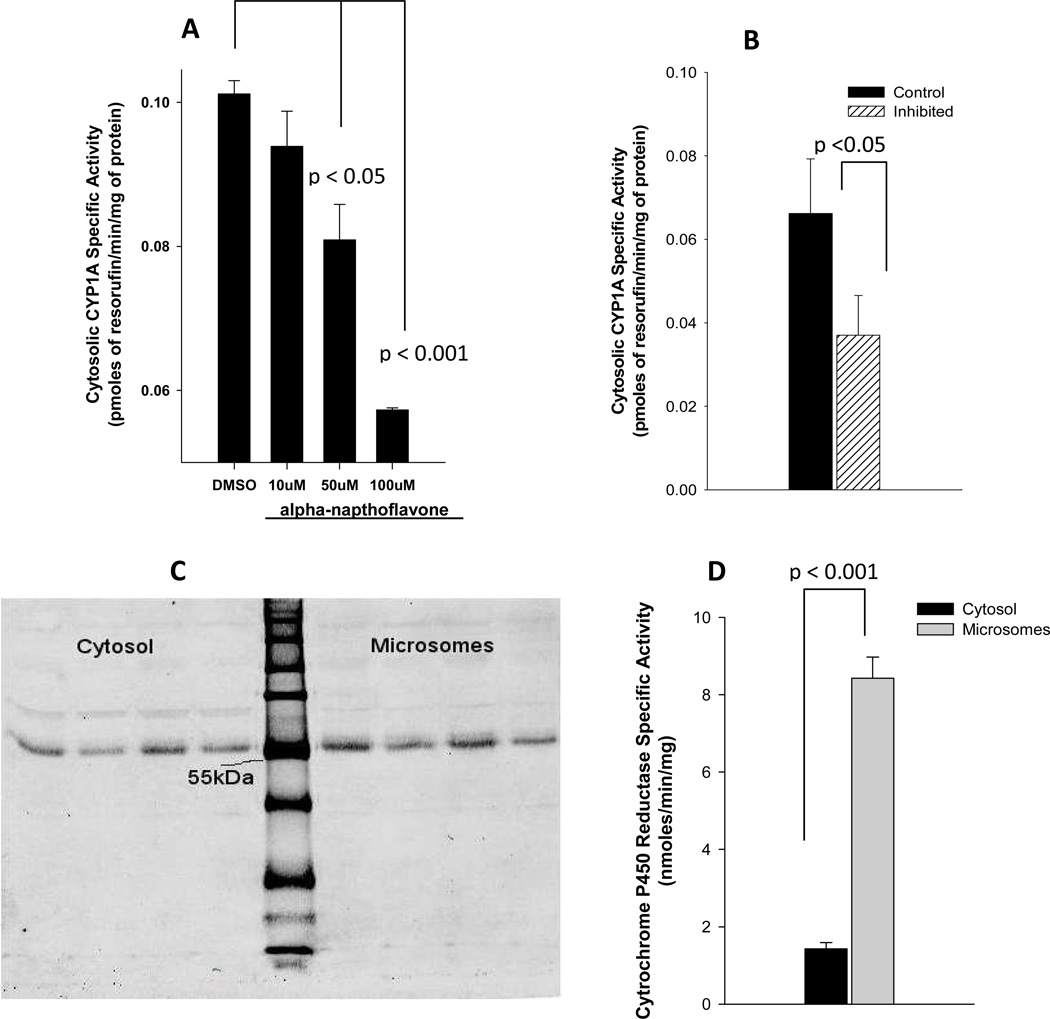
Figure 1. Cytosolic CYP1A1 in human placenta.
(A) Placental cytosolic fractions from two pooled samples (n=3 placentas in each pooled sample) were incubated in duplicate with 10µl of DMSO (vehicle) or α-napthoflavone (final concentrations of 10, 50, or 100 µM). Reaction was started by adding ethoxyresorufin, and the CYP1A specific activity was estimated as amount of the product (resorufin) formed/min/mg of protein. A one-way analysis of variance was performed to test for differences among treatments; multiple comparisons versus controls (DMSO) were carried out using one-way analysis of variance with a Holm-Sidak test for pair-wise comparisons. (B) Cytosolic fractions (n=4) were incubated with 20µl of rabbit polyclonal E. coli expressed against human CYP1A1. Average CYP1A1 activity with and without these antibodies are shown above. A paired t-test was used to compare control and antibody-inhibited incubations. (C) Western blots of cytosolic and microsomal fractions (n=4) are shown to the left and right, respectively, of the molecular weight marker (LiCor Odyssey® Two-Color Protein Molecular Weight Marker). Strong signal was detected at ~55kDa. (D) Placental cytosolic and microsomal fractions were incubated with oxidized form of Cytochrome c, and the specific activity of Cytochrome P450 Reductase was estimates as the amount of the product (reduced form of Cytochrome c) formed/min/mg of protein. A paired t-test was used to compare microsomal activity to cytosolic activity (n=3).

