Assessing apparent diffusion coefficient along with dynamic contrast-enhanced MR imaging features may decrease false-positive MR imaging findings and contribute to improved radiologic-pathologic concordance for particular nonmalignant lesion subtypes sampled for biopsy.
Abstract
Purpose:
To evaluate the diffusion-weighted (DW) imaging characteristics of nonmalignant lesion subtypes assessed as false-positive findings at conventional breast magnetic resonance (MR) imaging.
Materials and Methods:
This HIPAA-compliant retrospective study had institutional review board approval, and the need for informed patient consent was waived. Lesions assessed as Breast Imaging Reporting and Data System category 4 or 5 at clinical dynamic contrast material–enhanced MR imaging that subsequently proved nonmalignant at biopsy were retrospectively reviewed. One hundred seventy-five nonmalignant breast lesions in 165 women were evaluated. Apparent diffusion coefficients (ADCs) from DW imaging (b = 0, 600 sec/mm2) were calculated for each lesion and were compared between subtypes and with an ADC threshold of 1.81 × 10⁻³ mm2/sec (determined in a prior study to achieve 100% sensitivity).
Results:
Eighty-one (46%) lesions exhibited ADCs greater than the predetermined threshold. The most prevalent lesion subtypes with mean ADCs above the threshold were fibroadenoma ([1.94 ± 0.38 {standard deviation}] × 10−3 mm2/sec; n = 30), focal fibrosis ([1.84 ± 0.48] × 10−3 mm2/sec; n = 19), normal tissue ([1.81 ± 0.47] × 10−3 mm2/sec; n = 13), apocrine metaplasia ([2.01 ± 0.38] × 10−3 mm2/sec; n = 13), usual ductal hyperplasia ([1.83 ± 0.49] × 10−3 mm2/sec; n = 12), and inflammation ([1.95 ± 0.46] × 10−3 mm2/sec; n = 10). Atypical ductal hyperplasia ([1.48 ± 0.36] × 10−3 mm2/sec; n = 23) was the most common lesion subtype with ADC below the threshold. Lymph nodes exhibited the lowest mean ADC of all nonmalignant lesions ([1.28 ± 0.23] × 10−3 mm2/sec; n = 4). High-risk lesions (atypical ductal hyperplasia and lobular neoplasia) showed significantly lower ADCs than other benign lesions (P < .0001) and were the most common lesions with ADCs below the threshold.
Conclusion:
Assessing ADC along with dynamic contrast-enhanced MR imaging features may decrease the number of avoidable false-positive findings at breast MR imaging and reduce the number of preventable biopsies. The ability of DW imaging to help differentiate high-risk lesions requiring additional work-up from other nonmalignant subtypes may further improve patient care.
© RSNA, 2012
Supplemental material: http://radiology.rsna.org/lookup/suppl/doi:10.1148/radiol.12112672/-/DC1
Introduction
In recent years, magnetic resonance (MR) imaging has become an increasingly utilized tool in breast cancer detection and staging. Dynamic contrast material–enhanced MR imaging is the most sensitive technique for screening high-risk women (1–4) and for evaluating the extent of disease in patients with a recent diagnosis of breast cancer (5–8). Despite its numerous advantages, the moderate specificity of dynamic contrast-enhanced MR imaging (affected by factors such as reader experience, imaging protocol [9,10], and background enhancement [11]) can result in a substantial number of false-positive findings requiring biopsies. Reducing the number of avoidable false-positive findings at breast dynamic contrast-enhanced MR imaging could substantially decrease morbidity for patients.
Diffusion-weighted (DW) imaging is a short, non–contrast-enhanced MR imaging sequence that has strong potential to increase specificity as an adjunct to conventional breast MR imaging protocols (12–20). DW imaging provides different and potentially complementary information to dynamic contrast-enhanced MR imaging. DW imaging measures the apparent diffusion coefficient (ADC), which is related to the mobility of water molecules in vivo and indirectly reflects tissue microstructural characteristics (21). DW imaging studies of the breast have demonstrated significantly lower ADCs for breast carcinomas than for benign breast lesions or normal tissue (12,14,18–20,22–31). This has primarily been attributed to the higher cell density of malignancies (12,16,32,33). Recent promising studies (19,34,35) have shown improved accuracy for characterizing enhancing breast lesions through a multivariate combination of DW imaging and dynamic contrast-enhanced MR imaging features and have identified potential ADC thresholds for reducing the number of avoidable false-positive findings at conventional breast MR imaging assessment (15,18,20,35).
While breast malignancies on average demonstrate lower ADCs than nonmalignant lesions, there is substantial overlap between the two groups, and little is known about the ADCs of specific subtypes of nonmalignant lesions. Breast DW imaging studies to date have included relatively limited numbers and/or subtypes of nonmalignant lesions (15,20,36). The purpose of our study was to characterize ADCs for a variety of nonmalignant lesion subtypes representative of the false-positive findings typically encountered at dynamic contrast-enhanced MR imaging. We further sought to determine which particular subtypes exhibit ADCs below a previously proposed diagnostic ADC threshold and comprise the overlap with malignancies reported by previous studies.
Materials and Methods
Our study was approved by our institutional review board and was Health Insurance Portability and Accountability Act compliant. The need to obtain informed consent was waived for this retrospective analysis. A retrospective review of our prospectively populated MR imaging database was performed to identify all consecutive suspicious breast lesions detected at breast MR imaging from October of 2005 to December of 2008 that were subsequently sampled at core needle or surgical biopsy. Patients were required to be at least 18 years of age and not to be undergoing neoadjuvant systemic breast cancer treatment.
Patients and Lesions
Study lesions were those that were detected at breast MR imaging and assigned a final Breast Imaging Reporting and Data System (BI-RADS) (37) assessment of 4 (suspicious) or 5 (highly suggestive of malignancy), were imaged with DW imaging during the MR imaging examination, and were proved nonmalignant at core needle biopsy (guided with ultrasonography [US] or MR imaging) or at excision after MR imaging. Lesions categorized as nonmalignant without specific diagnosis or histologic subtypes, such as those removed within mastectomy specimens, were not included in the study. Final histopathologic outcomes for all the lesions yielding high-risk atypical ductal hyperplasia (ADH), atypical lobular hyperplasia (ALH), or lobular carcinoma in situ (LCIS) at core needle biopsy were based on subsequent surgical biopsy results as the standard of care at our institution.
Four hundred seventeen suspicious lesions (BI-RADS 4 or 5) with definitive histologic findings were identified on 353 dynamic contrast-enhanced MR imaging studies in 341 women over the course of the study period. Of these lesions, 164 were malignant (24 were high-risk lesions that demonstrated malignancy at the subsequent excisional biopsy) and 253 were benign or high risk. DW imaging was not performed during the MR imaging examinations for 50 (20%) of 253 lesions because of time constraints related to scheduling and/or patient discomfort that caused termination of the MR imaging examination prior to DW imaging (acquired at the end of the examination). Additionally, 28 (11%) of 253 lesions that had been imaged with DW imaging were excluded from the study because of misregistration within the DW imaging sequence owing to patient motion and/or eddy current–based distortions. The final cohort included 175 nonmalignant lesions in 162 examinations in 161 women. Subjects ranged in age from 27 to 77 years (median age, 48 years).
The clinical indications for the MR imaging examinations were to evaluate extent of disease in patients with a new diagnosis of breast cancer in 83 (51%) of 162 studies, high-risk screening in 64 (40%) studies, problem solving in 12 (7%) studies, and short-term follow-up in three (2%) studies. Fifty-two of the nonmalignant lesions in our study, as well as a group of 31 malignant lesions (used for the ADC comparisons with benign lesion subtypes in Fig 1), were included in a prior study investigating the clinical utility of breast DW imaging (20).
Figure 1:
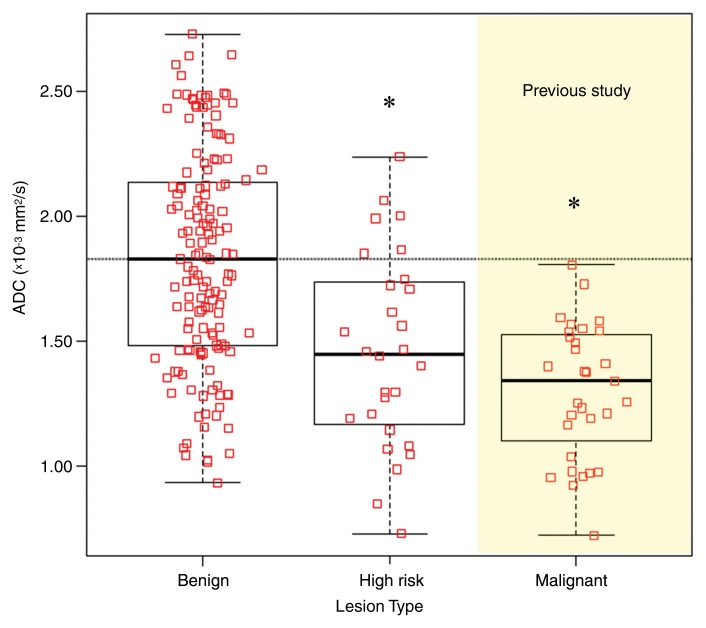
Graph shows comparison of ADCs of benign, high-risk, and malignant breast lesions. Box plots represent medians and ranges of ADCs. Benign and high-risk lesions (including ADH and LCIS) were analyzed for our study, and ADCs of all malignant (n = 31) breast lesions from a prior study (20) are shown for comparison. Benign lesions demonstrated significantly higher mean ADC ([1.83 ± 0.43 {standard deviation}] × 10−3 mm2/sec) than high-risk lesions ([1.46 ± 0.39] × 10−3 mm2/sec, P < .0001, corrected α = .025) and malignant lesions ([1.30 ± 0.27] × 10−3 mm2/sec, P < .0001, corrected α = .017). * = Significant difference from benign lesions, P < .0001. However, there were no differences in ADC between the high-risk and malignant lesion types (P = .1).
MR Imaging
All MR imaging examinations were performed with a 1.5-T imaging unit (LX; GE Healthcare, Waukesha, Wis) using a dedicated eight-channel bilateral breast coil in the axial orientation. Each MR imaging examination included a T2-weighted fast spin-echo sequence, a T1-weighted non–fat-suppressed sequence, a T1-weighted dynamic contrast-enhanced imaging sequence with one precontrast and multiple postcontrast acquisitions, and a DW imaging sequence.
Dynamic contrast-enhanced MR imaging was performed with a fat-suppressed T1-weighted three-dimensional fast spoiled gradient-recalled echo sequence with parallel imaging (Volume Imaging for BReast Assessment, or VIBRANT) and the following parameters: repetition time msec/echo time msec, 6.2/3; flip angle, 10°; and field of view, 32–38 cm. From October 2005 through June 2006, these studies were performed with a 2.2-mm section thickness, a 350 × 350 matrix, and five postcontrast acquisitions centered at 90, 180, 270, 360, and 450 seconds. From July 2006 through December 2008, these studies were performed with a 1.6-mm section thickness, a 420 × 420 matrix, and three postcontrast acquisitions centered at 90, 270, and 450 seconds. The contrast agent administered was 0.1 mmol gadopentetate dimeglumine (Omniscan; GE Healthcare) per kilogram of body weight.
DW imaging was performed after the dynamic contrast-enhanced imaging acquisition by using a DW echo-planar imaging sequence with parallel imaging (Array Spatial Sensitivity Encoding Technique, or ASSET) and fat suppression (SPECtral Inversion at Lipids, or SPECIAL) with the following parameters: reduction factor, two; 7000/71.5; number of signals acquired, three; matrix, 192 × 192; field of view, 36 cm; section thickness, 5 mm; and gap, 0. Diffusion gradients were applied in six directions with b = 0 and 600 sec/mm2, and the total imaging time was 2 minutes 40 seconds.
Image Analysis
The dynamic contrast-enhanced MR imaging studies were prospectively interpreted by one of four fellowship-trained radiologists specializing in breast imaging, all with breast MR imaging experience of 5–11 years (including C.D.L., with 11 years of experience, and W.B.D., with 9 years of experience). Each lesion was assessed by using the American College of Radiology BI-RADS Breast MR Imaging Lexicon (37), which incorporates morphologic and kinetic features. All examinations were processed by using a commercially available computer-aided evaluation software system (CADstream, version 3.0; Confirma, Bellevue, Wash). The final assessment was based on the dynamic contrast-enhanced MR imaging information (from one precontrast acquisition, three postcontrast acquisitions, and initial postcontrast subtractions) and the computer-aided evaluation information, along with T2-weighted and non–fat-suppressed T1-weighted images. Lesion characteristics, including size and location, as well as the BI-RADS assessment and recommendation, were recorded at the time of interpretation. This information was entered into our clinical database, along with detailed histopathologic findings for each lesion. Because the dynamic contrast-enhanced MR images were evaluated prospectively, the radiologists were blinded to lesion outcomes at the time of interpretation.
The DW images were not interpreted at the time of the initial clinical evaluation and were analyzed retrospectively by researchers who were trained in quantitative analysis of breast MR images (data were measured by S.P., with 1 year of experience, and were reviewed for accuracy by S.C.P, with 15 years of experience). Researchers utilized prior clinical radiology reports to identify lesions at DW imaging and were blinded to the results of pathologic examination (nonmalignant subtype). Ambiguous cases (where more than one enhancing lesion was present at dynamic contrast-enhanced MR imaging or the report was unclear) were reviewed for final consensus by a radiologist specializing in breast imaging and breast MR imaging (H.R., with 3 years of experience) who was blinded to the final results of pathologic examination.
DW images were spatially registered by using a nonlinear two-dimensional registration algorithm (CADstream) to correct for patient motion and eddy current–induced image distortion. The b = 0 sec/mm2 images were used as a reference to register the corresponding b = 600 sec/mm2 DW images. Diffusion maps were created by using in-house software that incorporates the ImageJ (National Institutes of Health, public domain) and JDTI (Daniel P. Barboriak Laboratory, Duke University School of Medicine, Durham, NC) image processing tools. A noise-level threshold of 200 was applied to mask the b = 0 sec/mm2 images before diffusion maps were created. ADC maps were created from the spatially registered DW images by using the following equation:
 |
where b = 600 sec/mm2, SDWI is the combined DW image (geometric average of individual b = 600 sec/mm2 DW images), and S0 is the b = 0 sec/mm2 reference image.
For each lesion detected at dynamic contrast-enhanced MR imaging, a region of interest (ROI) was defined at the corresponding location on the DW images. The ROI was drawn freehand to include the area of hyperintensity on the combined DW image (b = 600 sec/mm2) and to encompass as much of the abnormality as possible while staying within the border of the hyperintense region. ROIs for evaluation of normal fibroglandular tissue were placed on the contralateral breast at an area where no lesion was reported. The median size of the ROIs was 51.8 mm2 (range, 3.9–1315 mm2) for lesions and 47.7 mm2 (range, 3.9–411 mm2) for the normal fibroglandular tissue. Care was taken to avoid regions of high T2 within a lesion, such as cyst, hematoma, or necrosis, by verifying the ROI against the T2-weighted b = 0 sec/mm2 image. In the case that a lesion was not hyperintense at DW imaging, the ROI was drawn at the corresponding location and size as reflected at dynamic contrast-enhanced MR imaging with respect to other anatomic details. The mean ADC of the voxels in the ROI was calculated.
Histopathologic Analysis
Pathology reports were reviewed to determine the diagnosis and histologic subtype of each nonmalignant lesion. A pathologist (K.H.A., with 5 years of experience) who was blinded to the lesions’ DW imaging characteristics reviewed those lesions with mixed histologic characteristics and categorized them on the basis of their dominant or most important prognostic features. For example, a nonmalignant lesion with any ductal atypia was classified as ADH. If no atypia was identified, lesions were classified on the basis of the most dominant feature. The pathologist further divided the nonmalignant lesions into high-risk versus non high-risk major groups. High-risk lesions were those yielding ADH, ALH, or LCIS. ALH and LCIS were further combined for subtype categorization and designated as lobular neoplasia. The category of non–high-risk benign lesions comprised all other histopathologic subtypes.
Statistical Analysis
ADCs for the 175 lesions were compared with ADCs of the normal fibroglandular tissue in each patient by using the Wilcoxon signed-rank test. The mean ADCs of benign and high-risk subtypes were compared with those of malignant lesions (all 31 malignant lesions reported in our prior study—15 invasive ductal carcinomas, five invasive lobular carcinomas, and 11 cases of ductal carcinoma in situ [20]) by using the Kruskal-Wallis test and post-hoc pairwise comparisons (Wilcoxon rank-sum tests). Mean ADCs were also compared between specific nonmalignant lesion subtypes by using the same method. The significance levels of the multiple post-hoc tests were adjusted by using sequential Holm-Bonferroni corrections in multiple comparisons (the corrected α is given in parentheses for each comparison). Nonmalignant subtype ADCs were further compared with a previously determined ADC threshold of 1.81 × 10⁻³ mm2/sec. This threshold was determined in our previous study (20) of 83 consecutive suspicious breast lesions that warranted biopsy on the basis of dynamic contrast-enhanced MR imaging findings and was defined on the basis of the highest ADC observed for all 31 malignant lesions in that study to achieve 100% sensitivity with optimal specificity. Menopausal status was not available for the study cohort at the time of our analyses. Thus, age 50 years or greater served as a surrogate for postmenopausal status. Positive predictive value 3 (PPV3) was defined as the number of malignant lesions divided by the number of lesions sampled for biopsy. To test for selection bias, a χ2 test was used to compare the clinical indications for MR imaging for lesions in the initial cohort population versus those for lesions that were analyzed in the study after exclusions. The performance of the ADC threshold was also compared within each clinical indication and age group by using the χ2 test. P < .05 was considered to indicate a statistically significant difference. To evaluate inter- and intraobserver agreement, ADC measurements were repeated for a consecutive subset of 30 nonmalignant lesions. We compared the original ADC measurements by S.P. (SP1) with repeat measurements by S.P. (SP2) and with measurements by M.L.O. (MLO) (with 1 year of training in breast DW imaging). The SP2 and MLO measurements were performed 18 months after the SP1 measurements. The Wilcoxon signed-rank test for paired data was used to test whether differences between measurements by the same observer (SP1 vs SP2) or measurements between observers (SP1 vs MLO) were centered around zero. Bland-Altman plots and concordance correlation coefficients (CCCs) were used to further examine the inter- and intraobserver agreement of ADC measurements. Analyses were performed by using JMP software, version 9.0.2 (SAS Institute, Cary, NC).
Results
Patients and Lesions
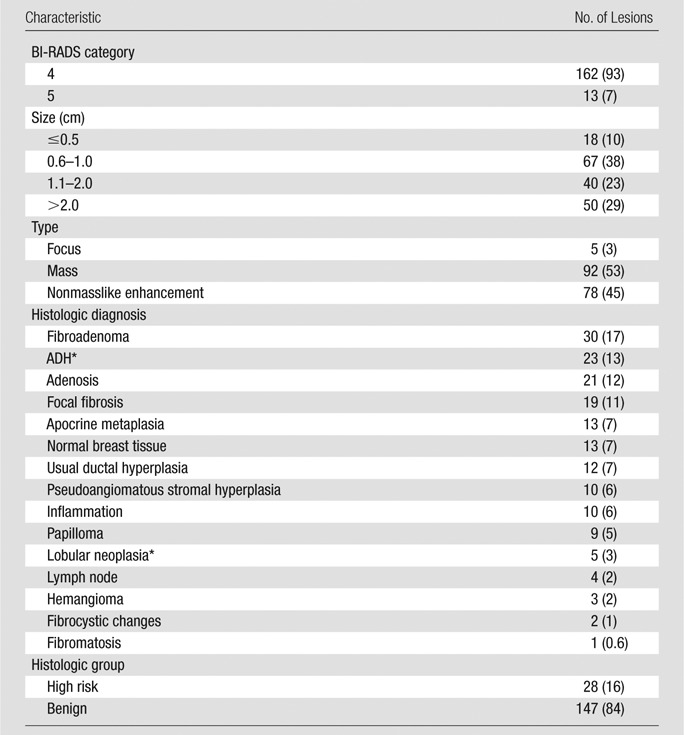
MR imaging–guided biopsy was performed for 129 of 175 lesions, US-guided biopsy was performed for 43 lesions, and excisional biopsy was performed for three lesions. Lesion characteristics are reported in Table 1. The four most common histologic subtypes were fibroadenoma (n = 30), ADH (n = 23), adenosis (n = 21), and focal fibrosis (n = 19). Four lymph nodes that were included in our study were described as suspicious masses at MR imaging and subsequent US. Maximum lesion size, as defined by the longest dimension at dynamic contrast-enhanced MR imaging, ranged from 0.2 to 9.1 cm (median, 1.1 cm). Lesion types included five (3%) foci, 92 (53%) masses, and 78 (45%) areas of nonmasslike enhancement. Twenty-eight (16%) lesions were high-risk lesions (ADH or lobular neoplasia). The distribution of clinical indications for MR imaging was not significantly different before (n = 253) and after (n = 175) exclusion of lesions because of missing or misregistered DW imaging data (χ2 = 0.9, P = .8). The PPV3 for dynamic contrast-enhanced MR imaging alone was 39% (164 of 417) overall and 47% (120 of 253) for evaluation of extent of disease, 21% (24 of 112) for high-risk screening, 39% (18 of 46) for problem solving, and 33% (two of six) for short-term follow-up. PPV3 was significantly lower in the screening category than in the rest of the indication groups (χ2 = 21.7, P < .001).
Table 1.
Characteristics of 175 Nonmalignant Lesions
Note.—Data in parentheses are percentages. Percentages may not add up to 100% owing to rounding.
Not upgraded at excision.
ADC Measurements
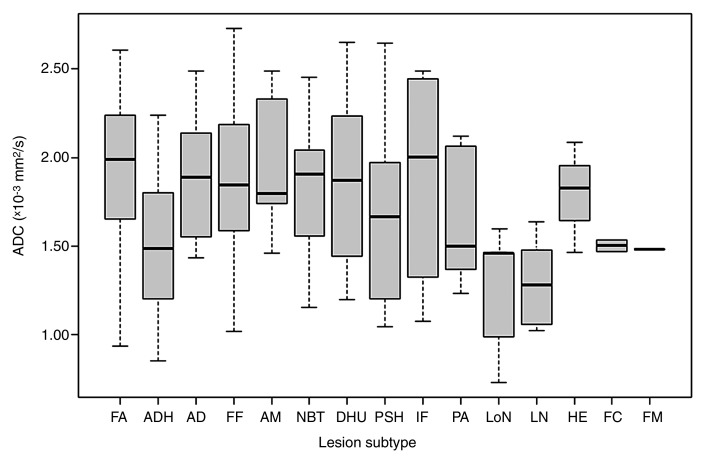
ADCs were measured for all nonmalignant lesions (Fig 2, Table 2), and the mean ADC overall ([1.77 ± 0.45] × 10−3 mm2/sec) was significantly lower than that of normal fibroglandular tissue ([2.13 ± 0.39] × 10−3 mm2/sec; P < .0001). Subtypes with the highest mean ADCs were apocrine metaplasia ([2.01 ± 0.38] × 10−3 mm2/sec), inflammation ([1.95 ± 0.46] × 10−3 mm2/sec), fibroadenoma ([1.94 ± 0.38] × 10−3 mm2/sec), and focal fibrosis ([1.84 ± 0.48] × 10−3 mm2/sec), while the those with the lowest mean ADCs were lymph nodes ([1.28 ± 0.23] × 10−3 mm2/sec), lobular neoplasia ([1.34 ± 0.51] × 10−3 mm2/sec), fibromatosis (1.46 × 10⁻³ mm2/sec), and ADH ([1.48 ± 0.36] × 10−3 mm2/sec) (Fig 3). A statistically significant difference in mean ADC among subtypes was identified with the Kruskal-Wallis test (P = .006). In pairwise comparisons, only ADH and fibroadenoma demonstrated significant differences in ADC after sequential Holm-Bonferroni corrections (P = .0003, corrected α = .00047).
Figure 2:
Graph shows ADCs of nonmalignant breast lesions. Box plots show median and range of ADCs for each subtype in the order of frequency. AD = adenosis, AM = apocrine metaplasia, DHU = usual ductal hyperplasia, FA = fibroadenoma, FC = fibrocystic change, FF = focal fibrosis, FM = fibromatosis, HE = hemangioma, IF = inflammation, LN = lymph node, LoN = lobular neoplasia, NBT = normal breast tissue, PA = papilloma, PSH = pseudoangiomatous stromal hyperplasia.
Table 2.
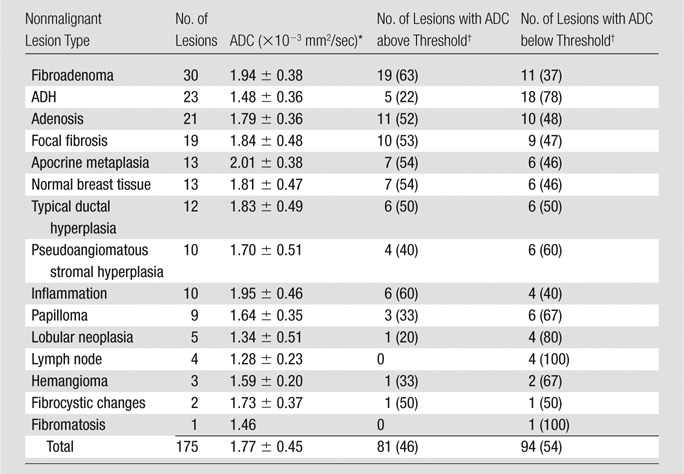
Mean ADCs of Nonmalignant Lesions in Relation to ADC Threshold
Data are mean ± standard deviation.
The ADC threshold was 1.81 × 10⁻³ mm2/sec. Data in parentheses are percentages.
Figure 3a:
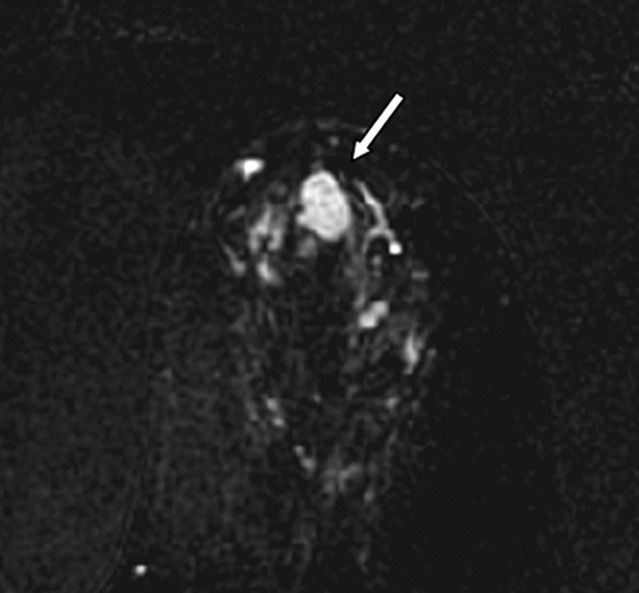
Images in 61-year-old woman with personal history of right-breast ductal carcinoma in situ. The patient underwent breast MR imaging for high-risk screening. (a) Axial dynamic contrast-enhanced initial postcontrast subtraction MR image shows 13-mm lobular heterogeneously enhancing mass (arrow) in the subareolar region of the left breast, 16 mm from the nipple. The lesion has a smooth margin and is at an anterior depth. This lesion was classified as BI-RADS category 4. On (b) an axial dynamic contrast-enhanced MR image, the lesion (arrow) shows mixed kinetics overall: 28% delayed persistent enhancement (blue), 34% delayed plateau (green), and 38% delayed washout (red). The lesion (arrow) is hypointense on (c) an axial T2-weighted MR image. The lesion (arrow) is hyperintense on (d) axial DW image and has a low ADC (mean, 1.06 × 10⁻³ mm2/sec) on (e) an ADC map. Insets in d and e = ROIs. The lesion was classified as ADH on the basis of (f) US-guided core biopsy results, which showed intraductal papilloma and ductal hyperplasia with focal atypia with no evidence of invasive carcinoma. (Hematoxylin-eosin stain; original magnification, ×200.) No evidence of carcinoma was detected at excisional biopsy.
Figure 3b:
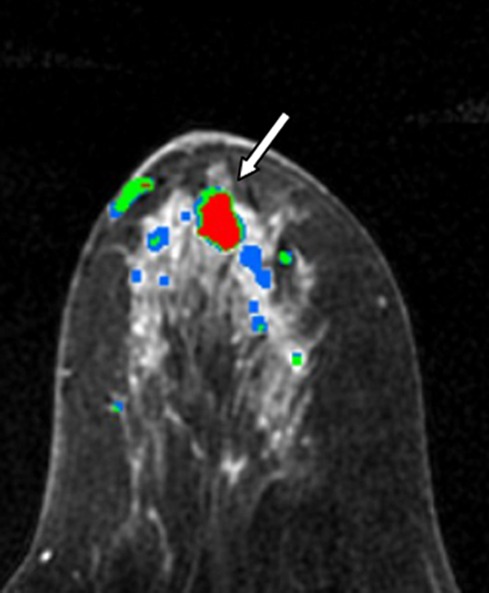
Images in 61-year-old woman with personal history of right-breast ductal carcinoma in situ. The patient underwent breast MR imaging for high-risk screening. (a) Axial dynamic contrast-enhanced initial postcontrast subtraction MR image shows 13-mm lobular heterogeneously enhancing mass (arrow) in the subareolar region of the left breast, 16 mm from the nipple. The lesion has a smooth margin and is at an anterior depth. This lesion was classified as BI-RADS category 4. On (b) an axial dynamic contrast-enhanced MR image, the lesion (arrow) shows mixed kinetics overall: 28% delayed persistent enhancement (blue), 34% delayed plateau (green), and 38% delayed washout (red). The lesion (arrow) is hypointense on (c) an axial T2-weighted MR image. The lesion (arrow) is hyperintense on (d) axial DW image and has a low ADC (mean, 1.06 × 10⁻³ mm2/sec) on (e) an ADC map. Insets in d and e = ROIs. The lesion was classified as ADH on the basis of (f) US-guided core biopsy results, which showed intraductal papilloma and ductal hyperplasia with focal atypia with no evidence of invasive carcinoma. (Hematoxylin-eosin stain; original magnification, ×200.) No evidence of carcinoma was detected at excisional biopsy.
Figure 3c:
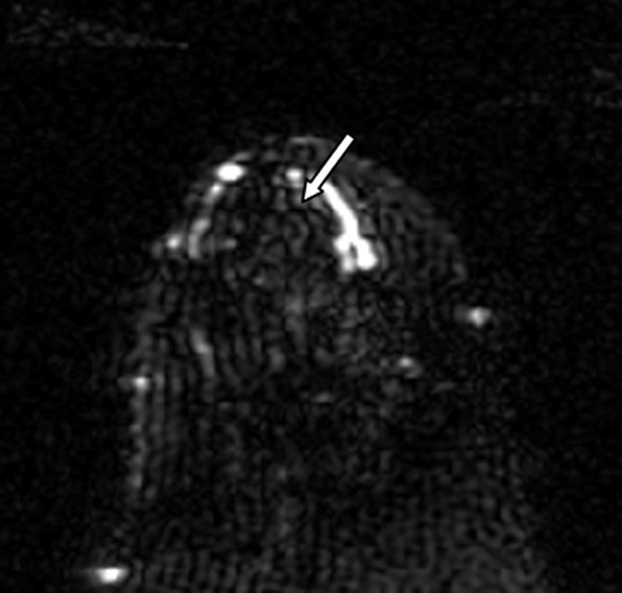
Images in 61-year-old woman with personal history of right-breast ductal carcinoma in situ. The patient underwent breast MR imaging for high-risk screening. (a) Axial dynamic contrast-enhanced initial postcontrast subtraction MR image shows 13-mm lobular heterogeneously enhancing mass (arrow) in the subareolar region of the left breast, 16 mm from the nipple. The lesion has a smooth margin and is at an anterior depth. This lesion was classified as BI-RADS category 4. On (b) an axial dynamic contrast-enhanced MR image, the lesion (arrow) shows mixed kinetics overall: 28% delayed persistent enhancement (blue), 34% delayed plateau (green), and 38% delayed washout (red). The lesion (arrow) is hypointense on (c) an axial T2-weighted MR image. The lesion (arrow) is hyperintense on (d) axial DW image and has a low ADC (mean, 1.06 × 10⁻³ mm2/sec) on (e) an ADC map. Insets in d and e = ROIs. The lesion was classified as ADH on the basis of (f) US-guided core biopsy results, which showed intraductal papilloma and ductal hyperplasia with focal atypia with no evidence of invasive carcinoma. (Hematoxylin-eosin stain; original magnification, ×200.) No evidence of carcinoma was detected at excisional biopsy.
Figure 3d:
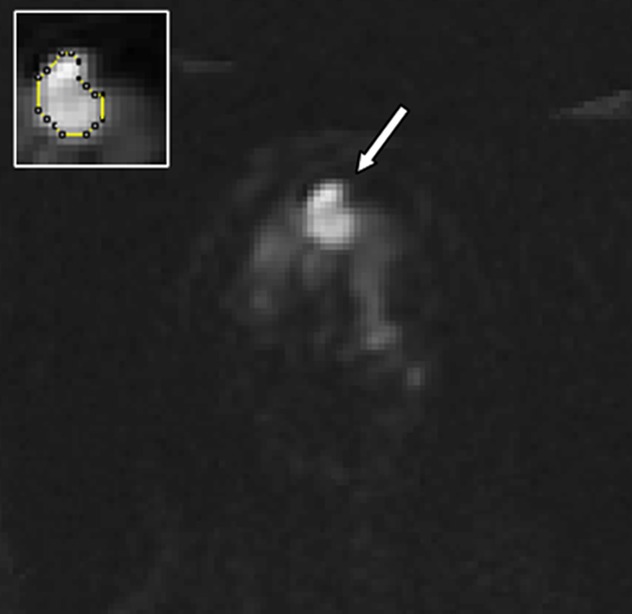
Images in 61-year-old woman with personal history of right-breast ductal carcinoma in situ. The patient underwent breast MR imaging for high-risk screening. (a) Axial dynamic contrast-enhanced initial postcontrast subtraction MR image shows 13-mm lobular heterogeneously enhancing mass (arrow) in the subareolar region of the left breast, 16 mm from the nipple. The lesion has a smooth margin and is at an anterior depth. This lesion was classified as BI-RADS category 4. On (b) an axial dynamic contrast-enhanced MR image, the lesion (arrow) shows mixed kinetics overall: 28% delayed persistent enhancement (blue), 34% delayed plateau (green), and 38% delayed washout (red). The lesion (arrow) is hypointense on (c) an axial T2-weighted MR image. The lesion (arrow) is hyperintense on (d) axial DW image and has a low ADC (mean, 1.06 × 10⁻³ mm2/sec) on (e) an ADC map. Insets in d and e = ROIs. The lesion was classified as ADH on the basis of (f) US-guided core biopsy results, which showed intraductal papilloma and ductal hyperplasia with focal atypia with no evidence of invasive carcinoma. (Hematoxylin-eosin stain; original magnification, ×200.) No evidence of carcinoma was detected at excisional biopsy.
Figure 3e:
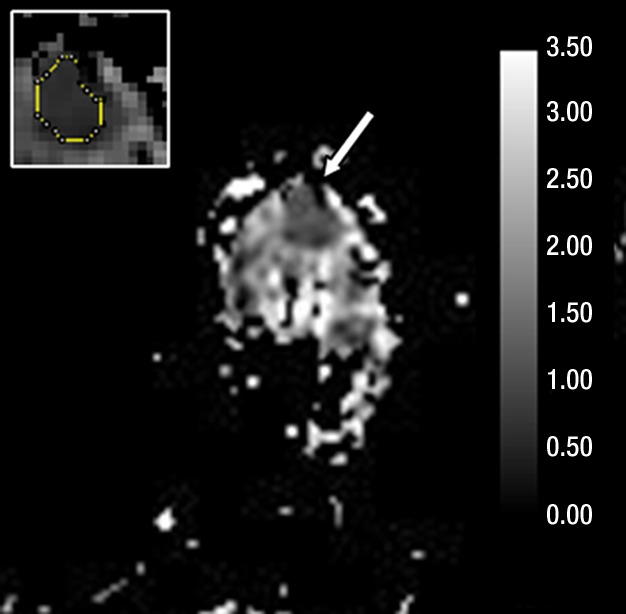
Images in 61-year-old woman with personal history of right-breast ductal carcinoma in situ. The patient underwent breast MR imaging for high-risk screening. (a) Axial dynamic contrast-enhanced initial postcontrast subtraction MR image shows 13-mm lobular heterogeneously enhancing mass (arrow) in the subareolar region of the left breast, 16 mm from the nipple. The lesion has a smooth margin and is at an anterior depth. This lesion was classified as BI-RADS category 4. On (b) an axial dynamic contrast-enhanced MR image, the lesion (arrow) shows mixed kinetics overall: 28% delayed persistent enhancement (blue), 34% delayed plateau (green), and 38% delayed washout (red). The lesion (arrow) is hypointense on (c) an axial T2-weighted MR image. The lesion (arrow) is hyperintense on (d) axial DW image and has a low ADC (mean, 1.06 × 10⁻³ mm2/sec) on (e) an ADC map. Insets in d and e = ROIs. The lesion was classified as ADH on the basis of (f) US-guided core biopsy results, which showed intraductal papilloma and ductal hyperplasia with focal atypia with no evidence of invasive carcinoma. (Hematoxylin-eosin stain; original magnification, ×200.) No evidence of carcinoma was detected at excisional biopsy.
Figure 3f:
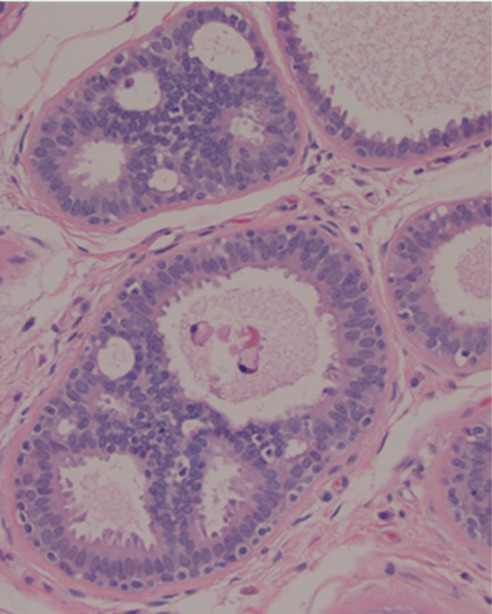
Images in 61-year-old woman with personal history of right-breast ductal carcinoma in situ. The patient underwent breast MR imaging for high-risk screening. (a) Axial dynamic contrast-enhanced initial postcontrast subtraction MR image shows 13-mm lobular heterogeneously enhancing mass (arrow) in the subareolar region of the left breast, 16 mm from the nipple. The lesion has a smooth margin and is at an anterior depth. This lesion was classified as BI-RADS category 4. On (b) an axial dynamic contrast-enhanced MR image, the lesion (arrow) shows mixed kinetics overall: 28% delayed persistent enhancement (blue), 34% delayed plateau (green), and 38% delayed washout (red). The lesion (arrow) is hypointense on (c) an axial T2-weighted MR image. The lesion (arrow) is hyperintense on (d) axial DW image and has a low ADC (mean, 1.06 × 10⁻³ mm2/sec) on (e) an ADC map. Insets in d and e = ROIs. The lesion was classified as ADH on the basis of (f) US-guided core biopsy results, which showed intraductal papilloma and ductal hyperplasia with focal atypia with no evidence of invasive carcinoma. (Hematoxylin-eosin stain; original magnification, ×200.) No evidence of carcinoma was detected at excisional biopsy.
High-Risk versus Benign Subtypes
Mean ADCs for the 28 high-risk lesions ([1.46 ± 0.39] × 10−3 mm2/sec) were significantly lower than those for the 147 benign lesions ([1.83 ± 0.43] × 10−3 mm2/sec; P < .0001; corrected α = .025). Comparison with ADCs of malignant lesions (obtained in a prior study of suspicious MR imaging–detected lesions [20]) showed a trend of decreasing mean ADC from benign to high-risk to malignant lesion types (Fig 1).
Implementing a Diagnostic ADC Threshold
Of the 175 benign and high-risk false-positive lesions at dynamic contrast-enhanced MR imaging, 81 (46%) exhibited ADCs that were above the 1.81 × 10⁻³ mm2/sec threshold (Table 2). The most common lesion subtypes with ADCs above the threshold were fibroadenoma (19 [63%] of 30), adenosis (11 [52%] of 21), and focal fibrosis (10 [53%] of 19); these lesions comprised 49% of the lesions with ADCs above the threshold. On the other hand, the most common lesion subtypes with ADCs below the threshold were ADH (18 [78%] of 23), fibroadenoma (11 [37%] of 30), and adenosis (10 [48%] of 21); these lesions comprised 41% of lesions with ADCs below the threshold. Examples of nonmalignant lesions exhibiting ADCs above and those exhibiting ADCs below the threshold are shown in Figures E1–E4 (online). Only five lesions with ADCs above the threshold were given an assessment of BI-RADS category 5 in the MR imaging reports. These lesions included three cases of usual ductal hyperplasia, one fibroadenoma, and one focal fibrosis. High-risk lesions were only 16% of all false-positive findings but made up 23% of all nonmalignant lesions with ADCs below the threshold: Twenty-two (79%) of 28 high-risk lesions had ADCs below the threshold.
Stratifying results according to clinical indication and patient age revealed no significant differences in the percentage of lesions with ADCs above the threshold (χ2 = 0.9 and P = .8 and χ2 = 0.3 and P = .6, respectively).
Intra- and Interobserver Variability
For a subset of 30 consecutive lesions, the average absolute difference between the analysis dataset (SP1) ADC measurements and a second measurement by the same reader (SP2) was 0.12 × 10⁻³ mm2/sec (range, 0.005–0.450 × 10⁻³ mm2/sec). The average absolute difference between the ADC measurements of SP1 and MLO was 0.14 × 10⁻³ mm2/sec (range, 0.002–0.450 × 10⁻³ mm2/sec). Bland-Altman plots (Fig E5 [online]) showed no systematic bias or relationship between ADCs and the magnitude of measurement error. There were also no significant differences between SP1 and SP2 (P = .78) and between SP1 and MLO (P = .22) according to the Wilcoxon signed-rank test. Intraobserver agreement in ADC measurements according to the CCC was 0.91 (95% confidence interval: 0.83, 0.96), and the CCC for the interobserver agreement between the SP1 and the MLO ADC measurements was 0.90 (95% confidence interval: 0.80, 0.95). Although reproducibility was high according to the CCC, classification changes across the 1.81 × 10⁻³ mm2/sec threshold occurred between readers. Of 14 lesions classified as having ADCs greater than 1.81 × 10⁻³ mm2/sec by SP1, one lesion (focal fibrosis) was reclassified having an ADC below the threshold at the SP2 analysis. Compared with SP1, MLO reclassified three lesions as having ADCs below the threshold (one hemangioma, one case of apocrine metaplasia, and the same case of focal fibrosis) and one lesion (a case of apocrine metaplasia) as having an ADC above the threshold.
Discussion
Previous studies (12,14,19,22–26,35) have shown promising differences in ADCs between malignant and nonmalignant breast lesions and improved diagnostic accuracy through a multivariate combination of ADC and dynamic contrast-enhanced MR imaging features (18,20,36,38). Despite the potential advantages of DW imaging for breast imaging, substantial overlap exists between ADCs of malignant and nonmalignant lesions. We sought to better characterize the ability of DW imaging to help discriminate among false-positive lesions identified at dynamic contrast-enhanced MR imaging and identify the nonmalignant subtypes most responsible for the overlap with malignant ADCs. We found that among the most common false-positive lesion types, high-risk lesions (ADH and lobular neoplasia) exhibited significantly lower mean ADCs than benign lesions and accounted for the most common false-positive MR imaging finding after implementing the ADC threshold.
Malignant lesions with high ADCs and nonmalignant lesions with low ADCs present challenges for implementing a diagnostic ADC threshold. As reported by Woodhams et al (39), mucinous carcinomas typically show high ADCs because of their characteristic mucin pools with lower cell density and higher extracellular water content. To date, to our knowledge, there are limited data as to the subtypes of nonmalignant lesions that exhibit lower ADCs. Results of prior studies (19,40,41) suggest that papillomas and lymph nodes are two benign lesion types that frequently show restricted diffusion; this is attributed to their higher cellularity. This was confirmed by our findings, with the majority of papillomas and all lymph nodes in our study exhibiting ADCs below the ADC threshold. It is important to note that in general, most lymph nodes demonstrate characteristic features at MR imaging (eg, fatty hila, reniform shape, high T2 signal), allowing the radiologist to identify them as definitively benign; thus, most lymph nodes would not be eligible for our study. The nodes that were included in our study appeared as suspicious masses at MR imaging and did not demonstrate the typical appearance of nodes at either MR imaging or subsequent US. Furthermore, we identified a number of other nonmalignant lesion subtypes that exhibit restricted diffusion, particularly high-risk lesions. The below-threshold ADCs of most high-risk lesions are not surprising owing to their histologic similarity to malignant lesions.
By far, the majority of nonmalignant lesions reported in prior DW imaging studies were fibroadenomas and fibrocystic changes (12,19,22,36,42,43). Fibroadenomas are generally presumed to have higher ADCs because of stromal myxoid change and consequent higher water mobility (24). This was confirmed by the relatively high ADC of the majority of fibroadenomas in our study; however, we also found that fibroadenoma represented the second most common dynamic contrast-enhanced MR imaging false-positive lesion subtype with ADCs below the threshold. Predominance of the fibrous component has been given as possible cause of low ADCs in these lesions (22). ADC measurements are affected by the size and density distribution of cells, features that may be heterogeneous even within a lesion. Combined with the fact that the majority of nonmalignant lesions in our study had mixed histologic findings, this may explain the variability of ADCs observed in each subtype category. The lower number of fibrocystic change lesions in our study than in previous studies is related to our categorization approach. The term fibrocystic change encompasses a heterogeneous group of histologic findings (44), and in our study this term was used only when a specific subtype was not evident at histologic examination.
We further evaluated many other subtypes that proved to be false-positive findings at dynamic contrast-enhanced MR imaging—subtypes that have not been commonly reported in prior DW imaging studies. The spectrum of nonmalignant lesions in our study represents false-positive findings detected primarily in high-risk women (40%) and in women with a recent cancer diagnosis (51%), and our results may be specific to these populations. It must also be noted that breast MR imaging performance varies by clinical indication (in our study, the dynamic contrast-enhanced MR imaging PPV3 for high-risk screening was lower than that for the other clinical indications), as well as between different centers and with reader experience. Therefore, the added value of DW imaging must be further studied in larger multicenter trials.
The mean ADC for nonmalignant lesions was (1.77 ± 0.45) × 10−3 mm2/sec, which compares well with that in prior reports (18,20). In our study, 81 (46%) of 175 nonmalignant lesions had ADCs greater than the 1.81 × 10⁻³ mm2/sec threshold at which biopsy could have potentially been avoided. This could have resulted in substantial savings in time and patient discomfort, particularly as 62 of the 81 above-threshold lesions required the more costly and time-intensive MR imaging–guided biopsy procedure. While the ADC threshold we used (1.81 × 10⁻³ mm2/sec) was determined for maximal sensitivity in a prior study (20), other investigators who used MR imaging with similar b values have suggested a lower ADC threshold of 1.6 × 10⁻³ mm2/sec (18,35) to optimize both sensitivity and specificity. Applying this alternate ADC threshold in the present study would have increased the number of lesions with ADCs above the threshold to 110 (63%), potentially sparing additional biopsies. It is important to note that the use of this lower threshold could result in a tradeoff of more malignant lesions with ADCs above the threshold (false-negative findings), and therefore the higher threshold may be more clinically desirable. The true incremental gain of adding DW imaging to dynamic contrast-enhanced MR imaging is yet to be studied in a large multicenter trial.
Repeated measurements in a consecutive subgroup of lesions demonstrated good intra- and interobserver repeatability. There was slightly better agreement between measurements performed by the same observer (CCC = 0.91 and mean absolute difference = 0.12 × 10⁻³ mm2/sec) than between measurements performed by different observers (CCC = 0.90 and mean absolute difference = 0.14 × 10⁻³ mm2/sec); this was most likely due to subjective differences between observers in ROI placement. More automated lesion pixel selection techniques could help reduce subjectivity and further reduce variability in DW imaging measurements.
Our study had limitations. The goal of our study was to assess the DW imaging characteristics of nonmalignant lesions and to estimate the number of false-positive findings that could be avoided by using a previously determined ADC threshold. Therefore, our study does not provide information on calculating the performance of the ADC threshold in terms of sensitivity and specificity, which would require also measuring ADCs for all malignant lesions over the same time period. The difference between the ADCs of malignant lesions and those of other lesion types (Fig 1) may be over- or underestimated, as only a consecutive subset of all malignancies in the study time frame (31 [19%] of 164 lesions) were represented. In addition, the decision to avoid biopsy for lesions that were positive at dynamic contrast-enhanced MR imaging and negative at DW imaging cannot be entirely supported on the basis of the results of our study. While our study shows that DW imaging provides complementary diagnostic information to dynamic contrast-enhanced MR imaging, further studies are required to determine how best to incorporate ADC measurements into clinical breast MR imaging interpretations.
The exclusion of 31% of eligible lesions for logistic and technical reasons related to DW imaging (DW imaging not performed in 20% and DW imaging misregistration issues in 11%) may have introduced selection bias toward patients who were more tolerant of extended imaging times to accommodate the additional DW imaging study. It is unclear how this may have affected our study findings; however, no selection bias was identified with respect to clinical indications, due to exclusion of these lesions. DW imaging misregistration issues can potentially be avoided in future studies by performing DW imaging earlier during the MR imaging examination, improving patient comfort to reduce motion, and employing alternative pulse sequences or postprocessing techniques to reduce eddy current distortions (45–47). The low spatial resolution of DW imaging could affect the accuracy of lesion ADC measurements owing to partial volume averaging. Imaging was performed at 1.5 T; increased DW imaging resolution (with thinner sections) achievable at higher field strengths may better depict small or diffuse lesions through reduced partial volume averaging and higher contrast-to-noise ratio (48). In vivo ADC measures are influenced by the degree and number of diffusion sensitizations (b values) applied during DW imaging (49–52). Therefore, ADC ranges for nonmalignant lesions obtained in our study at b = 600 sec/mm2 may not be the same as those obtained by using higher, lower, or multiple b values, and ADC threshold values should be interpreted with caution depending on the approach. However, it has been shown that the diagnostic performance of quantitative breast DW imaging is not affected by the choice of different b values or the use of multiple versus two b values (53,54). DW imaging was performed approximately 10 minutes after injection of a gadolinium-based contrast agent during the dynamic contrast-enhanced MR imaging study. While several studies reported negligible effects of contrast agent on ADC measurements (14,55–57), there have been conflicting reports on this topic (58,59), and this factor should also be considered when comparing our results with other studies.
In summary, our findings show promise for using DW imaging to improve the specificity of breast MR imaging. DW imaging helped successfully characterize 46% of nonmalignant breast lesions assessed as false-positive findings at dynamic contrast-enhanced MR imaging as benign on the basis of ADCs above a previously determined diagnostic threshold. The ability of DW imaging to help differentiate high-risk lesions requiring additional work-up from other nonmalignant lesion subtypes may further improve patient care. Assessing ADC along with dynamic contrast-enhanced MR imaging features may decrease the number of false-positive MR imaging findings and contribute to improved radiologic-pathologic concordance for particular nonmalignant lesion subtypes sampled for biopsy. Further work is necessary to validate these findings in prospective trials.
Advances in Knowledge.
• Forty-six percent of nonmalignant breast lesions assessed as false-positive findings at dynamic contrast-enhanced MR imaging had apparent diffusion coefficients (ADCs) higher than a previously determined diagnostic threshold (1.81 × 10⁻³ mm2/sec).
• Fibroadenomas were the most common false-positive finding at dynamic contrast-enhanced MR imaging (17%) and typically demonstrated high mean ADCs ([1.94 ± 0.38] × 10−3 mm2/sec).
• High-risk lesions were the most common nonmalignant lesion types with mean ADCs below the threshold ([1.46 ± 0.39] × 10−3 mm2/sec) and accounted for 23% of the overlap with malignant lesions.
Implications for Patient Care.
• Our findings show promise for using diffusion-weighted imaging to reduce the number of avoidable false-positive findings at breast dynamic contrast-enhanced MR imaging; improving the specificity of breast MR imaging would reduce the number of avoidable biopsies and associated morbidity for the patient.
• Assessing ADC along with dynamic contrast-enhanced MR imaging features can contribute to improved radiologic-pathologic concordance for particular nonmalignant lesion subtypes sampled for biopsy.
Disclosures of Conflicts of Interest: S.P. No relevant conflicts of interest to disclose. H.R. No relevant conflicts of interest to disclose. K.H.A. No relevant conflicts of interest to disclose. W.B.D. Financial activities related to the present article: none to disclose. Financial activities not related to the present article: has received a grant from Philips Medical Systems. Other relationships: none to disclose. M.L.O. No relevant conflicts of interest to disclose. C.D.L. Financial activities related to the present article: none to disclose. Financial activities not related to the present article: is a consultant for Philips, GE Healthcare, and Bayer; institution has grants or grants pending with GE Healthcare; has received, and institution has received, payment from GE Healthcare for development of educational presentations. Other relationships: none to disclose. S.C.P. Financial activities related to the present article: none to disclose. Financial activities not related to the present article: has received a grant from Philips Medical Systems. Other relationships: none to disclose.
Supplementary Material
Acknowledgments
The authors appreciate the contribution of Brenda F. Kurland, PhD, Assistant Member in Clinical Statistics, Fred Hutchinson Cancer Research Center, to the statistical analysis and interpretation of data in the manuscript.
Received December 22, 2011; revision requested February 1, 2012; revision received April 25; accepted May 7; final version accepted May 31.
Funding: This research was supported by the National Institutes of Health (grant R01-CA151326).
Abbreviations:
- ADC
- apparent diffusion coefficient
- ADH
- atypical ductal hyperplasia
- ALH
- atypical lobular hyperplasia
- BI-RADS
- Breast Imaging Reporting and Data System
- CCC
- concordance correlation coefficient
- DW
- diffusion weighted
- LCIS
- lobular carcinoma in situ
- PPV3
- positive predictive value 3
References
- 1.Kriege M, Brekelmans CT, Boetes C, et al. Efficacy of MRI and mammography for breast-cancer screening in women with a familial or genetic predisposition. N Engl J Med 2004;351(5):427–437 [DOI] [PubMed] [Google Scholar]
- 2.Lehman CD, Isaacs C, Schnall MD, et al. Cancer yield of mammography, MR, and US in high-risk women: prospective multi-institution breast cancer screening study. Radiology 2007;244(2):381–388 [DOI] [PubMed] [Google Scholar]
- 3.Saslow D, Boetes C, Burke W, et al. American Cancer Society guidelines for breast screening with MRI as an adjunct to mammography. CA Cancer J Clin 2007;57(2):75–89 [DOI] [PubMed] [Google Scholar]
- 4.Warner E, Plewes DB, Hill KA, et al. Surveillance of BRCA1 and BRCA2 mutation carriers with magnetic resonance imaging, ultrasound, mammography, and clinical breast examination. JAMA 2004;292(11):1317–1325 [DOI] [PubMed] [Google Scholar]
- 5.Berg WA, Gutierrez L, NessAiver MS, et al. Diagnostic accuracy of mammography, clinical examination, US, and MR imaging in preoperative assessment of breast cancer. Radiology 2004;233(3):830–849 [DOI] [PubMed] [Google Scholar]
- 6.Hollingsworth AB, Stough RG, O’Dell CA, Brekke CE. Breast magnetic resonance imaging for preoperative locoregional staging. Am J Surg 2008;196(3):389–397 [DOI] [PubMed] [Google Scholar]
- 7.Lehman CD, Gatsonis C, Kuhl CK, et al. MRI evaluation of the contralateral breast in women with recently diagnosed breast cancer. N Engl J Med 2007;356(13):1295–1303 [DOI] [PubMed] [Google Scholar]
- 8.Schnall MD, Blume J, Bluemke DA, et al. MRI detection of distinct incidental cancer in women with primary breast cancer studied in IBMC 6883. J Surg Oncol 2005;92(1):32–38 [DOI] [PubMed] [Google Scholar]
- 9.Kuhl CK. Current status of breast MR imaging. II. Clinical applications. Radiology 2007;244(3):672–691 [DOI] [PubMed] [Google Scholar]
- 10.Kuhl C. The current status of breast MR imaging. I. Choice of technique, image interpretation, diagnostic accuracy, and transfer to clinical practice. Radiology 2007;244(2):356–378 [DOI] [PubMed] [Google Scholar]
- 11.Baltzer PA, Dietzel M, Vag T, et al. Clinical MR mammography: impact of hormonal status on background enhancement and diagnostic accuracy. Rofo 2011;183(5):441–447 [DOI] [PubMed] [Google Scholar]
- 12.Guo Y, Cai YQ, Cai ZL, et al. Differentiation of clinically benign and malignant breast lesions using diffusion-weighted imaging. J Magn Reson Imaging 2002;16(2):172–178 [DOI] [PubMed] [Google Scholar]
- 13.Tozaki M, Fukuma E. 1H MR spectroscopy and diffusion-weighted imaging of the breast: are they useful tools for characterizing breast lesions before biopsy? AJR Am J Roentgenol 2009;193(3):840–849 [DOI] [PubMed] [Google Scholar]
- 14.Rubesova E, Grell AS, De Maertelaer V, Metens T, Chao SL, Lemort M. Quantitative diffusion imaging in breast cancer: a clinical prospective study. J Magn Reson Imaging 2006;24(2):319–324 [DOI] [PubMed] [Google Scholar]
- 15.Woodhams R, Matsunaga K, Kan S, et al. ADC mapping of benign and malignant breast tumors. Magn Reson Med Sci 2005;4(1):35–42 [DOI] [PubMed] [Google Scholar]
- 16.Hatakenaka M, Soeda H, Yabuuchi H, et al. Apparent diffusion coefficients of breast tumors: clinical application. Magn Reson Med Sci 2008;7(1):23–29 [DOI] [PubMed] [Google Scholar]
- 17.Lo GG, Ai V, Chan JK, et al. Diffusion-weighted magnetic resonance imaging of breast lesions: first experiences at 3 T. J Comput Assist Tomogr 2009;33(1):63–69 [DOI] [PubMed] [Google Scholar]
- 18.Partridge SC, Demartini WB, Kurland BF, Eby PR, White SW, Lehman CD. Differential diagnosis of mammographically and clinically occult breast lesions on diffusion-weighted MRI. J Magn Reson Imaging 2010;31(3):562–570 [DOI] [PubMed] [Google Scholar]
- 19.Yabuuchi H, Matsuo Y, Okafuji T, et al. Enhanced mass on contrast-enhanced breast MR imaging: lesion characterization using combination of dynamic contrast-enhanced and diffusion-weighted MR images. J Magn Reson Imaging 2008;28(5):1157–1165 [DOI] [PubMed] [Google Scholar]
- 20.Partridge SC, DeMartini WB, Kurland BF, Eby PR, White SW, Lehman CD. Quantitative diffusion-weighted imaging as an adjunct to conventional breast MRI for improved positive predictive value. AJR Am J Roentgenol 2009;193(6):1716–1722 [DOI] [PubMed] [Google Scholar]
- 21.Le Bihan D, Turner R, Douek P, Patronas N. Diffusion MR imaging: clinical applications. AJR Am J Roentgenol 1992;159(3):591–599 [DOI] [PubMed] [Google Scholar]
- 22.Kinoshita T, Yashiro N, Ihara N, Funatu H, Fukuma E, Narita M. Diffusion-weighted half-Fourier single-shot turbo spin echo imaging in breast tumors: differentiation of invasive ductal carcinoma from fibroadenoma. J Comput Assist Tomogr 2002;26(6):1042–1046 [DOI] [PubMed] [Google Scholar]
- 23.Marini C, Iacconi C, Giannelli M, Cilotti A, Moretti M, Bartolozzi C. Quantitative diffusion-weighted MR imaging in the differential diagnosis of breast lesion. Eur Radiol 2007;17(10):2646–2655 [DOI] [PubMed] [Google Scholar]
- 24.Sinha S, Lucas-Quesada FA, Sinha U, DeBruhl N, Bassett LW. In vivo diffusion-weighted MRI of the breast: potential for lesion characterization. J Magn Reson Imaging 2002;15(6):693–704 [DOI] [PubMed] [Google Scholar]
- 25.Wenkel E, Geppert C, Schulz-Wendtland R, et al. Diffusion weighted imaging in breast MRI: comparison of two different pulse sequences. Acad Radiol 2007;14(9):1077–1083 [DOI] [PubMed] [Google Scholar]
- 26.Woodhams R, Matsunaga K, Iwabuchi K, et al. Diffusion-weighted imaging of malignant breast tumors: the usefulness of apparent diffusion coefficient (ADC) value and ADC map for the detection of malignant breast tumors and evaluation of cancer extension. J Comput Assist Tomogr 2005;29(5):644–649 [DOI] [PubMed] [Google Scholar]
- 27.Yoshikawa MI, Ohsumi S, Sugata S, et al. Relation between cancer cellularity and apparent diffusion coefficient values using diffusion-weighted magnetic resonance imaging in breast cancer. Radiat Med 2008;26(4):222–226 [DOI] [PubMed] [Google Scholar]
- 28.Partridge SC, Ziadloo A, Murthy R, et al. Diffusion tensor MRI: preliminary anisotropy measures and mapping of breast tumors. J Magn Reson Imaging 2010;31(2):339–347 [DOI] [PubMed] [Google Scholar]
- 29.Partridge SC, Mullins CD, Kurland BF, et al. Apparent diffusion coefficient values for discriminating benign and malignant breast MRI lesions: effects of lesion type and size. AJR Am J Roentgenol 2010;194(6):1664–1673 [DOI] [PubMed] [Google Scholar]
- 30.Park MJ, Cha ES, Kang BJ, Ihn YK, Baik JH. The role of diffusion-weighted imaging and the apparent diffusion coefficient (ADC) values for breast tumors. Korean J Radiol 2007;8(5):390–396 [DOI] [PMC free article] [PubMed] [Google Scholar]
- 31.Kim SH, Cha ES, Kim HS, et al. Diffusion-weighted imaging of breast cancer: correlation of the apparent diffusion coefficient value with prognostic factors. J Magn Reson Imaging 2009;30(3):615–620 [DOI] [PubMed] [Google Scholar]
- 32.Lyng H, Haraldseth O, Rofstad EK. Measurement of cell density and necrotic fraction in human melanoma xenografts by diffusion weighted magnetic resonance imaging. Magn Reson Med 2000;43(6):828–836 [DOI] [PubMed] [Google Scholar]
- 33.Sugahara T, Korogi Y, Kochi M, et al. Usefulness of diffusion-weighted MRI with echo-planar technique in the evaluation of cellularity in gliomas. J Magn Reson Imaging 1999;9(1):53–60 [DOI] [PubMed] [Google Scholar]
- 34.Partridge SC, Rahbar H, Murthy R, et al. Improved diagnostic accuracy of breast MRI through combined apparent diffusion coefficients and dynamic contrast-enhanced kinetics. Magn Reson Med 2011;65(6):1759–1767 [DOI] [PMC free article] [PubMed] [Google Scholar]
- 35.Ei Khouli RH, Jacobs MA, Mezban SD, et al. Diffusion-weighted imaging improves the diagnostic accuracy of conventional 3.0-T breast MR imaging. Radiology 2010;256(1):64–73 [DOI] [PMC free article] [PubMed] [Google Scholar]
- 36.Kul S, Cansu A, Alhan E, Dinc H, Gunes G, Reis A. Contribution of diffusion-weighted imaging to dynamic contrast-enhanced MRI in the characterization of breast tumors. AJR Am J Roentgenol 2011;196(1):210–217 [DOI] [PubMed] [Google Scholar]
- 37.Ikeda DM, Hylton NM, Kuhl CK, et al. BI-RADS: magnetic resonance imaging. In: D’Orsi CJ, Mendelson EB, Ikeda DM, et al., eds. Breast Imaging Reporting and Data System: ACR BI-RADS – Breast Imaging Atlas. Reston, Va: American College of Radiology, 2003 [Google Scholar]
- 38.Satake H, Nishio A, Ikeda M, et al. Predictive value for malignancy of suspicious breast masses of BI-RADS categories 4 and 5 using ultrasound elastography and MR diffusion-weighted imaging. AJR Am J Roentgenol 2011;196(1):202–209 [DOI] [PubMed] [Google Scholar]
- 39.Woodhams R, Kakita S, Hata H, et al. Diffusion-weighted imaging of mucinous carcinoma of the breast: evaluation of apparent diffusion coefficient and signal intensity in correlation with histologic findings. AJR Am J Roentgenol 2009;193(1):260–266 [DOI] [PubMed] [Google Scholar]
- 40.Heusner TA, Kuemmel S, Koeninger A, et al. Diagnostic value of diffusion-weighted magnetic resonance imaging (DWI) compared to FDG PET/CT for whole-body breast cancer staging. Eur J Nucl Med Mol Imaging 2010;37(6):1077–1086 [DOI] [PubMed] [Google Scholar]
- 41.Nakai G, Matsuki M, Harada T, et al. Evaluation of axillary lymph nodes by diffusion-weighted MRI using ultrasmall superparamagnetic iron oxide in patients with breast cancer: initial clinical experience. J Magn Reson Imaging 2011;34(3):557–562 [DOI] [PubMed] [Google Scholar]
- 42.Belli P, Costantini M, Bufi E, Magistrelli A, La Torre G, Bonomo L. Diffusion-weighted imaging in breast lesion evaluation. Radiol Med (Torino) 2010;115(1):51–69 [DOI] [PubMed] [Google Scholar]
- 43.Imamura T, Isomoto I, Sueyoshi E, et al. Diagnostic performance of ADC for non-mass-like breast lesions on MR imaging. Magn Reson Med Sci 2010;9(4):217–225 [DOI] [PubMed] [Google Scholar]
- 44.Love SM, Gelman RS, Silen W. Sounding board: fibrocystic “disease” of the breast—a nondisease? N Engl J Med 1982;307(16):1010–1014 [DOI] [PubMed] [Google Scholar]
- 45.Le Bihan D, Poupon C, Amadon A, Lethimonnier F. Artifacts and pitfalls in diffusion MRI. J Magn Reson Imaging 2006;24(3):478–488 [DOI] [PubMed] [Google Scholar]
- 46.Mukherjee P, Chung SW, Berman JI, Hess CP, Henry RG. Diffusion tensor MR imaging and fiber tractography: technical considerations. AJNR Am J Neuroradiol 2008;29(5):843–852 [DOI] [PMC free article] [PubMed] [Google Scholar]
- 47.Zhuang J, Hrabe J, Kangarlu A, et al. Correction of eddy-current distortions in diffusion tensor images using the known directions and strengths of diffusion gradients. J Magn Reson Imaging 2006;24(5):1188–1193 [DOI] [PMC free article] [PubMed] [Google Scholar]
- 48.Matsuoka A, Minato M, Harada M, et al. Comparison of 3.0-and 1.5-tesla diffusion-weighted imaging in the visibility of breast cancer. Radiat Med 2008;26(1):15–20 [DOI] [PubMed] [Google Scholar]
- 49.Melhem ER, Itoh R, Jones L, Barker PB. Diffusion tensor MR imaging of the brain: effect of diffusion weighting on trace and anisotropy measurements. AJNR Am J Neuroradiol 2000;21(10):1813–1820 [PMC free article] [PubMed] [Google Scholar]
- 50.Woodhams R, Ramadan S, Stanwell P, et al. Diffusion-weighted imaging of the breast: principles and clinical applications. RadioGraphics 2011;31(4):1059–1084 [DOI] [PubMed] [Google Scholar]
- 51.Koh DM, Collins DJ. Diffusion-weighted MRI in the body: applications and challenges in oncology. AJR Am J Roentgenol 2007;188(6):1622–1635 [DOI] [PubMed] [Google Scholar]
- 52.Jin G, An N, Jacobs MA, Li K. The role of parallel diffusion-weighted imaging and apparent diffusion coefficient (ADC) map values for evaluating breast lesions: preliminary results. Acad Radiol 2010;17(4):456–463 [DOI] [PMC free article] [PubMed] [Google Scholar]
- 53.Peters NH, Vincken KL, van den Bosch MA, Luijten PR, Mali WP, Bartels LW. Quantitative diffusion weighted imaging for differentiation of benign and malignant breast lesions: the influence of the choice of b-values. J Magn Reson Imaging 2010;31(5):1100–1105 [DOI] [PubMed] [Google Scholar]
- 54.Pereira FP, Martins G, Figueiredo E, et al. Assessment of breast lesions with diffusion-weighted MRI: comparing the use of different b values. AJR Am J Roentgenol 2009;193(4):1030–1035 [DOI] [PubMed] [Google Scholar]
- 55.Chen G, Jespersen SN, Pedersen M, Pang Q, Horsman MR, Stødkilde-Jørgensen H. Intravenous administration of Gd-DTPA prior to DWI does not affect the apparent diffusion constant. Magn Reson Imaging 2005;23(5):685–689 [DOI] [PubMed] [Google Scholar]
- 56.Fitzek C, Mentzel HJ, Fitzek S, Sauner D, Kaiser WA, Reichenbach JR. Echoplanar diffusion-weighted MRI with intravenous gadolinium-DTPA. Neuroradiology 2003;45(9):592–597 [DOI] [PubMed] [Google Scholar]
- 57.Ogura A, Hayakawa K, Miyati T, Maeda F. The effect of susceptibility of gadolinium contrast media on diffusion-weighted imaging and the apparent diffusion coefficient. Acad Radiol 2008;15(7):867–872 [DOI] [PubMed] [Google Scholar]
- 58.Liu X, Zhou L, Peng W, Qian M. Effect of intravenous gadolinium-DTPA on diffusion-weighted imaging for prostate lesions and normal tissue at 3.0-Tesla magnetic resonance imaging. Acta Radiol 2011;52(5):575–580 [DOI] [PubMed] [Google Scholar]
- 59.Yuen S, Yamada K, Goto M, Nishida K, Takahata A, Nishimura T. Microperfusion-induced elevation of ADC is suppressed after contrast in breast carcinoma. J Magn Reson Imaging 2009;29(5):1080–1084 [DOI] [PubMed] [Google Scholar]
Associated Data
This section collects any data citations, data availability statements, or supplementary materials included in this article.


