Abstract
Background
Pictorial health warning labels on cigarette packaging have been proposed for the U.S., but their potential influences among populations that suffer tobacco-related health disparities are unknown.
Purpose
To evaluate pictorial health warning labels, including moderation of their influences by health literacy and race.
Methods
From July 2011 to January 2012, field experiments were conducted with 981 adult smokers who were randomized to control (i.e., text-only labels, n=207) and experimental conditions (i.e., pictorial labels, n=774). The experimental condition systematically varied health warning label stimuli by health topic and image type. Linear mixed effects (LME) models estimated the influence of health warning label characteristics and participant characteristics on label ratings. Data were analyzed from January 2012 to April 2012.
Results
Compared to text-only warning labels, pictorial warning labels were rated as more personally relevant (5.7 vs 6.8, p<0.001) and effective (5.4 vs 6.8, p<0.001), and as more credible, but only among participants with low health literacy (7.6 vs 8.2, p<0.001). Within the experimental condition, pictorial health warning labels with graphic imagery had significantly higher ratings of credibility, personal relevance, and effectiveness than imagery of human suffering and symbolic imagery. Significant interactions indicated that labels with graphic imagery produced minimal differences in ratings across racial groups and levels of health literacy, whereas other imagery produced greater group differences.
Conclusions
Pictorial health warning labels with graphic images have the most-pronounced short-term impacts on adult smokers, including smokers from groups that have in the past been hard to reach.
Introduction
Numerous studies have demonstrated that prominent health warning labels with pictorial imagery are more effective than text-only labels in engaging smokers, increasing knowledge about risks, promoting thoughts about quitting, and decreasing demand for cigarettes.1–11 As of 2011, a total of 39 countries have implemented pictorial health warning labels.12 The U.S. was scheduled for implementation in 2012, but tobacco industry litigation has delayed implementation. To inform future label policy development and implementation, more data are needed on U.S. consumer responses to various label content.13 The current study addresses this issue, while focusing on responses among smokers from populations that bear a disproportionate burden of tobacco-related disease.14–18
Since 1985, the U.S. has had four text-only messages that appear on one side of cigarette packages. The 2009 Family Smoking Prevention and Tobacco Control Act (FSPTA) gave the U.S. Food and Drug Administration regulatory authority over health warning labels, including the selection of content. In line with WHO recommendations,19 these labels are to cover 50% of the front and back of each cigarette package, and include nine unique combinations of text and image. The 2009 FSPTA stipulates that the labels be changed on a recurring basis in an effort to minimize “wear out” of their impacts due to repeated exposure to the same messages.20
Smoking is increasingly concentrated in lower-SES groups,17,18 where health literacy is relatively low.17,21 Among populations with basic or lower literacy, communication that involves pictures is more effective than text only.22,23 Most of the research on health literacy, however, has focused on communication involving personal interaction (e.g., the clinical encounter),24–26 not communication involving only print media.
Nevertheless, studies on text-only labeling of foods and medications indicate that populations with low literacy and numeracy find it difficult to understand.27–30 Efforts to promote pictorial labels for tobacco products emphasize their greater potential impact compared to textual labels among low-literacy populations,2 although this has not been directly tested. Nevertheless, the inverse association between educational attainment and responses to pictorial labels supports this contention,31 although this inverse association has not always been found.11
The specific type of pictorial health warning label content that works best is understudied, although some studies suggest that graphic imagery works best.13,32,33 For example, compared to Uruguayan smokers, whose pictorial labels included more-abstract imagery (e.g., a bomb to represent pending disease), Brazilian smokers exposed to pictorial labels with graphic imagery reported more-frequent thoughts about smoking-related risks, about quitting, and refrained from smoking more often because of these labels.31 Experiments with adult smokers and youth in the U.S. and Mexico are consistent with these findings.10,34–37 However, the U.S.-based research to evaluate specific content of pictorial labels has relied on young adult college students32 and online consumer panels36,37 and which under-represent lower-SES groups that have higher smoking rates and low health literacy.38
This paper presents results from a field experiment with a randomized design to assess whether adult smokers from lower-SES groups rated pictorial health warning labels as relatively more credible, personally relevant and effective than current, text-only labels used in the U.S. Further, pictorial labels were systematically varied to assess whether graphic imagery was associated with higher ratings than imagery of human suffering and symbolic imagery. Finally, moderation of these influences by health literacy and race were examined, to determine whether study manipulations produced stronger impacts among black smokers than white smokers and among smokers with low compared to high health literacy.
Methods
Sample and Protocol
From July 2011 to January 2012, in-person field experiments were conducted with a convenience sample of 981 adult smokers recruited from public places (e.g., supermarkets, flea markets, sporting events) in low- and middle-income areas across the three main regions of South Carolina. This intercept survey method is standard for marketing research.39,40 Current daily smokers who had smoked 100 or more cigarettes in their lifetimes were eligible to participate. Eligible participants provided a brief, informed oral consent before beginning the protocol. A computer algorithm was used to randomize participants to control or experimental conditions at a 1:4 ratio. The IRB at the University of South Carolina gave approval for this study.
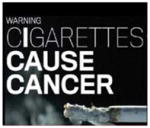
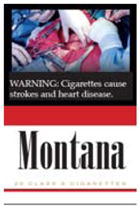
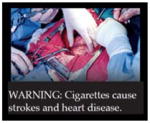
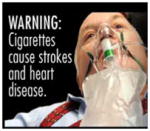
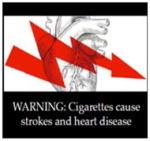
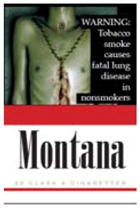
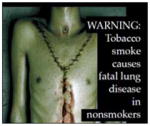
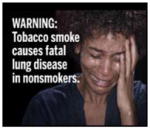
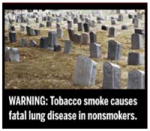
Cigarette packages were printed with health warning labels designed for this study. In the control condition, stimuli represented the four current text-only labels in the U.S., and participants were exposed to and rated each of the four label messages presented in counterbalanced order (see measurement). In the experimental condition, participants evaluated nine different pictorial label stimuli (Table 2) in a 3 × 3 within-subjects design. Experimental-group participants evaluated three stimuli for each of three health topics with messages slated for implementation on U.S. health warning labels: (1) Smoking causes cancer; (2) Smoking causes stroke and heart disease; (3) Tobacco smoke causes fatal lung disease in nonsmokers.
Table 2.
Mean ratings of health warning labels in control and experimental conditions
| Control condition – text-only label on 50% of one lateral side | Totals | |||||
|---|---|---|---|---|---|---|
| Textual content |

|
Smoking causes Lung Cancer, Heart Disease, Emphysema and May Complicate Pregnancy | Smoking by pregnant Women May Result In Fetal Injury, Premature Birth, and Low Birth Weight | Cigarette Smoke Contains Carbon Monoxide | Quitting Smoking Now Greatly Reduces Serious Risks to Your Health | |
|
| ||||||
| Mean (SD) ratings | Credibility | 7.87 (0.03) | 7.87 (0.03) | 7.87 (0.03) | 7.87 (0.03) | 7.50 (0.11) |
| Relevance | 5.66 (0.13) | 5.64 (0.04) | 6.64 (0.13 | 6.83(0.04) | 5.66 (0.13) | |
| Effectiveness | 5.36 (0.12) | 5.36 (0.12) | 5.34 (0.12) | 5.36 (0.12) | 5.36 (0.12) | |
| Experimental condition - pictorial label on 50% of front and back
| |||||
|---|---|---|---|---|---|
| Image type | Graphic | Human suffering | Symbolic | ||
| Health topic: Cancer |
|
|
|
|
|
|
| |||||
| Mean (SD) ratings | Credibility | 8.69 (0.08) | 8.68 (0.08) | 7.89 (0.07) | 8.13 (0.06) |
| Relevance | 8.00 (0.10) | 7.11 (0.10) | 6.58 (0.09) | 7.05 (0.07) | |
| Effectiveness | 8.04 (0.09) | 7.74 (0.10) | 6.45 (0.08) | 6.98 (0.06) | |
|
| |||||
| Health topic: Cardiovascular disease |
|
|
|
|
|
|
| |||||
| Mean (SD) ratings | Credibility | 8.42 (0.09) | 8.33 (0.09) | 6.41 (0.12) | 7.72 (0.06) |
| Relevance | 7.38 (0.11) | 7.19 (0.11) | 5.22 (0.13) | 6.60 (0.07) | |
| Effectiveness | 7.38 (0.10) | 7.19 (0.10) | 5.10 (0.12) | 6.56 (0.07) | |
|
| |||||
| Health topic: Secondhand smoke |
|
|
|
|
|
|
| |||||
| Mean (SD) ratings | Credibility | 8.64 (0.08) | 6.97 (0.12) | 7.68 (0.11) | 7.76 (0.06) |
| Relevance | 8.08 (0.10) | 6.05 (0.12) | 6.39 (0.12) | 6.84 (0.07) | |
| Effectiveness | 8.11 (0.09) | 5.91 (0.12) | 6.28 (0.12) | 6.77 (0.07) | |
|
| |||||
| Total mean ratings by image type | Graphic | Human suffering | Symbolic | Grand mean for pictorials | |
| Credibility | 8.58 (0.05) | 7.99 (0.06) | 7.05 (0.08) | 7.87 (0.03) | |
| Relevance | 7.82 (0.06) | 6.98 (0.07) | 5.81 (0.09) | 6.83 (0.04) | |
| Effectiveness | 7.84 (0.05) | 6.95 (0.06) | 5.69 (0.08) | 6.77 (0.04) | |
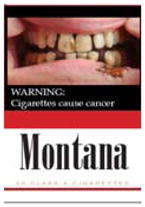
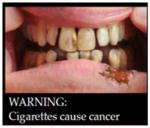
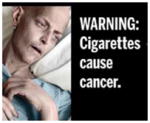
Within each health topic, participants evaluated all three possible image types: (1) gruesome imagery of diseased organs; (2) human suffering from smoking-related disease; (3) abstract or symbolic representation of the disease (e.g., tombstone for death). (A further manipulation of cues to action was included and counterbalanced within each image type, but is reported in another study.) Label stimulus presentation was counterbalanced within and across health topics, with all participants in the experimental condition evaluating nine distinct label stimuli that included all three image types for each of the three health topics.
Measurement
Participant characteristics
Participants reported their gender, age, race/ethnicity, educational attainment, and household income. The average number of cigarettes per day was classified into four categories (i.e., <6/day; 6–10/day; 11–19/day; ≥20/day). Participants indicated whether they had stopped smoking for at least 1 day when trying to quit during the previous year. Participants’ quit intention in the next month involved a validated question with response options ranging from 1 to 10 and with verbal anchors at either end (i.e., not at all and extremely).41,42
Health literacy was evaluated using the Newest Vital Sign or NVS,43,44 which is a six-question screening test of both prose and numeric comprehension of a Nutrition Facts label on an ice cream container. Results correlate well with validated, more-extensive health literacy assessments, such as the Test of Functional Health Literacy in Adults.45 Following recommendations,43 a cut-point of three or fewer correct responses was used as being indicative of low health literacy.
Health warning label ratings
Interviewers presented the participants with label stimuli in random order and, for each label, read out loud to participants a series of descriptive phrases about the warning, for which participants rated their response using a 1–10 response scale with verbal anchors (i.e., not at all and extremely). Descriptive phrases assessed credibility (i.e., “The health warning label is believable”), personal relevance (i.e., “The health warning label speaks to people like you”) and perceived effectiveness, which was assessed with three indicators (i.e., “The health warning label makes you concerned about the health risks of smoking”; “The health warning label makes you think about quitting”; “Overall, how effective is the warning?”) that had high internal consistency reliability (alpha=0.94) and were averaged to form a single scale.
Health warning label characteristics
Label characteristics were coded using dummy variables to indicate control versus experimental group. Within the pictorial label group, dummy variables were created to express contrasts by health topics (i.e., cancer; CVD; secondhand smoke as the reference) and imagery type (i.e., symbolic imagery; imagery of human suffering; graphic imagery as the reference category).
Data Analysis
All analyses were conducted using STATA 11.0. Differences between the experimental and control groups were assessed using t-tests and chi-square tests. Linear mixed effects (LME) models were used to estimate the main and interactive effects of label characteristics and participant characteristics on ratings of label stimuli, which allowed adjustment for intra-individual correlation due to repeated assessments.46 LME models were estimated separately for each of the three rating variables (i.e., credibility, personal relevance, effectiveness).
The first phase of analyses involved comparing ratings between the control and experimental conditions, estimating both the bivariate and adjusted associations, adjusting for person-characteristics (i.e., sociodemographics, smoking-related variables). Next, interactions between experimental condition (control=0; experimental group=1) and both race (white=0; black=1) and health literacy (high=0 vs low=1) were assessed by including multiplicative interaction terms within the adjusted models. Further analyses limited the analytic sample to the experimental group, wherein models were estimated to determine the bivariate and adjusted associations between ratings and both person characteristics and pictorial label characteristics (i.e., health topic, image type) on ratings.
Afterward, estimates were made of adjusted models that included multiplicative interactions between the label image type (graphic=reference group; symbolic=dummy variable; human suffering=dummy variable) and health literacy (high=0 vs low=1). Also estimated were models including interactions between label image type and race (white=0; black=1). When interactions were significant (p<0.05), mean ratings were examined for label pictorial type by either health literacy level or race.
Results
The study population was 59% female; 47% identified as white and 44% as black, and 43% of the sample was aged <30 years (Table 1). The recruitment strategy succeeded in enrolling a lower-SES population, as evidenced by 47% with a household income of ≤$25,000 per year, 47% with a high school education or less, and 63% with low health literacy according to the NVS. No differences were found between the experimental (n=774) and control groups (n=207).
Table 1.
Sample sociodemographics, health literacy, and smoking-related characteristics
| Sample characteristics | Experiment | Control | Total | |
|---|---|---|---|---|
| % (n=774) | % (n=207) | % (n=981) | ||
| Gender | Female | 59 (455) | 58 (120) | 59 (575) |
| Male | 41 (319) | 42 (87) | 41 (406) | |
|
| ||||
| Age, years | 18 to 21 | 18 (139) | 20 (41) | 18 (180) |
| 22 to 29 | 26 (200) | 21 (44) | 25 (244) | |
| 30 to 39 | 19 (149) | 15 (32) | 19 (181) | |
| 40 to 49 | 17 (132) | 22 (46) | 18 (178) | |
| 50 and older | 20 (153) | 21 (44) | 20 (197) | |
|
| ||||
| Race/ethnicity | White | 46 (354) | 49 (102) | 47 (456) |
| Black/African-American | 46 (353) | 41 (84) | 44 (437) | |
| Hispanic/Latino | 6 (48) | 7 (14) | 6 (62) | |
| American Indian | 2 (15) | 2 (4) | 2 (19) | |
| Other | 4 (32) | 2 (4) | 4 (36) | |
|
| ||||
| Household Income, $ | Less than $10,000 | 13 (102) | 7 (15) | 12 (117) |
| $10,000 –$15,000 | 22 (170) | 21 (44) | 22 (214) | |
| $15,000 –$25,000 | 14 (108) | 15 (30) | 14 (138) | |
| $25,000 –$35,000 | 14 (111) | 15 (31) | 15 (142) | |
| $35,000 –$45,000 | 12 (94) | 14 (29) | 13 (123) | |
| $45,000–$55,000 | 7 (50) | 10 (20) | 7 (70) | |
| $55,000–$75,000 | 6 (48) | 5 (11) | 6 (59) | |
| $75,000–$95,000 | 8 (57) | 6 (13) | 7 (70) | |
| >95,000 | 3 (19) | 4 (8) | 3 (27) | |
| No Response | 2 (15) | 3 (6) | 2 (21) | |
|
| ||||
| Educational attainment | Less than high school | 15 (119) | 9 (18) | 14 (137) |
| High school or GED complete | 33 (253) | 35 (72) | 33 (325) | |
| Technical/vocational school | 7 (56) | 9 (18) | 8 (74) | |
| University (incomplete) | 34 (260) | 36 (74) | 34 (334) | |
| University (complete) | 10 (77) | 11 (22) | 10 (99) | |
| Postgraduate | 2 (8) | 2 (3) | 1 (11) | |
|
| ||||
| Health literacy | Low (0–3) | 63 (490) | 64 (125) | 63 (615) |
| High (4–6) | 37 (284) | 40 (82) | 37 (366) | |
|
| ||||
| Cigarettes per day | 5 or fewer | 14 (111) | 14 (29) | 14 (140) |
| 6–10 | 32 (247) | 33 (69) | 32 (316) | |
| 11–19 | 14 (107) | 15 (31) | 14 (138) | |
| 20 or more | 40 (309) | 38 (78) | 40 (387) | |
|
| ||||
| Intention to quit | Average of next month (range: 1–10) | 4.2 (0.03) | 4.4 (0.10) | 4.3 |
|
| ||||
| Tried to quit in last year | Yes | 43 (336) | 49(102) | 45 (438) |
| No | 57 (438) | 51 (105) | 55 (543) | |
Label Ratings: Control Versus Experimental Condition
Mean ratings of health warning labels were lower for the control condition (i.e., text-only labels) than for the experimental condition (i.e., pictorial labels), whether assessed for credibility (7.50 vs 7.87; p=0.03); personal relevance (5.66 vs 6.83; p<0.001); or effectiveness (5.36 vs. 6.77; p<0.001; Table 2). In adjusted models, the significance of the association was maintained for personal relevance (B=1.06, p<0.001) and effectiveness (B=1.28, p<0.001), but it became marginally nonsignificant for credibility (B=0.31; p=0.06).
Subsequent models testing for interactions between race and condition were not significant, and the interaction between condition and health literacy produced significant results only when predicting ratings of label credibility (B= −0.09, p=0.04). Post hoc assessment of mean ratings of credibility indicated no significant difference across experimental and control groups among high-literacy participants (7.37 vs 7.39, respectively; p=0.92); however, among participants with low health literacy, pictorial labels in the experimental condition were rated as more credible than the text-only labels in the control condition (7.58 vs 8.15, respectively; p<0.001).
Pictorial Label Rating: Main Effects of Label Characteristics Within the Experimental Group
Within the experimental group alone, pictorial health warning labels with the graphic imagery type consistently had higher mean ratings than either imagery of human suffering or symbolic imagery (Table 2). In both bivariate and adjusted LME models (Table 3), labels with imagery of human suffering and symbolic imagery were rated as less credible than graphic imagery (Badj= − 0.20, p=0.009; Badj= −1.14, p<0.001, respectively); less personally-relevant than graphic imagery (Badj= −0.27, p<0.001; Badj= −1.50, p<0.001, respectively) and less effective than graphic imagery (Badj= −0.26, p<0.001; Badj= −1.59, p<0.001, respectively).
Table 3.
Health warning label ratings by condition and by pictorial label characteristics
| Independent variables | Credibility | Relevance | Effectiveness | ||||||||||
|---|---|---|---|---|---|---|---|---|---|---|---|---|---|
| Bivariate | Adjusteda | Bivariate | Adjusteda | Bivariate | Adjusteda | ||||||||
| B | (SE) | B | (SE) | B | (SE) | B | (SE) | B | (SE) | B | (SE) | ||
| Condition | Control | ref | ref | ref | ref | ref | ref | ||||||
| Experiment | 0.37 | (0.17)* | 0.31 | (0.17) | 1.17 | (0.20)*** | 1.06 | (0.19)*** | 1.41 | (0.20)*** | 1.28 | (0.18)*** | |
|
| |||||||||||||
|
Pictorial label characteristicsb
| |||||||||||||
| Image type | Graphic | ref | ref | ref | ref | ref | ref | ||||||
| Human suffering | −0.34 | (0.07)*** | −0.20 | (0.06)** | −0.24 | (0.07)*** | −0.27 | (0.07)*** | −0.23 | (0.06)*** | −0.26 | (0.06)*** | |
| Symbolic | −1.78 | (0.07)*** | −1.14 | (0.08)*** | −1.41 | (0.07)*** | −1.50 | (0.08)*** | −1.48 | (0.07)*** | −1.59 | (0.07)*** | |
|
| |||||||||||||
| Health topic | 2ndhand smoke | ref | ref | 0 | ref | ref | ref | ref | |||||
| Cancer | 0.17 | (0.07)* | 0.00 | (0.07) | 0.22 | (0.07)*** | 0.29 | (0.08)*** | 0.22 | (0.07)*** | 0.31 | (0.07)*** | |
| CVD | −0.18 | (0.07)* | −0.03 | (0.06) | −0.24 | (0.07)*** | −0.25 | (0.07)*** | −0.21 | (0.07)*** | −0.21 | (0.06)*** | |
All adjusted models control for age, gender, race, income, education, health literacy, cigarettes per day, intention to quit, and quit attempt in the previous year. Adjusted models associated with pictorial health warning label characteristics also adjusted for label-characteristic variables shown in the table. Adjusted models for control versus experimental group included 979 participants, as two participants were dropped due to missing data.
Models assessing pictorial label characteristics were estimated with data from the experimental group only (n=774 for bivariate analyses and n=772 for adjusted analyses, as two observations were dropped due to missing data).
p<0.05;
p<0.01;
p<0.001
Moderation of Pictorial Label Credibility, Relevance, and Effectiveness by Health Literacy and Race Within the Experimental Group
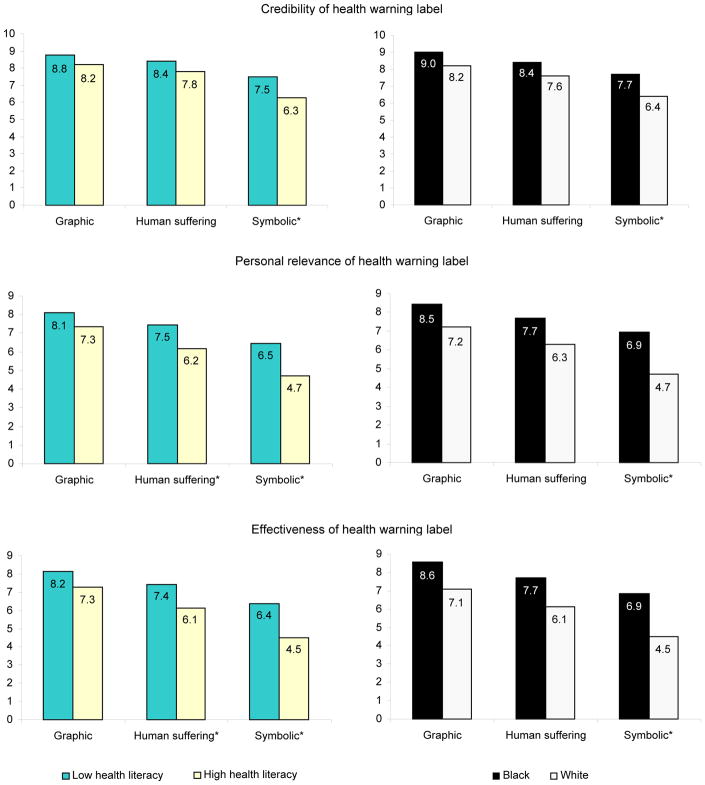
A series of adjusted LME models were estimated limiting analyses to data from the experimental condition alone, with the inclusion of interactions between health literacy and image type, as well as between race and image type. Across models for all three rating outcomes, significant interactions were found. That is, for suffering versus graphic imagery, the interaction with literacy was significant for credibility (B=0.25, SE=0.13, p=0.048); relevance (B=0.47, SE=0.14, p=0.001); and effectiveness (B=0.33, SE=0.12, p=0.009). For symbolic versus graphic imagery, the interaction with literacy was significant for credibility (B=0.75, SE=0.16, p<0.001); relevance (B=0.63, SE=0.16, p<0.001), and effectiveness (B=0.71, SE=0.16, p<0.001).
There were similar interactions between race and imagery type (Figure 1). For symbolic versus graphic imagery, the interaction with race was significant for credibility (B=0.35, SE=0.15, p=0.019); relevance (B=0.59, SE=0.16, p<0.001); and effectiveness (B=0.47, SE=0.15, p<0.001). However, for suffering versus graphic imagery, there were no interactions with race for any rating. Graphic pictorial labels were not only most highly rated across high– and low–health literacy groups and across black and white smokers, but the differences in ratings across these groups were minimized. Pictorial labels with symbolic imagery produced the greatest difference in ratings across these groups, with particularly low ratings among high–health literacy participants and white participants.
Figure 1.
Ratings of pictorial health warning label image types by literacy level and race * interactions statistically significant (p<0.05) for graphic vs symbolic imagery by literacy level and by race (not for graphic vs. human suffering imagery).
Discussion
Study results provide further evidence for the greater effectiveness of pictorial health warning labels compared to text-only labels among adult smokers. Study results are consistent with observational studies of smokers across countries whose policies contrast on these characteristics,1,3,7 experimental economic studies among adults smokers in the U.S.,11 focus groups with young adults in the U.S.,6,9 and similar experimental studies with online samples of adult smokers and youth in the U.S.10,37 and with convenience samples in Mexico.34 The current study suggests that the greater impact of pictorial health warning labels over text-only labels generalizes to smokers from lower SES groups in the U.S. who have been less-well represented in previous studies. These results suggest that the U.S. FDA should implement pictorial health warning labels instead of the current, text-only labels that have been on cigarette packs since 1985.
The current study also provides evidence of the specific content of pictorial health warning labels that is likely to work best. Smokers rated pictorial labels with graphic imagery as more credible, personally relevant and effective than pictorial labels with imagery of human suffering or symbolic imagery. The greater impact of graphic and human suffering imagery over symbolic imagery has been found in previous cross-sectional survey research31 and experimental research.34 The tobacco industry has argued that the FDA’s proposed imagery is not real and involves emotional appeals instead of the simple transmission of risk information. However, smokers in the present study rated the graphic imagery as more credible, personally relevant and effective than either textual content or alternative imagery that could be used in its place.
The FDA has a mandate to use pictorial health warning labels to enhance consumer understanding of the magnitude and personal relevance of smoking-related risks, which includes redressing the tobacco industry’s long history of purposeful misinformation regarding tobacco product risks.47,48 The current study suggests that graphic pictorial labels will produce the greatest and most-consistent impact across subpopulations of smokers, regardless of health- literacy level or race. Nevertheless, future research should address the long-term effectiveness of graphic imagery as smokers habituate to pictorial labels through frequent exposure in naturalistic settings.
With regard to their topical content, pictorial health warning labels regarding cancer were rated more strongly than those for secondhand smoke (SHS), which, in turn, were rated more strongly than those for cardiovascular disease (CVD). These results were somewhat surprising given the relatively lower awareness of smoking’s influence on CVD than on cancer5 and the fact that messages with novel information are generally more effective than those with less-novel information.49 However, these unexpected findings may be due to participants’ greater focus on the image over the topic.
The graphic imagery used for cancer and SHS were more easily identifiable than that used for CVD, and their suffering imagery involved white and black women, which was more aligned with the race and gender of the study population than the image of an older white male in the CVD suffering imagery. The potential influence of this kind of matching should provide a focus for future research. It is important to implement multiple pictorial labels on varying topics in order to express the range of smoking-related risks, while updating the imagery and messages in order to minimize the impacts of habituation.1
The present study provided the first direct test of the hypothesis that pictorial health warning labels work better than text-only labels among people with low health literacy. Ratings of the personal relevance and effectiveness of pictorial labels compared to textual labels were no different for smokers in high– compared to low–health literacy groups. However, smokers with low health literacy rated pictorial labels as more credible than text-only warnings, whereas no difference was found among smokers with high health literacy.
Interactions between type of pictorial labels and both race and health literacy were also significant, indicating that graphic pictorial labels minimized differences between health literacy and racial groups, whereas symbolic imagery produced the greatest differences in ratings between these groups. Ratings provided by white smokers and high–health literacy smokers were more sensitive to the type of pictorial label imagery, providing particularly low ratings for symbolic imagery. Nevertheless, graphic pictorial imagery was rated as most effective across these groups and appears most likely to have a broad influence on the population compared to other imagery, particularly symbolic imagery. These results suggest that the FDA should consider using more graphic imagery, as only one of the three graphic images tested in this study was selected by the FDA for the first round of pictorial labels.
Limitations
The current study results should be interpreted in light of some limitations. First, the study involved a single, forced exposure to health warning labels, which differs substantially from prolonged, naturalistic exposure. However, to enhance the fidelity of exposure, participants were recruited from public settings around places where cigarettes were sold, and label stimuli were presented on printed cigarette packages with brand imagery and the weight of a normal pack. The consistency of the results with other observational and experimental studies, particularly those regarding the greater impact of pictorial labels over text-only labels, provides evidence of convergent validity; nevertheless, future research should cross-validate self-report data with other data, such as fMRI and other biomarkers and behavioral indicators of label influences. Future research should also assess various strategies to stave off “wear out” and maximize label impacts, including optimal rotation frequencies for implementing new pictorial label content.
Other potential limitations concern differences in the textual content and number of warnings in the experimental and control conditions. The textual content of current U.S. warnings used for the control condition included less-direct language than the pictorial labels (e.g., Smoking may cause… versus Cigarettes cause…). The more-direct language used for the pictorial labels may explain some of the differences found; however, other research that has used the same text on both pictorial and text-only warnings has found similar results.36,50
Further, participants in the control group were exposed to relatively fewer stimuli than those in the experimental group (four vs nine, respectively) although the directionality of any bias resulting from these differences is unclear. Nevertheless, the randomized order of stimulus presentation should have helped minimize any bias, as any particular stimulus was just as likely to be evaluated early as to be evaluated late in the presentation order. Finally, the study protocol did not involve manipulating the concordance between participant demographics (i.e., gender, race) and the demographics of individuals depicted on labels. The impact of pictorial labels may be greater when the imagery is personally more salient to the smoker (i.e., demographically matched), although whether such concordance matters remains to be tested.
The convenience sample and recruitment strategies in this study may limit its external validity. However, this was purposeful as the project aimed to recruit less–highly educated smokers and smokers from minority groups that have been less-well represented in previous research in the U.S.10,36 Nevertheless, a sample with more smokers at higher-SES levels may have provided additional power for examining differential impacts of labels across educational and health literacy groups.
This study provides further evidence of the greater effectiveness of pictorial health warning labels compared to text-only labels, while suggesting that graphic imagery is likely to have the greatest population impact. Future research should focus on finding the best content, design and rotation strategies to maximize and sustain the influence of this cost-effective intervention.
Acknowledgments
This project was supported by the South Carolina Clinical & Translational Research Institute, with an academic home at the Medical University of South Carolina CTSA, NIH/NCRR Grant Number UL1RR029882. Dr. Carpenter was supported by a Career Development Award from the National Institute of Drug Abuse (K23 DA020482). Drs. Thrasher and Cummings were also partially supported by the U.S. National Cancer Institute (P01 CA138389 & R01 CA167067).
Footnotes
No financial disclosures were reported by the authors of this paper.
Publisher's Disclaimer: This is a PDF file of an unedited manuscript that has been accepted for publication. As a service to our customers we are providing this early version of the manuscript. The manuscript will undergo copyediting, typesetting, and review of the resulting proof before it is published in its final citable form. Please note that during the production process errors may be discovered which could affect the content, and all legal disclaimers that apply to the journal pertain.
References
- 1.Borland R, Wilson N, Fong GT, et al. Impact of graphic and text warnings on cigarette packs: Findings from four countries over five years. Tob Control. 2009;18:358–64. doi: 10.1136/tc.2008.028043. [DOI] [PMC free article] [PubMed] [Google Scholar]
- 2.Fong GT, Hammond D, Hitchman SC. The impact of graphic pictures on the effectiveness of tobacco health warnings. Bull World Health Organ. 2009;87:640–3. doi: 10.2471/BLT.09.069575. [DOI] [PMC free article] [PubMed] [Google Scholar]
- 3.Hammond D, Fong GT, Borland R, Cummings KM, McNeil AD, Driezen P. Text and graphic warnings on cigarette packages: Findings from the International Tobacco Control Four Country Study. Am J Prev Med. 2007;32(3):210–17. doi: 10.1016/j.amepre.2006.11.011. [DOI] [PMC free article] [PubMed] [Google Scholar]
- 4.Hammond D, Fong GT, MacDonald P, Cameron R, Brown K. Impact of graphic Canadian warning labels on adult smoking behavior. Tob Control. 2003;12:391–95. doi: 10.1136/tc.12.4.391. [DOI] [PMC free article] [PubMed] [Google Scholar]
- 5.Hammond D, Fong GT, McNeil A, Borland R, Cummings KM. Effectiveness of cigarette warning labels in informing smokers about the risks of smoking: Findings from the International Tobacco Control (ITC) Four Country Survey. Tob Control. 2006;15(Supp 3):iii19–25. doi: 10.1136/tc.2005.012294. [DOI] [PMC free article] [PubMed] [Google Scholar]
- 6.O’Hegarty M, Pederson LL, Nelson DE, Mowery P, Gable JM, Wortley P. Reactions of young adult smokers to warning labels on cigarette packages. Am J Prev Med. 2006;30(6):467–73. doi: 10.1016/j.amepre.2006.01.018. [DOI] [PubMed] [Google Scholar]
- 7.Thrasher JF, Rousu MC, Anaya-Ocampo R, Reynales-Shigematsu LM, Arillo-Santillán E, Hernández-Ávila M. Estimating the impact of graphic warning labels on cigarette packs: The auction method. Addict Behav. 2007;32(12):2916–15. doi: 10.1016/j.addbeh.2007.05.018. [DOI] [PubMed] [Google Scholar]
- 8.Thrasher JF, Hammond D, Fong GT, Arillo-Santillan E. Smokers’ reactions to cigarette package warnings with graphic imagery and with only text: A comparison between Mexico and Canada. Salud Pública Mex. 2007;49(Sup 2):S233–S40. doi: 10.1590/s0036-36342007000800013. [DOI] [PubMed] [Google Scholar]
- 9.O’Hegarty M, Pederson LL, Yenokyan G, Nelson DE, Wortley P. Young adults’ perceptions of cigarette warning labels in the U.S and Canada. Preventing Chronic Disease. 2007;4(2):A27. [PMC free article] [PubMed] [Google Scholar]
- 10.Bansal-Travers M, Hammond D, Smith P, Cummings KM. The impact of cigarette pack design, descriptors, and warning labels on risk perception in the U. S Am J Prev Med. 2011;40(6):674–82. doi: 10.1016/j.amepre.2011.01.021. [DOI] [PMC free article] [PubMed] [Google Scholar]
- 11.Thrasher JF, Rousu MC, Hammond D, Navarro A, Corrigan J. Estimating the impact of pictorial health warnings and “plain” cigarette packaging: Evidence from experimental auctions among adult smokers in the U. S Health Policy. 2011;102:41–48. doi: 10.1016/j.healthpol.2011.06.003. [DOI] [PubMed] [Google Scholar]
- 12.CCS. Cigarette package warning labels: International status report. Ottawa: Canadian Cancer Society; 2010. [Google Scholar]
- 13.Hammond D. Tobacco packaging and labeling policies under the U.S. Tobacco Control Act: research needs and priorities. Nicotine Tob Res. 2012;14(1):62–74. doi: 10.1093/ntr/ntr182. [DOI] [PMC free article] [PubMed] [Google Scholar]
- 14.Alberg A, Horner M-J, Daguise V, et al. Lung and bronchus cancer disparities in South Carolina: Epidemiology and strategies for prevention. J S C Med Assoc. 2006;102:183–91. [PubMed] [Google Scholar]
- 15.Nonemaker J, Garrett-Mayer E, Carpenter M, et al. The risk of dying from lung cancer by race: A prospective cohort study in a biracial cohort in Charleston, South Carolina. Ann Epidemiol. 2009;19:304–10. doi: 10.1016/j.annepidem.2008.12.017. [DOI] [PubMed] [Google Scholar]
- 16.Andrews JO, Felton G, Wewers M, Waller J, Tingen M. The effect of a multi-component smoking cessation intervention in African American women residing in public housing. Res Nurs Health. 2007;30(1):45–60. doi: 10.1002/nur.20174. [DOI] [PubMed] [Google Scholar]
- 17.Gilman S, Martin L, Abrams D, et al. Educational attainment and cigarette smoking: a causal association? Int J Epidemiol. 2008;37(3):615–24. doi: 10.1093/ije/dym250. [DOI] [PMC free article] [PubMed] [Google Scholar]
- 18.Weden M, Astone N, Bishai D. Racial, ethnic, and gender differences in smoking cessation associated with employment and joblessness through young adulthood in the U. S Soc Sci Med. 2006;62(2):303–16. doi: 10.1016/j.socscimed.2005.06.009. [DOI] [PubMed] [Google Scholar]
- 19.WHO. WHO report on the global tobacco epidemic, 2008: The MPOWER package. Geneva: WHO; 2008. [Google Scholar]
- 20.DHHS. A report of the Surgeon General. Bethesda, MD: DHHS; 1989. Reducing the health consequences of smoking: 25 years of progress. [Google Scholar]
- 21.Kutner M, Greenberg E, Jin Y, Paulsen C. The health literacy of America’s adults: Results from the 2003 National Assessment of Adult Literacy. Washington, DC: National Center for Education Statistics; 2006. [Google Scholar]
- 22.Doak C, Doak L, Root J. Teaching patients with low literacy skills. Philadelphia PA: Lippincott; 1996. [Google Scholar]
- 23.Houts P, Doak C, Doak L, Loscalzo M. The role of pictures in improving health communication: A review of research on attention, comprehension, recall, and adherence. Patient Edu Couns. 2006;61:173–90. doi: 10.1016/j.pec.2005.05.004. [DOI] [PubMed] [Google Scholar]
- 24.Davis T, Williams M, Marin E, Parker R, Glass J. Health literacy and cancer communication. CA Cancer. 2002;52(3):134–49. doi: 10.3322/canjclin.52.3.134. [DOI] [PubMed] [Google Scholar]
- 25.Arthur S, Geiser H, Arriola K, Kripalani S. Health literacy and control in the medical encounter: a mixed-methods analysis. J Natl Med Assoc. 2009;101(7):677–83. doi: 10.1016/s0027-9684(15)30976-7. [DOI] [PMC free article] [PubMed] [Google Scholar]
- 26.Rogers E, Wallace L, Weiss B. Misperceptions of medical understanding in low-literacy patients: implications for cancer prevention. Cancer Control. 2006;13(3):225–9. doi: 10.1177/107327480601300311. [DOI] [PubMed] [Google Scholar]
- 27.Rothman RL, Housam R, Weiss H, et al. Patient understanding of food labels: The role of literacy and numeracy. Am J Prev Med. 2006;31(5):391–98. doi: 10.1016/j.amepre.2006.07.025. [DOI] [PubMed] [Google Scholar]
- 28.Jay M, Adams J, Herring SJ, et al. A randomized tiral of a brief multimedia intervention to improve comprehension of food labels. Prev Med. 2009;48:25–31. doi: 10.1016/j.ypmed.2008.10.011. [DOI] [PubMed] [Google Scholar]
- 29.Cowburn G, Stockley L. Consumer understanding of nutrition labelling: A systematic review. Public Health Nutr. 2005;8(1):21–28. doi: 10.1079/phn2005666. [DOI] [PubMed] [Google Scholar]
- 30.Weiss S, Smith-Simone S. Consumer and health literacy: The need to better design tobacco-cessation product packaging, labels, and inserts. Am J Prev Med. 2011;38(3 Supp):S403–S13. doi: 10.1016/j.amepre.2009.11.020. [DOI] [PubMed] [Google Scholar]
- 31.Thrasher J, Villalobos V, Szklo A, et al. Assessing the impact of cigarette package warning labels: a cross-country comparison in Brazil, Uruguay and Mexico. Salud Pública Mex. 2010;52(Sup 2):S206–15. doi: 10.1590/s0036-36342010000800016. [DOI] [PMC free article] [PubMed] [Google Scholar]
- 32.Berg C, Thrasher J, Westmaas J, Buchanan T, Pinsker E, Ahluwalia J. College student reactions to health warning labels: Sociodemographic and psychosocial factors related to perceived effectiveness of different approaches. Prev Med. 2011;53(6):427–40. doi: 10.1016/j.ypmed.2011.09.006. [DOI] [PMC free article] [PubMed] [Google Scholar]
- 33.Thrasher JF, Allen B, Anaya-Ocampo R, Reynales LM, Lazcano-Ponce EC, Hernández-Avila M. Analysis of the impact of cigarette package warning labels with graphic images among Mexican smokers. Salud Pública Mex. 2006;48:S65–S75. [PubMed] [Google Scholar]
- 34.Hammond D, Thrasher J, Reid J, Driezen P, Boudreau C, Arillo-Santillán E. Perceived effectiveness of pictorial health warnings among Mexican youth and adults: a population-level intervention with potential to reduce tobacco-related inequities. Cancer Causes Control. 2012;23:57–67. doi: 10.1007/s10552-012-9902-4. [DOI] [PMC free article] [PubMed] [Google Scholar]
- 35.Thrasher J, Arillo-Santillán E, Villalobos V, et al. Can pictorial warning labels on cigarette packages address smoking-related health disparities? Field experiments in Mexico to assess pictorial warning label content. Cancer Causes Control. 2012;23:69–80. doi: 10.1007/s10552-012-9899-8. [DOI] [PMC free article] [PubMed] [Google Scholar]
- 36.Hammond D, Reid JL, Driezen P, Boudreau C. Pictorial health warnings on cigarette packs in the United States: An experimental evaluation of the proposed FDA warnings. Nicotine Tob Res. doi: 10.1093/ntr/nts094. in press. [DOI] [PMC free article] [PubMed] [Google Scholar]
- 37.Nonnemaker J, Farrelly MC, Kamyab K, Busey A, Mann N. Experimental study of graphic cigarette warning labels. Research Triangle Park, NC: RTI International; 2010. [Google Scholar]
- 38.Jansen J. Internet & American Life Project. Washington, DC: Pew Research Center; 2010. Use of the internet in higher-income households. [Google Scholar]
- 39.Rees VW, Kreslake JM, Cummings KM, et al. Assessing consumer responses to potential reduced-exposure tobacco products: A review of tobacco industry and independent research methods. Cancer Epidemiol Biomarkers Prev. 2009;18:3225–3240. doi: 10.1158/1055-9965.EPI-09-0946. [DOI] [PMC free article] [PubMed] [Google Scholar]
- 40.Bernard HR. Social research methods: Qualitative and quantitative approaches. Thousand Oaks, CA: Sage; 2000. [Google Scholar]
- 41.Biener L, Abrams DB. The contemplation ladder: Validation of a measure of readiness to consider smoking cessation. Health Psych. 1991;10:360–365. doi: 10.1037//0278-6133.10.5.360. [DOI] [PubMed] [Google Scholar]
- 42.Carpenter M, Hughes J, Solomon L, Callas P. Both smoking reduction with nicotine replacement therapy and motivational advice increase future cessation among smokers unmotivated to quit. J Consult Clinical Psychol. 2004;72:371–81. doi: 10.1037/0022-006X.72.3.371. [DOI] [PubMed] [Google Scholar]
- 43.Weiss BD, Mays MZ, Martz W, et al. Quick assessment of literacy in primary care: The Newest Vital Sign. Ann Family Med. 2005;3(6):514–22. doi: 10.1370/afm.405. [DOI] [PMC free article] [PubMed] [Google Scholar]
- 44.Friedman DB, Tanwar M, Yoho DW, Richter JVE. An exploratory study on disaster preparedness communication: Are critical messages reaching individuals with low literacy? Community Lit J. in press. [Google Scholar]
- 45.Parker R, Baker D, Williams M, Nurss J. The test of functional health literacy in adults: a new instrument for measuring patients’ literacy skills. J Gen Intern Med. 1995;10(10):537–41. doi: 10.1007/BF02640361. [DOI] [PubMed] [Google Scholar]
- 46.Hardin J, Hilbe J. Generalized Estimating Equations. Boca Raton, FL: Chapman & Hall/CRC; 2003. [Google Scholar]
- 47.Brandt AM. The cigarette century: The rise, fall, and deadly persistence of the product that defined America. New York: Basic Books; 2007. [Google Scholar]
- 48.Cummings KM. Are smokers adequately informed about the health risks of smoking and medicinal nicotine. Nicotine Tob Res. 2004;6:S333–S40. doi: 10.1080/14622200412331320734. [DOI] [PubMed] [Google Scholar]
- 49.IOM. Speaking of health: Assessing health communication strategies for diverse populations. Washington DC: National Academy of Sciences, IOM; 2002. [PubMed] [Google Scholar]
- 50.Cantrell J, Vallone D, Thrasher J, et al. Impact of tobacco-related health warning labels across socioeconomic, race and ethnic groups: Results from a randomized web-based experiment. PLoS One. doi: 10.1371/journal.pone.0052206. under review. [DOI] [PMC free article] [PubMed] [Google Scholar]


