

Abstract
We demonstrate that convergent transcription induces transcriptional gene silencing (TGS) in trans for both fission yeast and mammalian cells. This methodology has advantages over existing strategies to induce gene silencing. Previous studies in fission yeast have characterized TGS as a cis specific process involving RNA interference that maintains heterochromatic regions such as centromeres. In contrast for mammalian cells, gene silencing is known to occur by a post transcriptional mechanism employing exogenous siRNAs or endogenous microRNAs to inactivate mRNA. We now show that introduction of convergent transcription plasmids into either S. pombe or mammalian cells allows the production of dsRNA from inserted gene fragments resulting in TGS of endogenous genes. We predict that using convergent transcription to induce gene silencing will prove a generally useful strategy and allow a fuller molecular understanding of the biology of transcriptional gene silencing.
Introduction
RNA interference (RNAi) in eukaryotes can be elicited by either cytoplasmic post-transcriptional (PTGS) or nuclear transcriptional gene silencing (TGS) mechanisms. PTGS is related to either the destruction or translational inhibition of mRNA while TGS is associated with epigenetic chromatin silencing marks such as CG DNA methylation or nucleosomal histone tail modifications such as histone H3 lysine 9 trimethylation (H3K9me3) 1-4. RNAi mechanisms begin with the formation of double strand RNA (dsRNA) generated by transcription of inverted repeats, resulting in RNA hairpins or by convergent transcription leading to overlapping transcripts. dsRNA so formed is processed by RNAse III type endonucleases, Dicer and Drosha to generate short interfering (si) RNAs or micro (mi) RNAs respectively 5. PTGS targets mRNA inactivation or degradation through the incorporation of siRNA or miRNA into the RNAi induced silencing complex (RISC). Within this complex argonaute acts to cleave the mRNA targeted by siRNA or miRNA primed RISC 6. With TGS a different siRNA primed argonaute complex (RITS) is targeted to gene loci homologous to the siRNA resulting in gene silencing. This in turn recruits chromatin modifying enzymes that induce heterochromatin formation. TGS has been well documented in S. pombe as a cis silencing process with the dsRNA derived from the same loci that are to be silenced 7. We have shown that convergent genes (CGs) in S. pombe generate G1 specific read-through transcripts forming dsRNA that induces transient heterochromatin through nuclear RNAi pathways. However following S phase, cohesin recruited by CG heterochromatin blocks further read-through transcription causing heterochromatin loss in G2 8. We have also shown that S. pombe CGs (encoding RNAi factors) are transcriptionally downregulated by TGS in G1 through the production of siRNAs. This effect is CG dependent, since switching CGs into a tandem orientation at their chromosomal location prevents gene silencing 9.
Different eukaryotes employ different RNAi strategies. In C. elegans miRNA elicit cytoplasmic PTGS and also reenter the nucleus to induce TGS effects 10. Plant RNAi involves a wide range of dicer and argonaute proteins2 mediating TGS and PTGS pathways. Similarly drosophila employs both RNAi strategies 11. Several studies have reported the use of convergent transcription (CT) to promote gene silencing in different eukaryotes. In trypanosomes, convergent bacteriophage T7 promoters flanking a gene sequence to be silenced are transfected into parasites that also express T7 phage RNA polymerase resulting in presumed PTGS affects 12-14. CT induced gene silencing has also been described in Drosophila and mammalians. Drosophila CT was engineered by using Gal4 regulated RNA polymerase II (Pol II) promoters (from budding yeast) flanking a test gene sequence. Transfection in flies, also expressing Gal4 transcription factor, induced presumed PTGS effects15. In mammalian cells, CT plasmids using Pol III convergent promoters (from U6 snRNA genes) with the targeting sequence less than 30 nucleotides were transfected into tissue culture cells 16. The short dsRNA produced avoids activation of cytoplasmic interferon response17. Significant gene silencing of target genes was again observed. These various studies show the potential for CT as a way to induce gene silencing. However this technology has not been widely applied possibly due to the complexity of arranging such transcription systems and the fact that the silencing observed was assumed to induce only short term PTGS.
We have tested whether CT can be utilized as a simple and effective way to mediate long term TGS in both S. pombe and mammalian cells. We show that CT systems have substantial advantages over currently employed gene silencing procedures.
Results
CT leads to silencing by RNAi in S. pombe
We initially tested the transcription of plasmids transformed into S. pombe containing the ura4 open reading frame (ORF) between divergently arranged nmt1 promoters (CTura4ORF, Fig. 1a). We employed an ura4 deletion strain, allowing detection of plasmid derived ura4 transcripts. In wild type (wt) cells no plasmid ura4 transcripts were detectible while in separate strains lacking RNAi factors, dicer or argonaute, (Δdcr1, Δago1), ura4 transcription (both sense and antisense) was evident (Fig. 1b). These results indicate that in wt cells plasmid derived ura4 CT induces gene silencing in cis, presumably by dicer dependent processing of ura4 double strand (ds) RNA. We next tested for ura4 siRNAs using a siRNA specific plant viral protein called p19 18 which has high affinity for small dsRNA or RNA:DNA hybrid. ura4 DNA oligonucleotides (32P labeled 20mers) were annealed to total S. pombe RNA fractions and siRNA:DNA hybdrids were then selected with p19 coated magnetic beads. After extensive washing isolated 32P-DNA oligonucleotides (as part of the hybrid) were fractioned revealing a strong signal for wt but not Δdcr1 or Δago1 RNA (Fig 1c). We have previously shown that TGS induced by endogenous convergent gene transcription in S. pombe does not require RNA dependent RNA polymerase (Rdp1) amplification 9 unlike centromeric heterochromatin formation1. We therefore tested this plasmid TGS effect in Δrdp1 cells. Like wt RNA, no ura4 transcripts, but abundant ura4 siRNAs were observed (Fig. 1b,c). Overall these results demonstrate that plasmid-generated dsRNA elicits efficient cis TGS resulting in transcriptional silencing of the plasmid located ura4 ORF.
Figure 1. S. pombe transformed CT plasmids are silenced by RNAi.
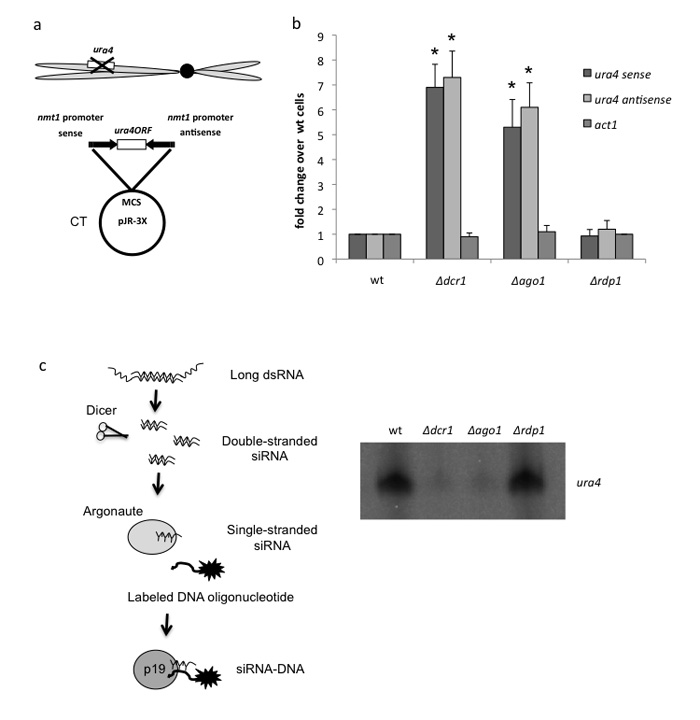
(a) Diagram depicting CT plasmid containing ura4 ORF transcribed by bidirectional nmt1 promoters in a ura-S. pombe strain. MCS denotes multiple cloning site. Positions of convergent nmt1 promoters are shown by arrows.
(b) qRT-PCR. Levels of ura4 sense and antisense transcript measured by strand specific qRT-PCR for different CTura4ORF transformed S. pombe RNAi mutant strains. All bars represent average values ± SD from at least three independent biological experiments. * indicates statistical significance (p < 0.05), based on unpaired, two-tailed distribution Student’s t-test.
(c) p19 siRNA pull down. Diagram showing use of p19 protein beads to select siRNAs hybridized to ura4 probes (5′end 32P labelled DNA oligonucleotides). Gel image of ura4 probes selectively isolated are shown
Convergent transcription induces trans silencing in S. pombe
While TGS acting in cis (at the site of dsRNA synthesis) is a well described phenomenon in S. pombe, especially for centromeric heterochromatin, trans acting TGS has proven harder to achieve. Previously plasmid or genomic constructs that express a hairpin RNA capable of generating siRNAs were reported to induce some TGS in trans 19. However this appeared to act preferentially on target genes either close to antisense transcription units or to other heterochromatic regions.
We tested whether CTura4 plasmids can induce trans TGS of endogenous ura4 (Fig. 2). Two different CT plasmids containing either the ura4 promoter or ORF caused a reduction to 32% and 44% respectively of endogenous ura4 polyA+ mRNA (Fig. 2b). In contrast transformation of empty CT vector (V) had no effect. Similarly endogenous act1 mRNA levels were unchanged by CTura4ORF transformation. Note that the ura4 inserts in CT lack polyA signals (PAS) and so cannot generate ura4 polyA+ mRNA. The inducible nmt1 promoters (activated by lack of thymine) that generate the dsRNA signal from the CT plasmid were normally switched on by overnight growth in minimal medium. However when grown in minimal medium for several days a greater TGS effect was observed: reduced to 12% of ura4 nascent RNA and 19% of ura4 mRNA (Fig, 2c,d). Further controls for CTura4 induced TGS are presented (Supplementary Fig. 1a, b) showing that reduction of ura4 mRNA levels depends on CT induction by growth in minimal medium (EMM; -thymine). Also transformation of S. pombe with separate sense and antisense ura4ORF plasmids showed no significant reduction (only to 80 and 90%) in ura4 mRNA levels. In contrast, co-transformation of Sura4ORF and ASura4ORF weakly suppressed (reduction to 50%) levels of ura4 mRNA. Efficient silencing (reduction to 23%) required transcription of both DNA strands from the same gene template as in CTura4.
Figure 2. CT ura4 plasmids induce TGS of endogenous ura4 in S. pombe.
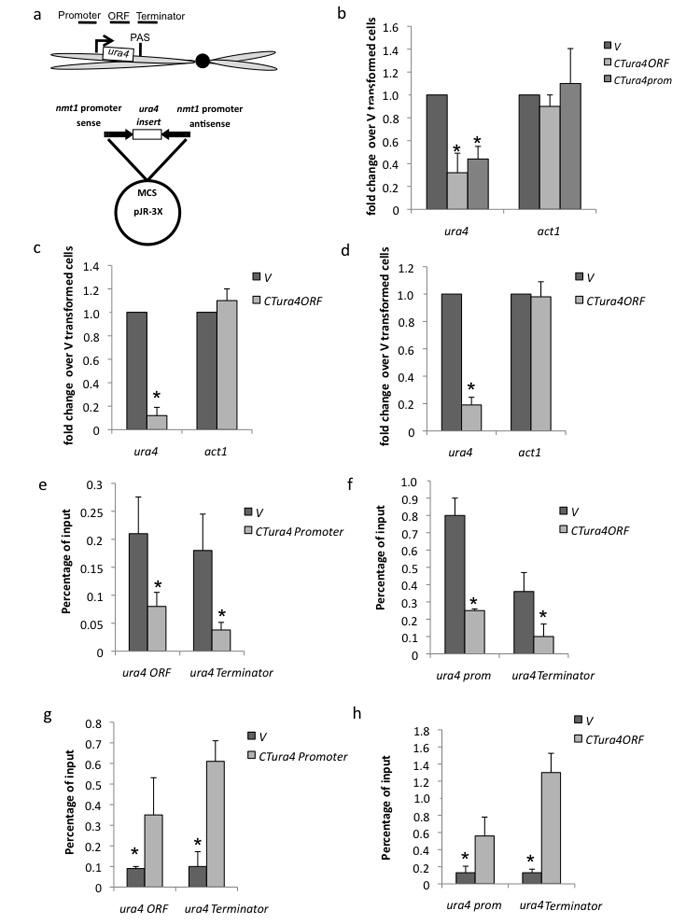
(a) CT ura4 plasmid diagram showing endogenous ura4 with indicated positions of ChIP probes on endogenous ura4 as indicated.
(b) qRT-PCR. CT ura4 plasmids containing either ura4 ORF or promoter sequences induce selective reduction of endogenous ura4 but not act1 mRNA levels as measured by qRT-PCR using oligodT primer for cDNA synthesis. Empty CT vector (V) was used as normalizing control. Induction period of CT nmt1 promoters by growth in EMM was overnight (as for all experiments except for (c,d)).
(c,d) qRT-PCR of nascent ura4 RNA (using RT primer across PAS) or ura4 mRNA (using oligodT RT primer) following induction of CT for three days.
(e,f) ChIP analysis using Pol II specific antibody on chromatin isolated for CTura4prom or CTura4ORF transformed S. pombe with PCR primer pairs as indicated in (a).
(g,h) ChIP analysis using histone H3K9me3 specific antibody as in (e,f)
All RT-PCR and ChIP values are based on average values ± SD from at least three independent biological experiments. * indicates statistical significance (p < 0.05), based on unpaired, two-tailed distribution Student’s t-test.
To establish that the CTura4 trans silencing effect acts at a transcriptional level we measured levels of Pol II and the heterochromatin histone mark (H3K9me3) on endogenous ura4 using chromatin immunoprecipitation (ChIP), following activation of plasmid derived CTura4 transcription. S. pombe transformed with either CTura4prom or CTura4ORF but not V plasmid, showed Pol II reduction and increased H3K9me3 levels both indicative of trans TGS (Fig. 2e-h). In detail different regions of endogenous ura4 to sequence present in the CT plasmids were subjected to ChIP analysis. CTura4prom transformed cells showed about 65% reduced levels of Pol II over ura4 ORF and terminator regions while CTura4ORF showed a similar reduction over ura4 promoter and terminator regions. Analogous experiments probing ura4 chromatin for H3K9me3 heterochromatin marks showed TGS induction over endogenous ura4. Interestingly the terminator region seems to be especially enriched for this histone mark following CTura4 induction.
To further investigate the capability of CTura4 to induce endogenous trans TGS we tested the effect of stably integrating CTura4ORF into the S. pombe genome. An integrated iCTura4ORF strain was generated showing 2N ura4 copy number and significant levels of sense and antisense ura4 transcript grown in minimal medium to activate the iCTura4 allele (Supplementary Fig. 1c, d). As with CTura4 plasmid transformation, endogenous ura4 transcript was reduced as compared to wt cells following induction of the nmt1 promoters (Fig. 3a, b). Similarly we show a reduction in Pol II levels and the appearance of H3K9me3 marks over endogenous ura4 (Fig. 3c, d). These results underlie the capacity of CTura4 whether episomal or stably integrated to induce TGS in trans.
Figure 3. Integrated CT constructs promote endogenous ura4 TGS in trans.
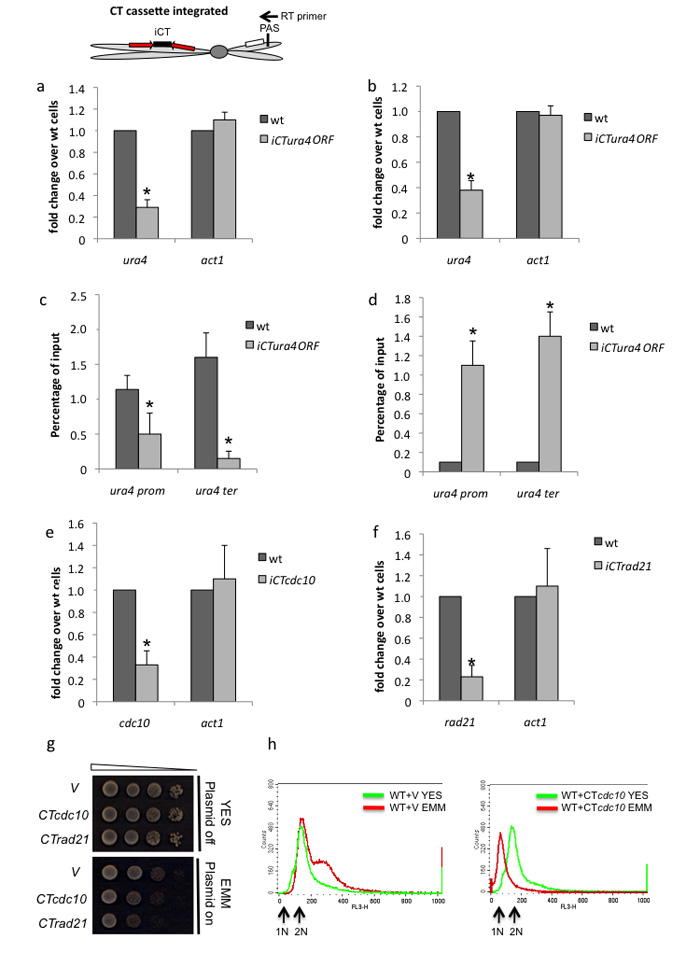
(a,b) qRT-PCR. iCTura4ORF transformed S. pombe shows reduced levels of endogenous ura4 nascent RNA(a) and mRNA(b) based on qRT-PCR analysis. Diagram shows integrated CT chromosome with position of RT primer used to detect nascent RNA (not cleaved at PAS). Also shown, nmt1 promoters (red arrows) and endogenous ura4.
(c,d) ChIP analysis. Endogenous ura4 is subjected to trans TGS from iCTura4ORF as judged by Pol II and H3K9me3 ChIP analysis.
(e,f) qRT-PCR. Induction of iCTcdc10 and iCTrad21 integrated into S. pombe causes a selective reduction in endogenous cdc10 and rad21 mRNA levels based on qRT-PCR analysis. All RT-PCR and ChIP values in a-f) are based on average values ± SD from at least three independent biological experiments. * indicates statistical significance (p < 0.05), based on unpaired, two-tailed distribution Student’s t-test.
(g) Growth analysis. iCTcdc10 and iCTrad21 integrated S. pombe strains show a growth defect following CT induction on EMM plates.
(h) FACs analysis showing that iCTcdc10 S. pombe are synchronized in G1 cell cycle phase following EMM growth. Unsynchronised wt cells display a G2 FACs profile as this is the longest cell cycle phase.
We tested if CT mediated TGS was effective with other S. pombe endogenous genes, especially essential genes, as these are normally inactived by use of temperature sensitive (ts) alleles requiring growth at non-physiological temperatures. Two additional CT plasmids containing ORFs for either cdc10 (required for G1 cell cycle progression) or rad21 (component of cohesin) were stably integrated into the S. pombe genome. iCTcdc10 and iCTrad21 strains were growth defective in minimal medium as compared to cells stably transformed with empty vector (V) and showed commensurate reduction in cdc10 or rad21 mRNA levels (Fig. 3e-g). Furthermore since cdc10 is required for passage through the G1 phase of the cell cycle we tested whether iCTcdc10 activation perturbs the cell cycle. Remarkably induction of cdc10 gene silencing induced cell cycle arrest in G1 cells as shown by FACs analysis (Fig. 3h). Since unsynchronized S. pombe is predominantly in G2 (2N), wt cells (stably transformed with V) gave a 2N FACs profile in either YES or EMM medium. Note that in minimal media cell growth is perturbed yielding higher chromosome copy number cells. However with iCTcdc10 transformed S. pombe, the cell population was G1 synchronized.
Overall we show (Fig. 2 and 3) that CT technology silences S. pombe genes by TGS. Furthermore our CT technology has substantial advantage for essential genes, which can by silenced at physiological temperature.
CT induces TGS of mammalian γ-actin gene
Our studies on CT induced gene silencing in S. pombe led us to test this effect in mammalian cells. We employed the pCI mammalian expression vector with its CMV promoter, but added a second opposing CMV promoter (Fig. 4a), creating a mammalian CT plasmid. We then inserted a cDNA fragment (exons 2-6) of γ-ACT1 into CT to test for potential endogenous γ-ACT1 silencing following HeLa cells transient transfection.
Figure 4. Transfection of mammalian CTura4 plasmid induces γ-ACT1 TGS.
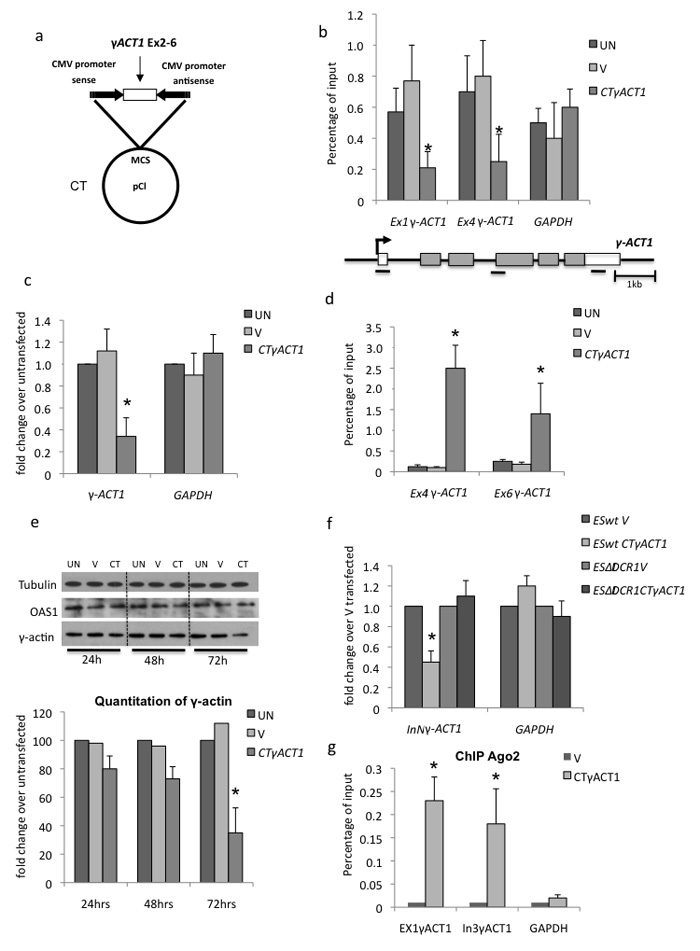
(a) Diagram of CT γACT1 containing γACT1 cDNA (exons 2-6).
(b) Pol II ChIP analysis of γ-ACT1 or GAPDH control using amplicons specific to endogenous gene as shown on gene diagram below. Chromatin was isolated from HeLa cells transiently transfected with CT vector alone (V), CTγACT1 or untransfected (UN).
(c) qRT-PCR. Measurement of mRNA levels using oligodT primed qRT-PCR on RNA from HeLa cells transfected as in (b).
(d) H3K9me3 antibody ChIP as in (b).
(e) Western blot analysis and quantitation of γ-actin protein levels compared to tubulin and OAS1 on total protein isolated from HeLa cells transfected as in (b) for 1-3 days.
(f) qRT-PCR. Effect of CTγACT1 transfection of ES cells, wt or ΔDCR1 on nascent transcript levels from γ-ACT1 versus GAPDH.
(g) Ago2 ChIP on chromatin from V or CTγACT1 transfected HeLa cells using specific amplicons for endogenous γ-ACT1 or GAPDH.
All RT-PCR and ChIP values in b, c, d, f and g are based on average values ± SD from at least three independent biological experiments. * indicates statistical significance (p < 0.05), based on unpaired, two-tailed distribution Student’s t-test.
Pol II ChIP analysis of γ-ACT1 in untransfected HeLa cells (UN) or transfected with empty vector (V) or with CTγACT1 revealed similar Pol II occupancy over γ-ACT1 exon 1 and intron 3-exon 4 junction in UN and V cells, but lower levels in CTγACT1 transfected cells (Fig. 4b). Since neither probed regions of endogenous γ–ACT1 are in the CTγACT1 plasmid, we infer that endogenous γ–ACT1 silencing has occurred. Pol II levels over GAPDH were similar in all three samples, excluding a general transcriptional effect. Next, we measured γ-ACT1 versus control GAPDH mRNA levels in UN, V and CTγACT1 transfected cells (Fig. 4c). Note that γACT1 sequence in CT lacks a PAS and so will not produce stable mRNA. OligodT was used for the RT reaction and the same exon 4 primers for the PCR reaction. While UN, V and CTγACT1 transfected cells show similar GAPDH mRNA levels, γ-ACT1 mRNA levels were decreased to 34% in CTγACT1. We also tested the effect of CTγACT1 transfection into HEK293 cells and observed a similar reduction in γ-ACT1 mRNA levels (Supplementary Fig. 2a). We next tested whether heterochromatin was induced by CTγACT1 transfection into HeLa cells. H3K9me3 ChIP analysis on UN, V and CTγACT1 transfected cells with γ-ACT1 intron 3-exon 4 junction and 3′ UTR primers (not present in CTγACT1) as well as GAPDH primers revealed no positive H3K9me3 signals for the GAPDH gene in all tested samples. Similarly no signal was detected for γ-ACT1 in UN and V cells. However, H3K9me3 signals were demonstrated over γ-ACT1 in CTγACT1 transfected cells (Fig. 4d). Note that we also detect H3K9me2 marks on γ-ACT1 chromatin from CTγACT1 transfected cells (Supplementary Fig. 2b, c). We infer that CTγACT1 transfection induces TGS of endogenous γ–ACT1. To generalize our CT induced TGS results to other endogenous genes we generated three more CT constructs containing cDNA sequences from CYPA, PGK1 and GAPDH. Importantly each gave similar endogenous gene silencing effects as judged by reduction in Pol II occupancy and mRNA expression from these different gene loci (Supplementary Fig. 2d-g). We also investigated γ-actin protein levels following CTγACT1 transfection. Levels of γ-actin in UN and V cells were similar at all post-transfection time points while with CTγACT1 transfected cells, a slight decrease in γ-actin occured after 24 hr transfection, with further reductions at 48 and 72 hr (Fig. 4e). Since γ–actin is a stable and essential protein, a larger effect was not anticipated. We initially considered that dsRNA (as formed by our CT gene constructs) might induce the cytoplasmic interferon response leading to cell death 20. Indeed this occurs with some shRNA expression vectors where the hairpin RNA is processed in the cytoplasm 21. However we anticipated that our CT generated dsRNA is nuclear localized and directly processed by nuclear dicer, as dicer is reported to be active in the nucleus22,24. We measured the levels of 2′5′oligoadenylate synthase (OAS1) known to be activated in the interferon response pathway 21 following CTγACT1 transfection (versus UN and V) but detected no change in OAS1 levels 72 hrs post-transfection (Fig. 3e). We infer that the interferon response is not activated in this situation.
We finally wished to establish that the gene silencing effect is RNAi associated. We therefore transfected CTγACT1 into ES cells lacking dicer expression 25. Although transfection efficiencies for these cells are lower than for HeLa, we still detected a γ-ACT1 silencing effect with both nascent transcript and mRNA. ES cells lacking dicer (ΔDCR1) lost this silencing effect (Fig. 4f and Supplementary fig. 2h). These data predict that CT plasmid expression induces TGS of endogenous target genes through an RNAi mechanism. We also performed ChIP analysis using Ago2 antibody (cloneeIF2C2, dilution 1:1000) on CTγACT1 versus vector alone transfected HeLa cells. A strong Ago2 signal was detected on both endogenous exon 1 and intron 3 of γ-ACT1 but not GAPDH following CTγACT1 (not V) transfection (Fig. 4g).
γ-ACT1 TGS by CT is more efficient than PTGS by siRNA/shRNA
Inhibiting mammalian gene expression by specific siRNA or shRNA transfection is a commonly used procedure. The efficiency of such experiments varies, depending on the expression of the tested gene. Usually a “two hit” transfection experiment is necessary to achieve a significant effect. Also off target effects may necessitate testing multiple siRNAs or shRNAs26. We compared the efficiency of CT versus siRNA or shRNA mediated gene silencing. We obtained commercial γ-ACT1 specific siRNA and a shRNA expression plasmid and transfected HeLa cells with these different gene silencing reagents. First, we tested γ-ACT1 and control GAPDH mRNA levels. We normalized these to mRNA levels from untransfected cells and observed a (p < 0.05, n=3) decrease of sense γ-ACT1 mRNA levels in cells treated with siRNA or shRNA after 72 hr (Supplementary Fig. 3). This effect was lost at the next 96 hr time point, confirming only a transient effect. Interestingly, CT transfected cells show lower levels of γ-ACT1 mRNA 48 hr after transfection and even lower levels at the later time points of 72 (reduction to 30%) and 96 (reduction to 10%) hr post transfection. GAPDH mRNA signals were similar in all samples (Supplementary Fig. 3a). These data show that the silencing effect induced by CT is greater and longer lasting than transient siRNA and shRNA induced down-regulation of mRNA levels. We also analyzed antisense γ-ACT1 versus GAPDH transcription and detected positive γ-ACT1 signals in cells treated with CT, at all time points, reaching the highest level at 72 hr post transfection (Supplementary Fig. 3b).
Next, we analyzed the down-regulation effect on γ-actin protein levels (Supplementary Fig. 3c) following siRNA, shRNA or CT transfection. Tubulin levels were constant in all samples at all time points, confirming equal loading. Levels of γ-actin show a moderate, but visible decrease with siRNA and shRNA, but were significantly (p < 0.05, n=3) reduced in CT treated cells as compared to all other samples. This suggests CT has a stronger effect on gene silencing than siRNA and shRNA. Finally, we tested H3K9me3 levels by ChIP in cells treated with siRNA, shRNA or CT for 48 and 96 hr post-transfection (Supplementary Fig. 3d). H3K9me3 signal was detectible in CT cells at both time points. Comparison of CT to siRNA and shRNA reveals that CT induced γ-ACT1 gene silencing is more efficient.
In vitro and in vivo analysis of nuclear dicer function
We show above that CT gene constructs elicit a TGS response in both S. pombe and mammalian cells strongly implying a nuclear function for dicer. To further investigate the molecular basis of this nuclear RNAi process we tested if CTγACT1 can generate dsRNA by in vitro transcription in nuclear extracts and if this dsRNA can undergo dicer dependent siRNA formation. We first confirmed that the nuclear extracts contain detectible levels of dicer and that this protein fraction can be immunodepleted using a dicer antibody (Fig. 5a), A control template that in vitro transcribes 363 nt single strand RNA was also employed (+) as was empty vector (V). RNA isolated from untreated nuclear extracts gave heterogeneous RNA species for CTγACT1 and V templates and a single RNA product for +. Single strand (ss) specific S1 nuclear nuclease treatment degraded most transcripts implying that they are predominantly single stranded. However, some dsRNA (390 nt) was observed with a CTgACT1Ex4 construct (Fig. 5b). This effect was controlled by use of V1 nuclease, which is dsRNA specific. No enrichment of γ–ACT1 RNA was observed over the heterogenous RNAs. Finally we show that CTγACT1 in vitro transcription in nuclear extracts also yielded detectible siRNA (Fig. 5c). Dicer depletion of the nuclear extracts caused a loss of siRNA production but not levels of dsRNA. Overall these results demonstrate that HeLa cell nuclear extracts contain active dicer associated RNAi activity. This recognizes co-transcriptionally formed dsRNA to generate siRNA like molecules. We consequently infer that HeLa nuclei possess active RNAi apparatus and that this may account for the observed TGS effect we see with our various transfected CT gene plasmids.
Figure 5. in vitro and in vivo analysis of nuclear dicer activity.
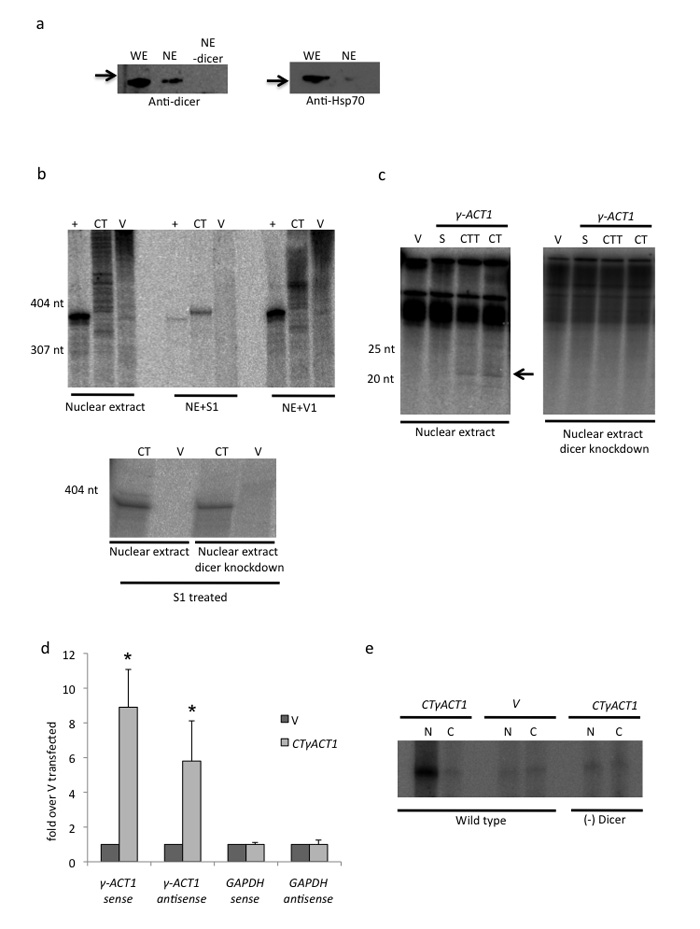
(a) Western blot analysis of dicer and Hsp-70 from whole cell extract (WE) versus nuclear extract (NE) with or without dicer immunodepletion (NE-dicer). Hsp70 was only detectable in WE confirming purity of NE.
(b) In vitro transcription. NE dependent in vitro transcription of CTγACT1 Ex4 (390 nt RNA) and vector alone plus control run off template (yielding 363 nt RNA). Following the transcription reaction, RNA was isolated and fractionated. The long RNA fraction was treated with S1 (single strand specific), V1 (double strand specific) nucleases. Lower panel shows that dicer depleted NE still yields CT derived dsRNA.
(c) In vitro transcription. Fractionation of small RNAs isolated from templates as indicated (Supplementary Fig. 4). S denotes single promoter construct making just a sense transcript. Only CT and CTT yield detectible siRNAs (denoted by arrow) but not in dicer depleted NE.
(d) qRT-PCR. Immunoselection of dsRNA from CTγACT1 or V transfected Hela cells using J2 antibody. Sense and antisense transcripts from CTγACT1 or endogenous GAPDH were monitored by qRT/PCR using strand specific RT primers. RT-PCR values in are based on average values ± SD from at least three independent biological experiments. * indicates statistical significance (p < 0.05), based on unpaired, two-tailed distribution Student’s t-test.
(e) p19 selection of siRNAs using 32P γ-ACT1 DNA oligonucletides (as in Fig. 1c). HEK293 (inducible dicer knockdown cells) were transfected with CTγACT1 or V. See online Methods for details.
We finally confirmed these in vitro data by analysis of dicer activity in vivo. For dsRNA, whole cell extracts from HeLa cell CTγACT1 transfections were immunoprecipitated using dsRNA specific J2 antibody 27. Selected RNA fractions were analysed by qRT/PCR for sense and antisense γACT1 and GAPDH transcripts. As indicated (Fig. 5d) transfected CTγACT1, but not V transfected RNA neither endogenous GAPDH gave positive signals. This confirms that CTγACT1 generates dsRNA. For siRNA in vivo detection, p19 reagent was again used18 (Fig. 1c). A human HEK293 cell line with a stably integrated and inducible gene construct that expresses dicer shRNA was employed. Following CTγACT1 transfection (with or without doxycyclin induction and consequent dicer knock down) nuclear and cytoplasmic RNA fractions were p19 selected using γ–ACT1 DNA oligonucleotides and the products gel fractionated. As shown (Fig. 5e), only nuclear RNA from CTγACT1 (not V) transfected cells without Dicer knock down yielded signal above background. This confirms that CTγACT1 generates nuclear specific and dicer dependent siRNAs both in vitro and in vivo.
Specificity of mammalian CT induced TGS
We constructed additional γ-ACT1 expression plasmids with a single CMV promoter driving either sense (S) or antisense (AS) transcription (Supplementary Fig. 4). HeLa cells were transiently transfected with V, S, AS or mixed S and AS plasmids as well as CTγACT1. Endogenous γ-ACT1 was analysed for heterochromatin marks (Fig. 6a) and mRNA expression levels at 24 and 48 hr post-transfection time points (Fig. 6b). Significantly (2.1% and 3.8% of input) H3K9me3 accumulated over endogenous γ-ACT1 for CTγACT1 transfected cells and to a lesser degree (0.9% and 1.3% of input) with S+AS constructs (p < 0.05, n=3). Consistent with heterochromatin formation, γ–ACT1 mRNA was also only effectively reduced by TGS with CTγACT1 transfected cells. Presumably the weaker TGS effect of S+AS versus CT reflects the fact that separately synthesized complementary RNAs do not anneal as effectively as co-transcribed transcripts. The even weaker TGS effects seen with AS alone transfected cells may reflect low level recognition of endogenous γ-ACT1 mRNA by this antisense transcript. We determined, whether TGS effects can be induced by CT plasmids containing only intron. Notably intron was as effective as exon in reducing levels of either nascent γ-ACT1 transcript or mRNA (Fig. 6c and Supplementary Fig. 4). This further emphasizes that CT plasmid transfection induces TGS since introns are nuclear restricted. Finally we tested whether placing a PAS at the end of each convergent transcript (CTT) (Supplementary Fig. 4). Transcripts produced from CTT should be stabilized by polyadenylation and possible cytoplasmic export. However it is evident (Fig. 6d) that CTT versus CT plasmid transfection did not increase the TGS effects on endogenous γ-ACT1 already seen with CT plasmid, at nascent and steady state RNA level.
Figure 6. Specificity of TGS induction by CTγACT1 transfection.
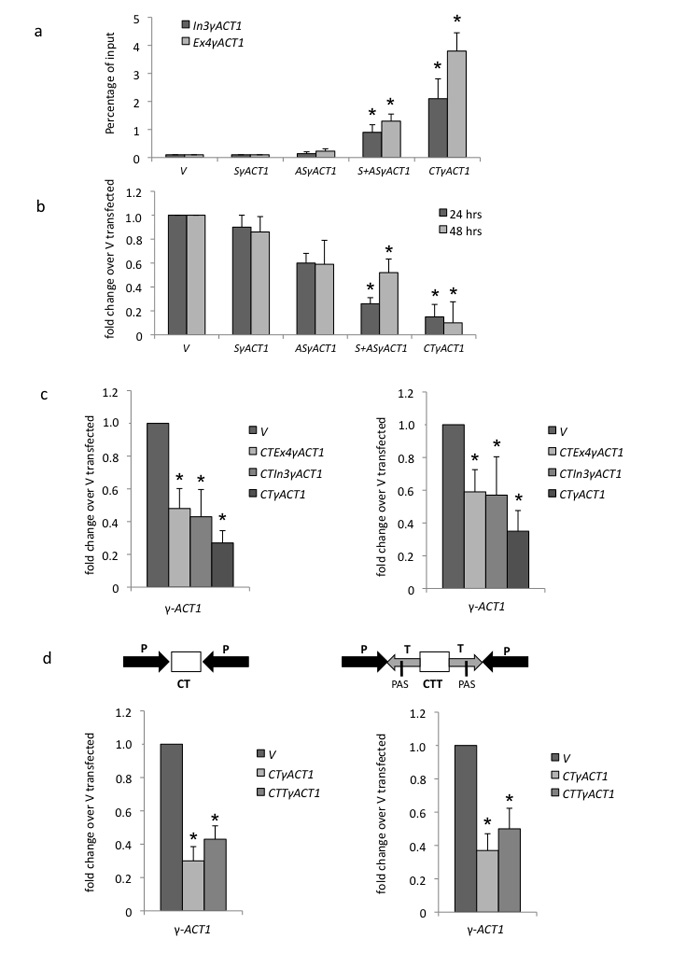
(a,b) ChIP and qRT-PCR. H3K9me3 ChIP and γ-actin mRNA qRT-PCR respectively were performed as in Fig. 4 but using additional γ-ACT1 (Ex2-6) expression constructs: sense (S) or antisense (AS) alone γ-ACT1 transcription plasmids or S and AS plasmids cotransfected. Note only CT plasmid is effective in inducing full levels of heterochromatin and maximum reduction in mRNA levels.
(c) qRT-PCR. CT constructs containing γ-ACT1 intron 3 or exon 4 only were compared for TGS effects versus the full CT γACT1Ex2-6 sequence measuring polyA+ mRNA (left) and nascent (right) (intronic) transcript.
(d) qRT-PCR. CT γACT1 (Ex2-6) plasmid was modified by positioning PAS derived from SV40 at either end of the γ-ACT1 sequence so that both S and AS transcripts are polyadenylated (Supplementary Fig. 4). The TGS effects were then determined for both nascent (left) and steady state (right) γ-ACT1 transcripts by qRT/PCR analysis. P denotes CMV promoter and T, SV40 PAS.
All RT-PCR and ChIP values are based on average values ± SD from at least three independent biological experiments. * indicates statistical significance (p < 0.05), based on unpaired, two-tailed distribution Student’s t-test.
Spatial and temporal aspects of CT induced TGS
We investigated whether CT induced TGS causes only localized heterochromatin formation. We employed a CT construct designed to target the pre-mRNA splicing associated gene, TDP-43. Using a CT TDP-43 exons 2-6 construct, we again showed a TGS effect of reduced Pol II over the endogenous gene with commensurate reduction in gene expression at the mRNA and protein levels (Supplementary Fig. 5). We also investigated the profile of induced heterochromatin marks across TDP-43 (Fig. 7a). While the exonic regions cloned into the CT vector showed H3K9me3 marks, above the vector only transfection control, adjacent intronic sequence showed reduced levels of heterochromatin marks. These results indicate that heterochromatin spreading is locally restricted. Presumably the lack of RNA dependent RNA polymerse in mammals, an activity know to cause spreading of heterochromatin marks in plants 2,28 may explain this effect. We finally tested the temporal extent of co-TGS induced by CT transfection (Fig. 7b). Based on reduced Pol II levels and elevated H3K9me3 on TDP-43 chromatin, it is apparent that TGS effects remain in place for a week following initial CTTDP43 transient transfection. Beyond this time the TGS effect diminished, presumably because the small fraction of untransfected HeLa cells eventually outgrow transfected cells.
Figure 7. Spatial and temporal properties of plasmid induced TGS.
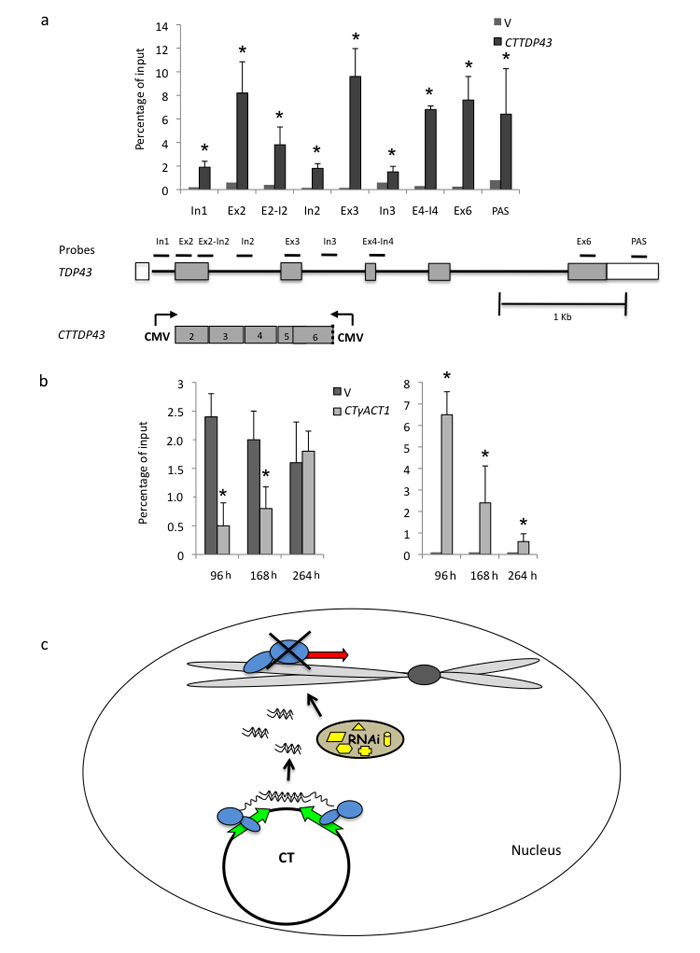
(a) ChIP analysis. The extent of CTTDP43 induced gene silencing across TDP-43 was measured by H3K9me3 ChIP analysis. Heterochromatin spreading was largely restricted to regions directly targeted by the CT construct. TDP-43 gene map is shown below with exons as boxes and introns as lines. Positions of PCR amplicons used are indicated
(b) ChIP analysis. TGS effects (Pol II and H3K9me3 ChIP) were measured over longer time points post transfection of CTγACT1.
All ChIP signals in a) and b) are based on average values ± SD from at least three independent biological experiments. * indicates statistical significance (p < 0.05), based on unpaired, two-tailed distribution Student’s t-test.
(c) Model depicting the mechanism of nuclear TGS in mammals. Chromosome and plasmid transcription are indicated. Active Pol II (in blue) transcription is depicted by green arrows and inactive transcription by red arrows. Nuclear RNAi apparatus (in yellow) dsRNA and siRNA are also indicated.
Discussion
We demonstrate that convergent transcription of a variety of test gene fragments transfected into S. pombe or mammalian cell lines induce trans TGS through a nuclear RNAi pathway (Fig. 7c). This predicts that long dsRNAs derived from CT plasmids, are processed co-transcriptionally by nuclear dicer.
In S. pombe we show that TGS isn’t solely restricted to cis effects such as in centromeric heterochromatin formation. Thus transformation of CT constructs into S. pombe induces trans TGS of three different endogenous genes with surprising facility. Previously in S. pombe only weak trans TGS was observed using plasmids that transcribe hairpin RNAs 19. Other studies suggested that hairpin induced trans silencing requires further genetic modifications to be successful 29,30. CT transcription as described here offers a more efficient way to induce trans TGS. Possibly siRNAs produced from CT derived long dsRNA cover the chromatin target region more effectively and so induce faster target recognition by RNAi factors. As shown in these studies (Fig. 3e, f), CT mediated trans TGS may be particularly useful for studying essential genes previously analysed by ts mutants. The drawback with using ts mutants is that the temperature shift necessary for protein inactivation is stressful to cells. By cloning essential genes into CT, regulated transcriptional gene silencing can be induced without elevated temperature. We tested our system using two model genes, rad21 and cdc10 and show that expression of CT allows depletion of these essential genes at normal temperature. As Cdc10 is a cell cycle regulator acting in G1 we now show that CTcdc10 can be used to block cell cycle in G1 without temperature shift and consequent indirect stress responses (Fig. 3g).
We also show that targeted TGS in human HeLa cells can be induced by transfection of five different CT gene constructs. To date experimentally induced mammalian gene silencing has relied on PTGS by transfected siRNAs or RNA hairpin gene constructs. TGS has remained an enigmatic process that is thought to be less experimentally tractable. Even so a number of studies have pointed towards the possibility that mammalian RNAi induced TGS can also occur. Thus use of gene constructs that express long hairpin RNA in transgenic mice have been reported to induce RNAi effects31,32. In one case dsRNA hairpins were detected in both oocytes and somatic cells, but RNAi effects were only observed in oocytes32. Transfection of duplex siRNAs has also been employed to induce TGS33 by targeting ncRNA aasociated with gene promoters34-36. In studies on the progesterone receptor gene (PR), siRNA (called antigene RNAs or agRNAs) against ncRNA either in the PR promoter or terminator regions can induce gene silencing or activation37-39. This may depend on whether the targeted ncRNAs are activators or repressors of PR gene expression. Also siRNAs to gene exon or intron sequences of the human fibronectin gene induce localized heterochromatin that can perturb local alternative splicing patterns 40. Finally natural antisense transcripts (NATs) have been shown to induce TGS of cis sequences in both the human α-globin gene cluster 41 and the murine Na/phosphate transporter gene 42.
Our CT methodology will be especially useful when it is important to inactivate a particular gene rather than its mRNA product. Several studies have reported dicer activity in the nucleus 22-24. Although long dsRNA in the cytoplasm causes a strong interferon response 43 our system produces dsRNA directly in the nucleus and so does not induce increased levels of OAS1 mRNA indicative of the interferon response. In effect nuclear dicer prevents the escape of long dsRNA into the cytoplasm with consequent induction of interferon response17. siRNAs derived from these long dsRNA will also silence target genes. An early study from our laboratory relates to HeLa cell CT induced TGS as shown in this study. Here intergenic transcripts derived from the β-globin gene locus, detectible in erythroid cells could be induced by transfecting non erythroid cells with plasmids that transcribe globin gene sequence 44. This induction process involved the association of β-globin plasmid with the endogenous β-globin gene locus. It remains an interesting possibility that our mammalian CT plasmids similarly co-localize with their endogenous target genes and that this association relates to TGS induction.
Probably TGS occurs naturally in mammalian cells. Accumulating evidence for widespread ncRNA45 including NATs 46-48 opens up the possibility of endogenous overlapping transcripts with consequent dsRNA formation. Indeed the recent discovery 49 that Alu repeat dsRNA accumulates in dicer deficient retina pigment epithelia leading to blindness in man (macular degeneration) underlies the importance of dicer dependent dsRNA processing. Similarly artificial depletion of dicer has been shown to increase ncRNA levels and act to derepress specific gene loci 22 50. In effect this natural process can be harnessed either by adding exogenous antisense oligonucleotides to target ncRNAs 51 or as in our case simply providing ectopic dsRNA. Overall our studies underline the capacity of mammalian cells like other eukaryotes to employ both nuclear TGS and cytoplasmic PTGS. Clearly CT induced TGS can be employed as a powerful tool to inactivate endogenous genes as well as an approach to better understand the mechanism and biological prevalence of TGS in mammalian cells.
Online Methods
CT plasmid construction
S. pombe CT constructs are based on pJR-3X for episomal plasmids and pCloNat for stable integration. CT employs two convergent nmt1 promoters flanking a multi cloning sequence. Further CT construct details are available on request to authors. Mammalian CT plasmids are based on pC1 (Promega). The different constructs tested are listed in Supplementary Fig. 4.
Transformation and transfection
Transformation of fission yeast by standard lithium-acetate methodology. CT pJR-3X episomal plasmids were maintained in yeast by growth in – his selective medium. Stable integrants were generated by transformation of pCloNat CT plasmids. Selective plates (nurseothricin) were incubated at 32°C, 7 day. Single colonies were genotyped for nmt1 integration and DNA copy number. CT induction was by growing transformed strains in (-thymine) medium overnight (or for longer time as indicated). Transfection of HeLa cells was performed using Lipofectamine 2000 (Invitrogen).
Growth assays in S. pombe
Exponential cells were serially diluted onto EMM (minus thymine) or YES complete plates and incubated at 32°C. FACS analysis measuring DNA content was on fixed cells treated with propidium iodide.
Chromatin immunoprecipitation (ChIP)
Oligonucleotide position and sequence of all primer pairs used in qPCR analyses are available on request to Authors.
S.pombe ChIP
Cells were grown to OD600 0.5, cross-linked (1% formaldehyde) for 10 min at 25°C with gentle shaking, then chilled on ice for 30 min with occasional shaking and harvested by centrifugation at 1000 g for 5 min at 4°C. Pellets were washed 4 times with ice cold buffer I (50 mM Hepes/KOH pH 7.5, 140 mM NaCl, 1 mM EDTA pH 7.5, 1% Triton X-100, 0.1% sodium deoxycholate) and resuspended in 500 μl of buffer I containing protease inhibitors (Roche).
The same volume of acid-washed glass beads was added and homogenized for 60 sec, followed by 5 min on ice. Procedure was triplicated. Supernatant was transferred into 1.5 ml microfuge tubes and sonicated (30 sec on, 45 sec off) on ice for 15 min. Suspension was centrifuged at 14k rpm for 15 min at 4°C and supernatant was transferred into 1.5 ml tubes.
Antibodies (Pol II, 8WG16 Abcam, 0.1μg/1μg of chromatin; H3K9me3 and H3k9me2 Abcam, 0.1μg/1μg of chromatin) were added to whole cell extracts and incubated over night at 4°C on rotating wheel. Agarose beads were added to cell extracts and incubated by rotation at 4°C, 2 hr. Beads were washed twice in ice cold buffer I, once in ice cold buffer II (50 mM Hepes/KOH pH 7.5, 500 mM NaCl, 1 mM EDTA pH 7.5, 1% Triton X-100, 0.1% sodium deoxycholate) and once in ice cold buffer III (10 mM Tris-HCl pH 8.0, 250 mM LiCl, 1 mM EDTA pH 7.5, 0.5% Nonidet P-40, 0.5% sodium deoxycholate). Beads were resuspended in 100 μl TE buffer (10mM Tris-Cl pH 7.6, 1 mM EDTA pH 7.5) containing 10 μg/ml RNase A and incubated for 15 min at 37°C. Cross-link reversal was performed in presence of 100 μg Proteinase K, over night at 65°C. Cross-linked chromatin was purified using phenol chloroform precipitation. PCR amplification of chromatin derived DNA employed primers specific to ura4 locus, including promoter, ORF or terminator regions. Signals are represented as average values from three biological repeats. Error was determined by standard deviation.
HeLa cell ChIP
Transfected cells were collected from 10 cm plates. Formaldehyde was added directly, at 20°C to tissue culture medium at 1%: 250 μl of 40% w/v, followed by incubation 10 min 20°C on gently shaking platform. Formaldehyde was inactivated by adding glycine to a final concentration of 0.125M. Medium was aspirated and cells washed twice with 5 ml ice cold PBS, containing protease and phosphatase inhibitors and scraped into 2 ml tubes. Samples were centrifuged for 4 min, 2.8k rpm at 4°C. Cells were gently resuspended in 300 μl of cell lysis buffer [5mM PIPES, pH8.0; 85mM KCl; 0.5% nonidet P-40; 1mM PMSF; 1μg/ml pepstatin A; 1ug/ml leupeptin; 5mM sodium butyrate] and incubated on ice, 10 min. Nuclei were collected by centrifugation at 2.4k rpm at 4°C and resuspended in ice-cold 400ul nuclear lysis buffer (1% SDS, 10mM EDTA, 50mM Tris-HCl, pH8.0, 0.5mM PMSF, 0.8ug/ml pepstatin A, 1ug/ml leupeptin, 5mM sodium pyruvate), followed by incubation on ice for 10 min. Samples were sonicated to an average length of 300-500bp, keeping on ice- 12 × 2 watts (15 sec sonicate, 20 sec rest) and spun for 10 min, 13k rpm, 4°C to remove cell debris. Supernatant was diluted by adding IP dilution buffer (0.01% SDS, 1,1% Triton X100, 1.2mM EDTA, 16.7mM Tris-HCl pH 8.1, 167mN NaCl, 0.5mM PMSF, 0.8ug/ml pepstatin A, 1ug/ml leupeptin, 5mM sodium butyrate) and aliquoted into various IP samples. Antibodies were added to samples and incubated over night at 4°C on rotating wheel. Anti-Pol II (N20X) Santa Cruz; H3K9me3 and H3K9me2 Abcam, all used at 0.1μg/1μg of chromatin dilution. Immune complexes were pulled down with 60 μl of 50 protein A –agarose pre-blocked with salmon sperm DNA/ProtA (#16-157) from Upstate, followed by extensive washes with buffers A-D. A: 0.1% SDS, 1% Triton X-100, 2mM EDTA, 20mM Tris-HCl pH8.0, 150mM NaCl. B: 0.1% SDS, 1% Triton X-100, 2mM EDTA, 20mM Tris-HCl pH8.0, 500mM NaCl. C: 0.25M LiCl, 1% NP40, 1% sodium dexoycholate, 1mM EDTA, 10mM Tris-HCl pH8.0. D: 10:1 TE pH 8.0.
Immune complexes were eluted with 250 μl IP elution buffer (1% SDS, 0.1M NaHCO3) and spun down 3 min, 13k rpm. Reversal of cross links was performed by initially adding to 3 μg/ml RNaseA, 0.3M NaCl, at 65°C 4-5 hr, followed by addition of 10 μl of 0.5M EDTA, 20ul of 1M Tris-HCl, pH 6.5, 2 μl 10mg/ml proteinase K and incubation at 45.C for 2 hr. DNA was purified by Qiagen PCR clean up columns and eluted by 100ul of elution buffer. Signals represent average of three biological repeats expressed as % of input signal. Standard deviation was used to estimate error level.
Protein extraction
Cells were collected and pellet was resuspended in RIPA buffer (50 mM Tris-HCl, pH7.5, 150 mM NaCl, 5 mM EDTA, 1% NP-40, 0.25% DOC, 0.1% SDS), followed by 10 min incubation on ice. Cells debris was separated by 5 min centrifugation, 13k rpm at 4°C. Protein loading buffer was added to supernatant and samples were boiled prior to loading on precast bis-tris acrylamide gradient 4%-12% gels (Invitrogen).
Western blots employed the following antibodies: anti-γ–actin (Sigma) anti-tubulin (Sigma), anti-OAS1 (Abcam), anti-TDP43 (gift from Ashish Dhir), anti-dicer (Abcam) and anti-Hsp70 (Abcam) all at 1:1000 dilution.
RNA isolation and qRT-PCR
Total cell RNA from S.pombe, HeLa, HEK293 and mouse ES cells was isolated using phenol/chloroform or Trizol (Gibco) and dissolved in sterile water and treated with RNase-free DNase (Promega) for 30 min at 37°C. 100 ng of total RNA was reverse transcribed using Superscript III system (Invitrogen) with oligo(dT)15 or specific primers. cDNA was diluted to 100 μl in TE buffer and 10 μl was used for PCR. Genomic DNA was employed as positive control for primer pair efficiency. Results were quantified by real-time PCR with SYBR Green dye and Rotor-Gene 6 software. Nascent transcripts were detected by using RT primer in last exon of each gene (which is not included in the insert on CT plasmid) and probes in introns. PolyA+ transcripts were detected by using oligo(dT) with linker as RT primer and probes with specific forward primer in last exon and reverse primer corresponding to linker. Signals represent average value of three biological repeats and standard deviation determines error level. Signals were normalized to value of wt (S. pombe) or V transfected cells (HeLa or HEK293), set as 1. Signals are expressed as a fold change to wt or V transfected cells. Oligonucleotide positions and sequences of primers used in RT-PCR analyses are available on request to Authors.
p19 siRNA selection 18
Total RNA was incubated with 32P end labeled DNA oligonucleotides specific to ura4 or γ-ACT1 at 50°C, 1 hr. Short DNA:RNA hybrids were pull down using p19 protein bound to magnetic beads. Eluted hybrids were separated on 20% polyacrylamide gel and visualized by PhosphoImager.
J2 dsRNA pull down 27
J2 antibody (Scicon), 0.1μg/1μg of chromatin dilution, was incubated with cell extracts, 2 hr on rotating wheel in presence of protein G agarose beads. dsRNA was eluted from washed beads and analysed by qRT-PCR for γ-ACT1 or GAPDH sense and antisense transcripts. Signals were normalized to V transfected cells, set as value 1. These represent average signal from three biological repeats and standard deviation determines the level of error.
Immuno-depletion
Nuclear extract (Promega) was incubated with anti-Dicer antibody (13D6, Abcam, 0.1μg/1μg of chromatin dilution) in presence of Protein G beads at 4°C for 90 min. Beads with bound Dicer protein were removed from nuclear extracts.
In vitro transcription and RNA fractionation
DNA control templates + (390 nt RNA transcribed from CMV promoter on linearized DNA fragment), V (CT cassette with no insert) and CT (CTγACT1Ex4, long) were incubated with nuclear extract and dicer depleted nuclear extract in presence of α32P-UTP for 1 hr at 30°C. Total RNA was isolated by phenol/chloroform. Low molecular weight RNA was separated from high molecular weight RNA by 20% PEG8000/2M NaCl on ice, 30 min. Long RNA were treated with S1 or V1 nucleases, 10 min. at room temperature and separated on 6% PAGE gel. Small RNA was visualized on 20% PAGE gel.
Supplementary Material
Acknowledgements
We thank Thomas Gligoris for advice and encouragement and Eleanor White for help with HeLa cell culture and Joan Monks for cloning. This work was supported by grants from Cancer Research UK and the Wellcome Trust to NJP. CT mediated TGS as described in these studies is the subject of a Patent application filed by ISIS Innovation of Oxford University.
Footnotes
Author Contribution
MG performed all the experimental analyses. MG and NJP designed the experiments and wrote the manuscript.
References
- 1.Grewal SI. RNAi-dependent formation of heterochromatin and its diverse functions. Curr Opin Genet Dev. 2010;20:134–141. doi: 10.1016/j.gde.2010.02.003. [DOI] [PMC free article] [PubMed] [Google Scholar]
- 2.Baulcombe D. RNA silencing in plants. Nature. 2004;431:356–363. doi: 10.1038/nature02874. [DOI] [PubMed] [Google Scholar]
- 3.Bartel DP. MicroRNAs: target recognition and regulatory functions. Cell. 2009;136:215–233. doi: 10.1016/j.cell.2009.01.002. [DOI] [PMC free article] [PubMed] [Google Scholar]
- 4.Verdel A, Vavasseur A, Le Gorrec M, Touat-Todeschini L. Common themes in siRNA-mediated epigenetic silencing pathways. Int J Dev Biol. 2009;53:245–257. doi: 10.1387/ijdb.082691av. [DOI] [PubMed] [Google Scholar]
- 5.Carthew RW, Sontheimer EJ. Origins and Mechanisms of miRNAs and siRNAs. Cell. 2009;136:642–655. doi: 10.1016/j.cell.2009.01.035. [DOI] [PMC free article] [PubMed] [Google Scholar]
- 6.Hutvagner G, Simard MJ. Argonaute proteins: key players in RNA silencing. Nat Rev Mol Cell Biol. 2008;9:22–32. doi: 10.1038/nrm2321. [DOI] [PubMed] [Google Scholar]
- 7.Buhler M, Moazed D. Transcription and RNAi in heterochromatic gene silencing. Nat Struct Mol Biol. 2007;14:1041–1048. doi: 10.1038/nsmb1315. [DOI] [PubMed] [Google Scholar]
- 8.Gullerova M, Proudfoot NJ. Cohesin complex promotes transcriptional termination between convergent genes in S. pombe. Cell. 2008;132:983–995. doi: 10.1016/j.cell.2008.02.040. [DOI] [PubMed] [Google Scholar]
- 9.Gullerova M, Moazed D, Proudfoot NJ. Autoregulation of convergent RNAi genes in fission yeast. Genes Dev. 25:556–568. doi: 10.1101/gad.618611. [DOI] [PMC free article] [PubMed] [Google Scholar]
- 10.Gu SG, et al. Amplification of siRNA in Caenorhabditis elegans generates a transgenerational sequence-targeted histone H3 lysine 9 methylation footprint. Nat Genet. 2012;44:157–164. doi: 10.1038/ng.1039. [DOI] [PMC free article] [PubMed] [Google Scholar]
- 11.Kavi HH, Fernandez H, Xie W, Birchler JA. Genetics and biochemistry of RNAi in Drosophila. Curr Top Microbiol Immunol. 2008;320:37–75. doi: 10.1007/978-3-540-75157-1_3. [DOI] [PubMed] [Google Scholar]
- 12.Wang Z, Morris JC, Drew ME, Englund PT. Inhibition of Trypanosoma brucei gene expression by RNA interference using an integratable vector with opposing T7 promoters. J Biol Chem. 2000;275:40174–40179. doi: 10.1074/jbc.M008405200. [DOI] [PubMed] [Google Scholar]
- 13.Alibu VP, Storm L, Haile S, Clayton C, Horn D. A doubly inducible system for RNA interference and rapid RNAi plasmid construction in Trypanosoma brucei. Mol Biochem Parasitol. 2005;139:75–82. doi: 10.1016/j.molbiopara.2004.10.002. [DOI] [PubMed] [Google Scholar]
- 14.Shi H, et al. Genetic interference in Trypanosoma brucei by heritable and inducible double-stranded RNA. RNA. 2000;6:1069–1076. doi: 10.1017/s1355838200000297. [DOI] [PMC free article] [PubMed] [Google Scholar]
- 15.Giordano E, Rendina R, Peluso I, Furia M. RNAi triggered by symmetrically transcribed transgenes in Drosophila melanogaster. Genetics. 2002;160:637–648. doi: 10.1093/genetics/160.2.637. [DOI] [PMC free article] [PubMed] [Google Scholar]
- 16.Tran N, Cairns MJ, Dawes IW, Arndt GM. Expressing functional siRNAs in mammalian cells using convergent transcription. BMC Biotechnol. 2003;3:21. doi: 10.1186/1472-6750-3-21. [DOI] [PMC free article] [PubMed] [Google Scholar]
- 17.Clemens MJ. PKR--a protein kinase regulated by double-stranded RNA. Int J Biochem Cell Biol. 1997;29:945–949. doi: 10.1016/s1357-2725(96)00169-0. [DOI] [PubMed] [Google Scholar]
- 18.Jin J, Cid M, Poole CB, McReynolds LA. Protein mediated miRNA detection and siRNA enrichment using p19. Biotechniques. 2010;48:xvii–xxiii. doi: 10.2144/000113364. [DOI] [PubMed] [Google Scholar]
- 19.Simmer F, et al. Hairpin RNA induces secondary small interfering RNA synthesis and silencing in trans in fission yeast. EMBO Rep. 11:112–118. doi: 10.1038/embor.2009.273. [DOI] [PMC free article] [PubMed] [Google Scholar]
- 20.Urosevic N. Is flavivirus resistance interferon type I-independent? Immunol Cell Biol. 2003;81:224–229. doi: 10.1046/j.1440-1711.2003.01156.x. [DOI] [PubMed] [Google Scholar]
- 21.Bridge AJ, Pebernard S, Ducraux A, Nicoulaz AL, Iggo R. Induction of an interferon response by RNAi vectors in mammalian cells. Nat Genet. 2003;34:263–264. doi: 10.1038/ng1173. [DOI] [PubMed] [Google Scholar]
- 22.Haussecker D, Proudfoot NJ. Dicer-dependent turnover of intergenic transcripts from the human beta-globin gene cluster. Mol Cell Biol. 2005;25:9724–9733. doi: 10.1128/MCB.25.21.9724-9733.2005. [DOI] [PMC free article] [PubMed] [Google Scholar]
- 23.Fukagawa T, et al. Dicer is essential for formation of the heterochromatin structure in vertebrate cells. Nat Cell Biol. 2004;6:784–791. doi: 10.1038/ncb1155. [DOI] [PubMed] [Google Scholar]
- 24.Sinkkonen L, Hugenschmidt T, Filipowicz W, Svoboda P. Dicer is associated with ribosomal DNA chromatin in mammalian cells. PLoS One. 5:e12175. doi: 10.1371/journal.pone.0012175. [DOI] [PMC free article] [PubMed] [Google Scholar]
- 25.Cobb BS, et al. T cell lineage choice and differentiation in the absence of the RNase III enzyme Dicer. J Exp Med. 2005;201:1367–1373. doi: 10.1084/jem.20050572. [DOI] [PMC free article] [PubMed] [Google Scholar]
- 26.Premsrirut PK, et al. A rapid and scalable system for studying gene function in mice using conditional RNA interference. Cell. 2011;145:145–158. doi: 10.1016/j.cell.2011.03.012. [DOI] [PMC free article] [PubMed] [Google Scholar]
- 27.Schonborn J, et al. Monoclonal antibodies to double-stranded RNA as probes of RNA structure in crude nucleic acid extracts. Nucleic Acids Res. 1991;19:2993–3000. doi: 10.1093/nar/19.11.2993. [DOI] [PMC free article] [PubMed] [Google Scholar]
- 28.Maida Y, Masutomi K. RNA-dependent RNA polymerases in RNA silencing. Biol Chem. 392:299–304. doi: 10.1515/BC.2011.035. [DOI] [PubMed] [Google Scholar]
- 29.Buhler M, Verdel A, Moazed D. Tethering RITS to a nascent transcript initiates RNAi- and heterochromatin-dependent gene silencing. Cell. 2006;125:873–886. doi: 10.1016/j.cell.2006.04.025. [DOI] [PubMed] [Google Scholar]
- 30.Iida T, Nakayama J, Moazed D. siRNA-mediated heterochromatin establishment requires HP1 and is associated with antisense transcription. Mol Cell. 2008;31:178–189. doi: 10.1016/j.molcel.2008.07.003. [DOI] [PMC free article] [PubMed] [Google Scholar]
- 31.Shinagawa T, Ishii S. Generation of Ski-knockdown mice by expressing a long double-strand RNA from an RNA polymerase II promoter. Genes Dev. 2003;17:1340–1345. doi: 10.1101/gad.1073003. [DOI] [PMC free article] [PubMed] [Google Scholar]
- 32.Nejepinska J, et al. dsRNA expression in the mouse elicits RNAi in oocytes and low adenosine deamination in somatic cells. Nucleic Acids Res. 2012;40:399–413. doi: 10.1093/nar/gkr702. [DOI] [PMC free article] [PubMed] [Google Scholar]
- 33.Morris KV, Chan SW, Jacobsen SE, Looney DJ. Small interfering RNA-induced transcriptional gene silencing in human cells. Science. 2004;305:1289–1292. doi: 10.1126/science.1101372. [DOI] [PubMed] [Google Scholar]
- 34.Seila AC, et al. Divergent transcription from active promoters. Science. 2008;322:1849–1851. doi: 10.1126/science.1162253. [DOI] [PMC free article] [PubMed] [Google Scholar]
- 35.Core LJ, Lis JT. Transcription regulation through promoter-proximal pausing of RNA polymerase II. Science. 2008;319:1791–1792. doi: 10.1126/science.1150843. [DOI] [PMC free article] [PubMed] [Google Scholar]
- 36.Preker P, et al. RNA exosome depletion reveals transcription upstream of active human promoters. Science. 2008;322:1851–1854. doi: 10.1126/science.1164096. [DOI] [PubMed] [Google Scholar]
- 37.Janowski BA, Corey DR. Inhibiting transcription of chromosomal DNA using antigene RNAs. Nucleic Acids Symp Ser (Oxf) 2005:367–368. doi: 10.1093/nass/49.1.367. [DOI] [PubMed] [Google Scholar]
- 38.Janowski BA, et al. Activating gene expression in mammalian cells with promoter-targeted duplex RNAs. Nat Chem Biol. 2007;3:166–173. doi: 10.1038/nchembio860. [DOI] [PubMed] [Google Scholar]
- 39.Yue X, et al. Transcriptional regulation by small RNAs at sequences downstream from 3′ gene termini. Nat Chem Biol. 2010;6:621–629. doi: 10.1038/nchembio.400. [DOI] [PMC free article] [PubMed] [Google Scholar]
- 40.Allo M, et al. Control of alternative splicing through siRNA-mediated transcriptional gene silencing. Nat Struct Mol Biol. 2009;16:717–724. doi: 10.1038/nsmb.1620. [DOI] [PubMed] [Google Scholar]
- 41.Tufarelli C, et al. Transcription of antisense RNA leading to gene silencing and methylation as a novel cause of human genetic disease. Nat Genet. 2003;34:157–165. doi: 10.1038/ng1157. [DOI] [PubMed] [Google Scholar]
- 42.Carlile M, et al. Strand selective generation of endo-siRNAs from the Na/phosphate transporter gene Slc34a1 in murine tissues. Nucleic Acids Res. 2009;37:2274–2282. doi: 10.1093/nar/gkp088. [DOI] [PMC free article] [PubMed] [Google Scholar]
- 43.Clemens MJ, Elia A. The double-stranded RNA-dependent protein kinase PKR: structure and function. J Interferon Cytokine Res. 1997;17:503–524. doi: 10.1089/jir.1997.17.503. [DOI] [PubMed] [Google Scholar]
- 44.Ashe HL, Monks J, Wijgerde M, Fraser P, Proudfoot NJ. Intergenic transcription and transinduction of the human beta-globin locus. Genes Dev. 1997;11:2494–2509. doi: 10.1101/gad.11.19.2494. [DOI] [PMC free article] [PubMed] [Google Scholar]
- 45.Mattick JS. The genetic signatures of noncoding RNAs. PLoS Genet. 2009;5:e1000459. doi: 10.1371/journal.pgen.1000459. [DOI] [PMC free article] [PubMed] [Google Scholar]
- 46.Tam OH, et al. Pseudogene-derived small interfering RNAs regulate gene expression in mouse oocytes. Nature. 2008;453:534–538. doi: 10.1038/nature06904. [DOI] [PMC free article] [PubMed] [Google Scholar]
- 47.Werner A, Sayer JA. Naturally occurring antisense RNA: function and mechanisms of action. Curr Opin Nephrol Hypertens. 2009;18:343–349. doi: 10.1097/MNH.0b013e32832cb982. [DOI] [PubMed] [Google Scholar]
- 48.Faghihi MA, Wahlestedt C. Regulatory roles of natural antisense transcripts. Nat Rev Mol Cell Biol. 2009;10:637–643. doi: 10.1038/nrm2738. [DOI] [PMC free article] [PubMed] [Google Scholar]
- 49.Kaneko H, et al. DICER1 deficit induces Alu RNA toxicity in age-related macular degeneration. Nature. 471:325–330. doi: 10.1038/nature09830. [DOI] [PMC free article] [PubMed] [Google Scholar]
- 50.Giles KE, Ghirlando R, Felsenfeld G. Maintenance of a constitutive heterochromatin domain in vertebrates by a Dicer-dependent mechanism. Nat Cell Biol. 12:94–99. doi: 10.1038/ncb2010. sup pp 91-96. [DOI] [PMC free article] [PubMed] [Google Scholar]
- 51.Turner AM, Morris KV. Controlling transcription with noncoding RNAs in mammalian cells. Biotechniques. 2010;48:ix–xvi. doi: 10.2144/000113442. [DOI] [PubMed] [Google Scholar]
Associated Data
This section collects any data citations, data availability statements, or supplementary materials included in this article.