Abstract
Near infrared spectroscopy (NIRS) has been successfully used for non-invasive diagnosis of diseases and abnormalities where water spectral patterns are found to play an important role. The present study investigates water absorbance patterns indicative of estrus in the female giant panda. NIR spectra of urine samples were acquired from the same animal on a daily basis over three consecutive putative estrus periods. Characteristic water absorbance patterns based on 12 specific water absorbance bands were discovered, which displayed high urine spectral variation, suggesting that hydrogen-bonded water structures increase with estrus. Regression analysis of urine spectra and spectra of estrone-3-glucuronide standard concentrations at these water bands showed high correlation with estrogen levels. Cluster analysis of urine spectra grouped together estrus samples from different years. These results open a new avenue for using water structure as a molecular mirror for fast estrus detection.
The habitat of giant panda is confined to south-central China, and limited to six isolated mountain ranges (Minshan, Qinling, Qionglai, Liangshan, Daxiangling, and Xiaoxiangling). The total wild population is estimated at between 1,000 and 2,000, although estimations differ among surveys1. Due to its restricted and degraded habitat, as well as hunting by humans, the giant panda was categorized as “Endangered” in the 2011 IUCN Red List of Threatened Species2. Thus, to maintain the population, captive breeding must be carried out. In the 1980s the captive population consisted predominantly of wild-born animals. However, as conservation efforts for giant pandas have increased, the number of captive-born animals has exceeded the number of wild-caught animals in captivity since 19973. In Japan, reproduction of the giant panda began at Ueno Zoological Gardens in Tokyo in 1972. Successful reproduction of giant panda was achieved using artificial insemination (AI)4. Although captive breeding has improved worldwide since the 1980s, only a small proportion of captive females reproduce each year.
Reproduction is inefficient because females are monoestrus, with spontaneous ovulation during the breeding season between February and June5. Accurate monitoring of the estrus status to pinpoint the timing of ovulation is critical for successful artificial insemination. Enzyme immunoassay (EIA) or radioimmunoassay have traditionally been used to estimate the optimal ovulation timing by monitoring estrogens in the blood, urine or feces of females6,7. Fecal excretions are the most appropriate source for non-invasive sampling8. However, these analyses take about 1 day to process and require expensive reagents or radioactive isotopes.
Recently, near infrared (NIR) spectroscopy has been demonstrated to be a useful tool in various fields for non-invasive, rapid, and chemical-free diagnosis9,10,11,12. In the area of animal health monitoring, NIR spectroscopy has been used successfully to diagnose mastitis of dairy cows13. NIR spectroscopy of vulvae and vestibules has been applied for detecting estrus in cows14. However, there have been few reports concerning the analysis of hormones by NIR spectroscopy15,16,17.
Infrared (IR) spectroscopy could measure absorbance of a single water molecule, or a number of water molecules18,19,20. However, longer path length water samples cannot be analyzed with IR because of the immense absorbance. The NIR spectra consist of overtones and combination bands of the fundamental molecular vibrations found in the mid infrared region. Since the absorbance intensity in the overtone regions is 100–1000 times weaker and because of overlapping bands the same results might not be obtained by NIR spectroscopy, which requires multivariate spectral data analysis for information extraction, but information wise it is much richer. On the other hand, the weakness of the NIR signal becomes an asset when analyzing biological samples containing significant amount of water. Since in the NIR region various water molecular conformations are presented by respective absorbance bands, NIR spectroscopy can detect even subtle changes related to water21,22,23. In essence, NIR spectroscopy has the potential to assess complex biological systems through the prism of its “host” water structure perturbed by surrounding molecules. Other advantages of NIR spectroscopy when compared to IR spectroscopy are its robustness and inexpensive equipment.
A new approach proposed by Tsenkova, called “aquaphotomics”11,24, utilizes water–light interaction at various frequencies, described as a spectrum, to mirror the changes with the rest of the molecules of the system. Multivariate analysis of these spectra focuses on water hydrogen bonds in biological systems under various perturbations to relate water spectral patterns to respective biological systems11,13,23,25. In a series of experiments, NIR spectra were collected, and regression models of respective perturbations were analyzed to elucidate the existence of common water bands in various biological systems such as cells cultured under oxidative stress or in the presence of environmental hormones, and the body fluids of healthy and mastitic cows13,26. From these results, it was discovered that specific water absorbance bands, called “water matrix coordinates” (WAMACs), arise consistently in specific biological systems11. The combinations of WAMACs and their respective absorbance values define the “water spectral patterns” (WASP) in regression models predicting the investigated perturbations.
We have published a paper27 where we have showed that urinary NIR spectra in wide NIR wavelength range (1100−2432 nm) coupled with regression analysis had the potential to estimate the estrus status in a female giant panda. It has been reported that very low concentrations of a solute could be measured when only the water absorbance wavelength range in the first overtone region (1300–1600 nm) is used to develop regression model11. In the present study, NIR spectra of urine samples from giant panda were analyzed in the range of 1300–1600 nm. The present work aimed to identify the water absorbance bands, WAMACs, related to the estrus status of the animals and to evaluate whether specific spectral changes in the WASP could be used as a biomarker for estrus diagnosis.
Results
Urinary estrone-3-glucuronide (E1G) concentrations
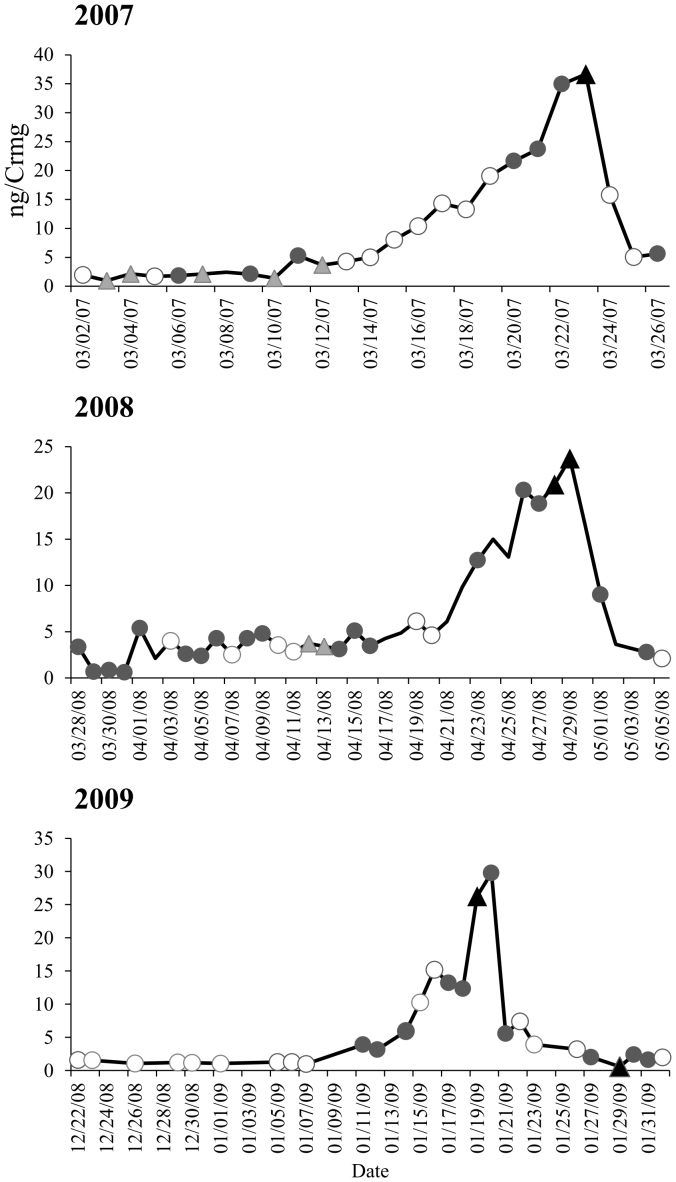
Urinary E1G was found to be in concentrations ranged from: 0.96–36.66 (year 2007), 0.59–23.72 (year 2008), and 0.58–29.80 (year 2009) ng/Crmg (Fig. 1). The E1G concentrations in urine peaked on March 23 2007, April 29 2008, and January 20 2009 indicating the estrus periods. Panda became pregnant and gave birth in both 2007 (stillbirth) and 2008 (live birth), while in 2009 she could not conceive and developed a pseudopregnancy.
Figure 1. Urinary daily-averaged estrone-3-glucuronide (E1G) concentrations in a female giant panda measured by enzyme immunoassay (EIA).
Each point (○: Group 1, ▴: Group 2, • : Group 3, ▴: Estrus Group 4) represents one of the 4 clusters classified by hierarchical cluster analysis (see Fig. 5).
Water matrix coordinates (WAMACs) related to estrus
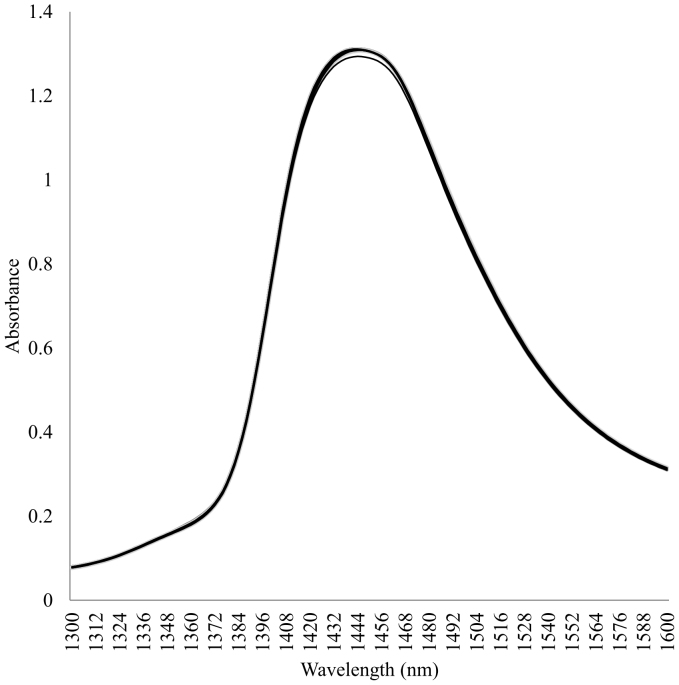
The urinary daily-averaged raw spectra for three years (n = 157) are shown in Fig. 2. These spectra had similar patterns to the spectrum of ultrapure water.
Figure 2. Urinary daily-averaged raw spectra in a female giant panda in the range of 1300–1600 nm.
These spectra were treated with transformation of mean centering and multiplicative scatter correction (n = 157).
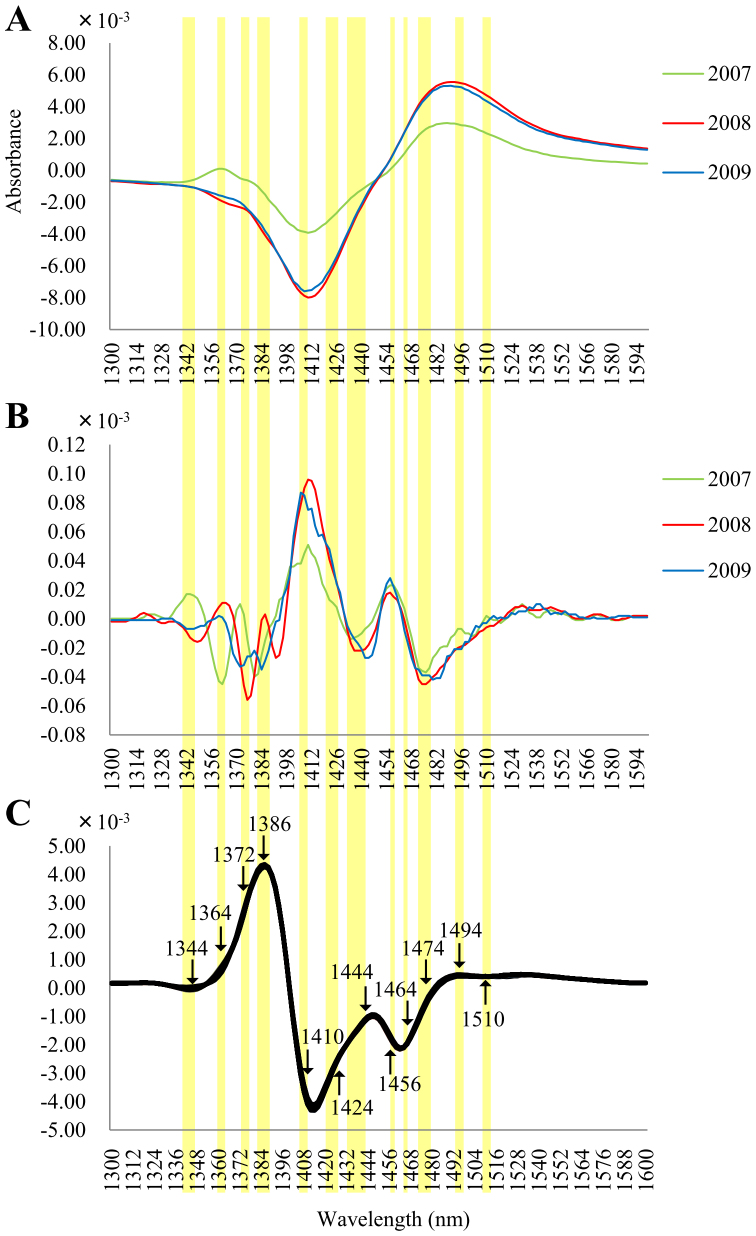
The difference spectra between the three-day average around the E1G peak (estrus state) in each year's spectrum and the rest of the spectra are shown in Fig. 3A. From the second-derivative spectra (Fig. 3B), 12 characteristic wavelength ranges showing strong absorbance related to estrus (1342–1348, 1360–1364, 1372–1376, 1380–1386, 1406–1410, 1422–1428, 1434–1444, 1456–1458, 1462–1464, 1474–1480, 1492–1496, and 1510–1514 nm) were found by reference to the 12 characteristic water wavelength ranges reported by Tsenkova11. In addition, from the second-derivative spectra of 3 years' samples (Fig. 3C), 12 water absorbance bands showing high standard deviation in each of the 12 characteristic wavelength ranges were found (1344, 1364, 1372, 1386, 1410, 1424, 1444, 1456, 1464, 1474, 1494, and 1510 nm). These wavelengths were selected as the WAMACs relevant to estrus detection.
Figure 3. Water matrix coordinates (WAMACs) related to the estrus in a female giant panda.
(A) Smoothed raw difference spectra of urine calculated as the difference between averaged spectra from the previous to the next day of the E1G peak and the other averaged spectra. (B) Second-derivative spectra of (A). The areas colored in light yellow represent the 12 characteristic water wavelength ranges. (C) Second-derivative spectra of 3 years' urine samples after smoothing. From this plot, 12 absorbance bands were selected as WAMACs.
Partial least square regression (PLSR) of estrone-3-glucuronide (E1G) spectra using standard solution
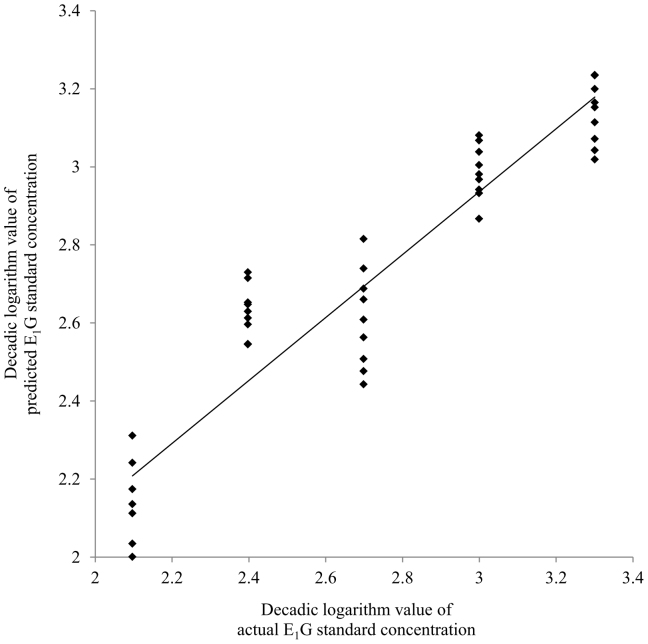
The PLSR of E1G standard spectra was calculated using only the absorbance values at the WAMACs. The result of PLSR showing the relation between actual and predicted E1G standard concentrations is illustrated in Fig. 4. The coefficient of determination, R2, based on leave-one-out cross validation was 0.93, and the SEV was 0.16 ng/ml using 1 optimal PLS factor (percent was 76%). The plot reveals a good correspondence between predicted values and actual E1G concentrations.
Figure 4. Relationship between actual and predicted estrone-3-glucuronide (E1G) concentrations by partial least square regression (PLSR) of the absorbance values of E1G standard spectra at the water matrix coordinates (WAMACs).
Actual E1G concentrations (125–2000 pg/ml) were transformed into decadic logarithm values (2.1–3.3) and these values were used for PLSR as reference values. Each point shows an E1G standard spectrum.
Partial least square regression (PLSR) of estrone-3-glucuronide (E1G) using urine spectra
The PLSR of urine spectra using only the absorbance values at the 12 WAMACs showed high accuracy between actual and predicted urinary E1G concentrations, The coefficient of determination, R2, was 0.64, and the SEP was 5.99 ng/ml using five optimal PLS factors (cumulative percent was 99.8%). When PLSR was calculated using the whole urinary spectral data in the range of 1300–1600 nm, the accuracy was much lower. The coefficient of determination, R2 was 0.35, and the SEP was 6.09 ng/ml using 11 optimal PLS factor (cumulative percent was 99.98%).
Hierarchical cluster analysis (HCA) of urinary spectra
Hierarchical Cluster Analysis of the absorbance values at the 12 WAMACs was conducted to show whether or not the samples were clustered according to estrus status. Dendrogram classification was employed using Euclidean distance and complete-link clustering algorithm.
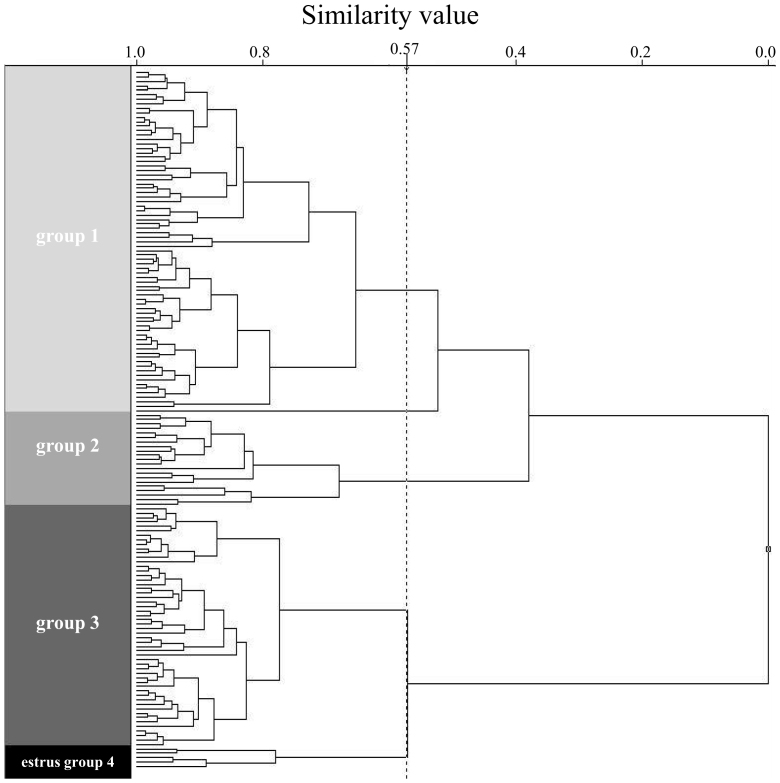
The HCA dendrogram of all urine spectra for three consecutive years produced four clusters when the similarity values (between 0 and 1) was set at 0.38 and 0.57 (Fig. 5). The average E1G concentrations of samples in clusters (mean ± SEM) were as follows: group 1, 5.4 ± 0.9 ng/Crmg (n = 33, 41% of all E1G measured samples); group 2, 2.5 ± 0.4 ng/Crmg (n = 7, 9% of samples); group 3, 8.0 ± 1.5 ng/Crmg (n = 35, 44% of samples); estrus group 4, 21.6 ± 5.4 ng/Crmg (n = 5, 6% of samples). Samples containing high E1G concentrations were clustered in group 4, called the “estrus group”. The five samples clustered in the estrus group 4 were collected on March 23, 2007; April 28 and 29, 2008; and January 19 and 29, 2009 (closed triangles in Fig. 1). Except for the sample taken on January 29 2009, all other samples in this cluster were collected 1 day before or on the day of the E1G peak.
Figure 5. Dendrogram of hierarchical cluster analysis (HCA) of urinary spectra from a female giant panda.
The absorbance values at water matrix coordinates (WAMACs) were normalized by auto-scaling and used for this analysis. The two values in the dendrogram represent the levels of similarity between groups 1 and 2, and between groups 3 and estrus group 4.
Aquagram
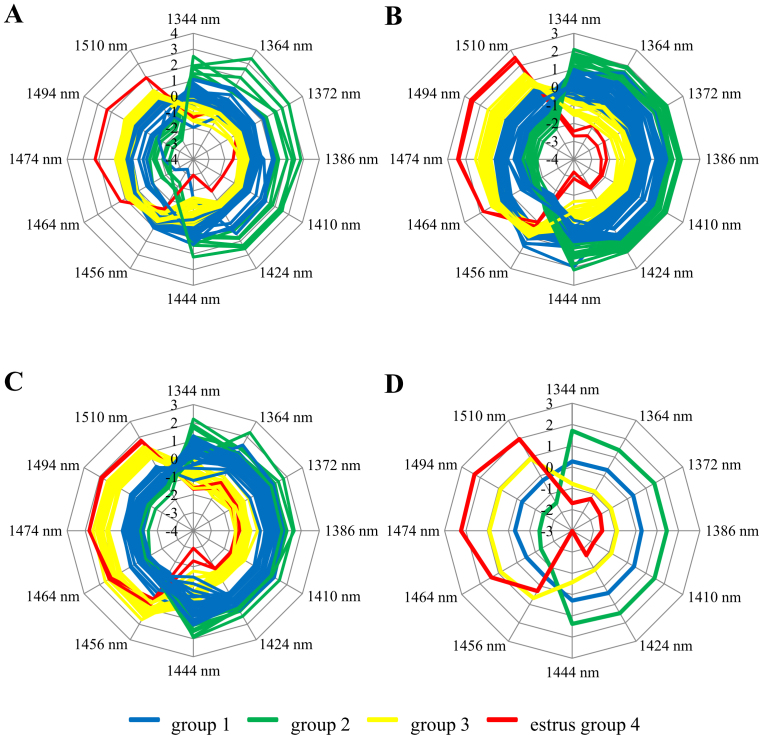
A newly designed star-chart, called an “aquagram”28, was devised to visualize WASP at different estrus statuses. The aquagram displays normalized absorbance values at several water bands on the axes originating from the center of the graph. Absorbance values at the WAMACs were placed on the respective radial axes. The relationship between estrus status and WASP was examined by comparing aquagrams for the days of high and low E1G values. Aquagrams of each analyzed sample were compiled for each year (Fig. 6 A: 2007, B: 2008, C: 2009, and D: aquagram of the median value of each HCA cluster). The aquagram for the median value of group 1 was the most balanced, with a similar absorbance ratio at all wavelengths (Fig. 6D). On the aquagram of median value for the estrus group 4, the values at 1464, 1474, 1494, and 1510 nm, characteristic bands of hydrogen bonded water, were significantly higher, but the values at 1344, 1386, 1410, 1424 and 1444 nm, characteristic bands of less hydrogen bonded water, were lower compared with other groups (P<0.05). In contrast, the aquagram of group 2, representing samples containing the lowest E1G concentrations, median values at 1344, 1364, 1372, 1386, 1410, 1424, and 1444 nm were significantly higher, and at 1456, 1464, 1474, 1494, and 1510 nm were lower, when compared with other groups (P<0.05).
Figure 6. Aquagrams based on urine spectra from a female giant panda in each year (A: 2007, B: 2008, and C: 2009) and the aquagram of median values (D) of the groups classified by hierarchical cluster analysis (HCA).
Normalized absorbance values at the water matrix coordinates (WAMACs) (1344, 1364, 1372, 1386, 1410, 1424, 1444, 1456, 1464, 1474, 1494, and 1510 nm) were plotted on each axis. The colors in the aquagrams correspond to groups 1, 2, 3 and estrus group 4 classified by HCA (see Fig. 5).
Discussion
Aquaphotomics was proposed as a systematic method of bio analysis and diagnosis utilizing water as a matrix through which a database of water absorbance bands and patterns could be compiled11. In a first practical application it was found that, from the spectra of milk from healthy and mastitic cows, free water molecules from diseased and healthy cows had a different impact on the overall WASP13,24,26. In addition, it has been reported that the absorbance area of the water solvation shell which is the hydration sphere of water molecules surrounding other molecules in the solution is important for the diagnostic discrimination of healthy and mosaic virus-infected soybean plants during the latent stage of disease29. These findings indicate that changes in the molecular conformation of the water matrix reflect specific perturbations in the host subject. In the present study, it was found that the status of estrus in the giant panda correlated with increased hydrogen-bonded water structures in urine .
Wavelength ranges related to estrus were determined from the difference between urinary spectra around the E1G peak and all others, based on the 12 characteristic water wavelength ranges reported by Tsenkova11. Within each of these wavelength ranges, 12 absorbance bands were selected as the WAMACs indicative of estrus. The results of PLSR using E1G standard spectra and urinary spectra, at the WAMACs, showed a good corelation between actual and predicted E1G concentrations. However the PLSR accuracy in case of urinary spectra was comparatively lower than that in case of E1G standard spectra. We considered that individual differences or impurities which were not seen in E1G standard disturbed constructing of a good regression model. Nevertheless, it was suggested that such inhibitions were reduced by using only values at WAMACs thought to include the information of E1G concentration, i.e. estrus. From this, it appears that the spectral changes at the WAMACs reflect the change of E1G concentration in the sample. Furthermore, HCA of urinary spectra clustered the samples around the E1G peak into a single group. Therefore, urinary NIR spectra contain the necessary information to reflect changes in E1G, i.e., the occurrence of estrus in the giant panda. However, there was one discrepancy in the data where the sample taken on January 29, 2009 was clustered into the estrus group 4. In 2009, the female showed increased urinary E1G concentrations in January. In general, non-lactating female giant pandas experience a single estrus during the spring30. It is thought that this unusual winter estrus could account for the discrepancy from other years, though it is difficult to identify the causative factors.
In the aquagrams, urinary samples with high E1G concentrations showed a significant difference (higher absorbance values at 1464, 1474, 1494, and 1510 nm; and lower absorbance at 1344, 1386, 1410, 1424, and 1444 nm) from the other samples with lower E1G concentrations. The conformation of water molecules and their respective hydrogen bonds have previously been assigned in the IR range18,20,31. Their calculated overtones are consistent with the spectral data acquired in the NIR range (1300–1600 nm), where each of the 12 characteristic water wavelength ranges are characterized as follows11,32: 1336–1348 nm (ν3), 1360–1366 nm (OH-(H2O)1,2,4), 1370–1376 nm (ν1+ν3), 1380–1388 nm (OH-(H2O)1,4 and O2-(H2O)4), 1398-1418 nm (S0), 1421–1430 nm (H-OH bend and O-H•••O), 1432–1444 nm (S1), 1448–1454 nm (OH-(H2O)4,5), 1458–1468 nm (S2), 1472–1482 nm (S3), 1482–1495 nm (S4), and 1506–1516 nm (ν1, ν2). The hydrogen bonds listed above may be described as follows: ν shows OH stretching vibrations of hydrogen-bonded water molecules (ν1, symmetrical stretching fundamental vibration; ν2, doubly degenerate bending fundamental; ν3, H2O antisymmetrical stretching vibration); S represents the number of hydrogen bonds, e.g., S0 stands for the free water molecular species33. Water structure contains both weak hydrogen-bonded structures of water molecules (bands at shorter wavelengths) and strong hydrogen-bonded ones (bands at longer wavelengths)34,35,36. Therefore, the results of the present study show that levels of strong hydrogen-bonded water (S2, S3, and S4) increases, and those of weak hydrogen-bonded water (S0 and S1) decreases in urine samples around the E1G peak, i.e., around ovulation. We propose that only absorbance changes of NIR spectra at these water absorbance bands can detect a change in E1G concentration, i.e., estrus status.
In conclusion, the present study suggests that the water structure of urine samples measured as a spectral pattern works as a mirror on a molecular level and could be applied for fast and non-invasive detection of estrus. Further investigations on the giant panda, and other species are required to widen this proposed new approach for estrus detection.
Methods
Animal and urine sampling
Samples for this study were taken from a single female giant panda (International studbook #434), born on September 16, 1995 and housed at the Kobe Municipal Oji Zoo. Daily urine samples were collected March 2-April 21, 2007 (n = 63), March 28-May 31, 2008 (n = 57), and December 19, 2008-March 10, 2009 (n = 79). Urine excreted during the night was collected on the subsequent morning, and urine excreted during the day was collected immediately after urination. These samples were centrifuged for 4 min at 650×g immediately after collection, and the supernatants were stored at −40°C until estrone-3-glucuronide (E1G) assay and spectral analysis. All procedures and management for the giant panda were in accordance with the Code of Ethics of the Japanese Association of Zoos and Aquariums (JAZA) by JAZA, and the management guideline for the giant panda by the institution. Also, China Conservation and Research Center for the Giant Panda and Kobe Municipal Oji Zoo gave approval to conduct the experiments.
Urinary estrone-3-glucuronide (E1G) assays
In the measurement of urinary E1G concentration by EIA, the samples collected around ovulation period were used; March 2–26, 2007 (n = 52), March 28-May 5, 2008 (n = 52), and December 22, 2008-February 1, 2009 (n = 50). The urinary concentration of E1G, the major estrogen excreted in the urine during estrus of the giant panda3, was measured by EIA.
The E1G assay was carried out using the double antibody method. The urine was diluted with EIA buffer prepared with 0.15 M NaCl, 0.04 M Na2HPO4, and 0.1% bovine serum albumin (01-2030; Sigma-Aldrich Co., Tokyo, Japan; pH 7.2) and duplicate 20 μl aliquots of this solution were added to 96-well plates bound with goat anti-rabbit IgG (H+L) (270335; Seikagaku Biobusiness Co., Tokyo, Japan). To obtain a standard curve, E1G diluted with the EIA buffer in the range 0.015625-2 ng/ml were also dispensed into the wells in duplicate. Immediately after the addition of 100 μl anti- E1G antiserum (dilution: ×50,000,000, FKA224E; Cosmo Bio Co., Ltd., Tokyo, Japan) antiserums, and an equal volume of horseradish peroxidase conjugated E1G (dilution: ×500,000, FKA223; Cosmo Bio Co., Ltd.), the plates were incubated in the dark for 2 h at 20°C. Free-bound separation was achieved by emptying the plate and washing 4 times with 0.05% (v/v) Tween-80 (P1754; Sigma-Aldrich Co.) solution. A mixture of 75 μl substrate buffer solution A (0.01 M urea hydrogen peroxide, 0.1 M Na2HPO4, and 0.05 M citric acid) and 75 μl of solution B (0.002 M 3,3′,5,5′,-tetra methyl benzidine, 4% (v/v) dimethyl sulfoxide, and 0.05 M citric acid) was added to each well, followed by incubation for 40 min at 37°C in the dark. The reaction was terminated by the addition of 4 N H2SO4 (50 μ1) and the absorbance at 450 nm was measured using a microplate reader (Model550; BIO-RAD Laboratories Inc., Benicia, CA, USA). The values for all the steroids were expressed as the means of duplicate determinations, corrected for extraction recovery. The polyclonal anti- E1G antiserum was raised in rabbits against estrone-3-glucuronide-BSA and cross-reacted with estrone 100%, E1G 170%, estrone-3-sulfate 25%, estradiol 1%, estriol 0.1%, estradiol-3-glucuronide 1%, estradiol-3-sulfate 0.1%, testosterone 0.05%, 4-androstenediol 0.07%, progesterone, cortisol, and 17-α-OH-progesterone 0% (referenced from the data seat by Cosmo Bio Co., Ltd.). The urinary creatinine concentration was measured using a modified Jaffe's reaction. Briefly, each urine sample and creatinine standard (the creatinine powder dissolved with 0.1 N HCl to a concentration of 1 mg/ml) was diluted 101-fold with ultrapure water and were assayed with 4 replicates in a 96-well microplate. One hundred microliters of ultrapure water (blank)/samples/standard were added to each well, and then 50 μl of 0.75 N NaOH and 50 μl of 0.04 N picric acid were added to each well. The plate was then placed in a microplate reader (Model550; BIO-RAD Laboratories Inc.) for 15 min before reading at 490 and 630 nm. The creatinine concentrations (mg/ml) of samples were calculated by comparison between the absorbance of the samples and that of standard. Finally, the concentrations of E1G were calculated as ng/mg of creatinine (Crmg). All data are shown as daily-averaged values. The intra (3-wells within a plate) and inter-assay (6 plates) coefficients of variation were 5 and 15%, respectively.
Spectral acquisition
NIR transmittance spectra of urine samples and E1G standards serial diluted with ultrapure water in the range of 125-2000 pg/ml were measured using a full-range spectrometer (NIR systems 6500; Foss NIR systems Inc., Laurel, MD, USA) fitted with a quartz cuvette having a 1-mm optical path length. Each sample was maintained under constant temperature (37°C) in a water bath. Transmittance spectra were acquired in the range of 680-2500 nm with 2-nm step intervals. The NIR instrument recorded 10 consecutive spectra for urine samples, and 9 consecutive spectra for E1G standards to obtain more robust models.
Spectral pre-processing
Daily-averaged spectra in the first overtone region of water (1300–1600 nm) were further analyzed. Multiplicative scatter correction37 was applied to daily-averaged spectra to compensate for scattering derived from solid urinary particles, after that mean-centering was conducted.
In 1300–1600 nm, each 12 characteristic water wavelength ranges were characterized as follows11; 1336–1348 nm (ν3), 1360–1366 nm (OH-(H2O)1,2,4), 1370–1376 nm (ν1+ν3), 1380−1388 nm (OH-(H2O)1,4 and O2-(H2O)4), 1398–1418 nm (S0), 1421–1430 nm (H-OH bend and O-H•••O), 1432–1444 nm (S1), 1448–1454 nm (OH-(H2O)4,5), 1458–1468 nm (S2), 1472–1482 nm (S3), 1482–1495 nm (S4), and 1506–1516 nm (ν1, ν2). Hydrogen bonds described here are as follows; ν shows OH stretching vibrations of hydrogen-bonded water molecules (ν1; symmetric stretching fundamental vibration, ν2; doubly degenerate bending fundamental, and ν3; H2O antisymmetric stretching vibration), S represents the number of hydrogen bonds, e.g. S0 for free water molecular species38. In the present study, wavelength ranges related to estrus were determined by reference to these 12 characteristic water wavelength ranges.
To identify the wavelength range related to estrus, the difference spectrum was obtained in each year by subtracting the average spectrum of all days except for the previous and the next day of E1G peak from the average spectrum of these three days at E1G peak (estrous state). Data were initially pre-treated using Savitzky-Golay second derivative polynomial filter (window size = 9) with smoothing. After that, second derivative plot of all-year samples was used to identify the water absorbance bands which showed strong response to changes in estrous state. The absorbance bands showing the highest variation in each wavelength ranges were selected as the WAMACs.
Data analysis
Using absorbance values at the WAMACs of E1G standard spectra, the relationship between actual and predicted E1G concentrations was analyzed by PLSR, based on leave-one-out cross validation. The E1G standards were serially diluted with ultrapure water in the concentration range of 125–2000 pg/ml. Actual E1G concentrations (125–2000 pg/ml) were transformed into the decadic logarithm values (2.1–3.3) and the logarithm values were used for PLSR as reference values. Each learning set was created by taking all the samples except one, the test set being the sample left out. Thus, for five samples, we have five different learning sets and five different tests set. In addition, E1G concentration was quantified by PLSR based on leave-one-out cross validation using urinary spectra transformed by MSC and auto-scaling in the range of 1300-1600 nm or at only WAMACs. Each year's data was systematically split into two groups sorted by hormone concentration: for internal validation as a calibration set and for external validation as a prediction set. All samples were arranged in descending order of E1G and the first three samples were allocated in a calibration set. The forth sample was moved to the independent test set used for prediction. This procedure was repeated with the rest of the samples. The samples number in the calibration and prediction set was 18 and 6 spectra for 2007, 26 and 8 spectra for 2008, 17 and 5 spectra for 2009, respectively.
In HCA, distances between pairs of samples (or variables) were calculated and compared. Relatively small distances imply that the samples are similar, while dissimilar samples are separated by relatively large distances. The dendrogram classification was employed using Euclidean distance and complete-link clustering algorithm.
Furthermore, a newly designed star chart named “aquagram” was devised to visualize WASP at different status of estrus. Aquagram displays normalized absorbance values by auto-scaling at several water bands on the axes originating from the center of the graph. Absorbance values at the WAMACs were used for axes. The relationship between estrous state and WASP was estimated by comparing aquagrams for the days of high and low E1G values. A commercial software Pirouette (Version 4.0; Infometrix Inc., Bothell, WA, USA) was used for all chemometric analyses.
As for HCA analysis and aquagram, the absorbance values at the WAMACs were normalized by auto-scaling after MSC transformation.
The Steel-Dwass multiple comparison tests among aquagram values at the WAMACs were carried out using the website (http://www.gen-info.osaka-u.ac.jp/testdocs/tomocom/) operated by Genome Information Research Center of Osaka University. A P value of <0.05 was deemed significant.
Author Contributions
K.K. conceived the study and wrote the manuscript, R.T. designed the experiments and proposed the methods for data analysis, M.M. and H.M. performed the data analysis, H.A. and O.I. managed the animals, and M.V., H.K. and R.T. contributed to experiments and writing of the manuscript.
Acknowledgments
The authors are grateful to all staff in charge of animal management at the Kobe Municipal Oji Zoo. We would also like to thank the collaborators from the Biomeasurement Technology Laboratory at the Graduate School of Agricultural Science, Kobe University.
References
- Zhan X. J. et al. Molecular censusing doubles giant panda population estimate in a key nature reserve. Curr. Biol. 16(12), R451−R452 (2006). [DOI] [PubMed] [Google Scholar]
- Lü Z., Wang D. & Garshelis D. L. Ailuropoda melanoleuca, Available at http://www.iucnredlist.org/apps/redlist/details/712/0 (2008) (Accessed 6th June 2012). [Google Scholar]
- McGeehan L. et al. Hormonal and behavioral correlates of estrus in captive giant pandas. Zoo Biol. 21(5), 449−466 (2002). [Google Scholar]
- Masui M. et al. Successful artificial insemination in the giant panda (Ailuropoda melanoleuca) at Ueno Zoo. Zoo Biol. 8(1), 17−26 (1989). [Google Scholar]
- Czekala N., McGeehan L., Steinman K., Li X. B. & Gual-Sil F. Endocrine monitoring and its application to the management of the giant panda. Zoo Biol. 22(4), 389−400 (2003). [Google Scholar]
- Brown J. L. Comparative endocrinology of domestic and nondomestic felids. Theriogenology 66(1), 25−36 (2006). [DOI] [PubMed] [Google Scholar]
- Larson S., Casson C. J. & Wasser S. Noninvasive reproductive steroid hormone estimates from fecal samples of captive female sea otters (Enhydra lutris). Gen. Comp. Endocrinol. 134(1), 18−25 (2003). [DOI] [PubMed] [Google Scholar]
- Czekala N. M., Gallusser S., Meier J. E. & Lasley B. L. The development and application of an enzyme-immunoassay for urinary estrone conjugates. Zoo Biol 5(1), 1−6 (1986). [Google Scholar]
- Adamopoulos K. G. & Goula A. M. Application of near-infrared reflectance spectroscopy in the determination of major components in taramosalata. J. Food Eng. 63(2), 199−207 (2004). [Google Scholar]
- Li W., Huang Y. D., Liu L. & Chen N. T. Rapid and nondestructive analysis of quality of prepreg cloth by near-infrared spectroscopy. Composites Science and Technology 65(11-12), 1668−1674 (2005). [Google Scholar]
- Tsenkova R. Aquaphotomics: dynamic spectroscopy of aqueous and biological systems describes peculiarities of water. J. Near Infrared Spec. 17(6), 303−313 (2009). [Google Scholar]
- Tsenkova R. et al. Near-infrared spectroscopy for dairy management: Measurement of unhomogenized milk composition. J. Dairy Sci. 82(11), 2344−2351 (1999). [DOI] [PubMed] [Google Scholar]
- Meilina H., Kuroki S., Jinendra B. M., Ikuta K. & Tsenkova R. Double threshold method for mastitis diagnosis based on NIR spectra of raw milk and chemometrics. Biosyst. Eng. 104(2), 243−249 (2009). [Google Scholar]
- Kunzler R. A., Clark D. H. & Marcinkowski D. P. Changes in vulvar and vestibular tissue of the bovine during the estrous cycle as determined by the use of near infrared interactance. Theriogenology 38(5), 935−944 (1992). [DOI] [PubMed] [Google Scholar]
- Fountain W., Dumstorf K., Lowell A. E., Lodder R. A. & Mumper R. J. Near-infrared spectroscopy for the determination of testosterone in thin-film composites. J. Pharm. Biomed. Anal. 33(2), 181−189 (2003). [DOI] [PubMed] [Google Scholar]
- Xia M., Yang S., Simpkins J. W. & Liu H. W. Noninvasive monitoring of estrogen effects against ischemic stroke in rats by near-infrared spectroscopy. Appl. Optics 46(34), 8315−8321 (2007). [DOI] [PubMed] [Google Scholar]
- Medina-Gutierrez C., Quintanar J. L., Frausto-Reyes C. & Sato-Berru R. The application of NIR Raman spectroscopy in the assessment of serum thyroid-stimulating hormone in rats. Spectrochimica Acta Part a-Molecular and Biomolecular Spectroscopy 61(1–2), 87−91 (2005). [DOI] [PubMed] [Google Scholar]
- Weber J. M., Kelley J. A., Nielsen S. B., Ayotte P. & Johnson M. A. Isolating the spectroscopic signature of a hydration shell with the use of clusters: Superoxide tetrahydrate. Science 287(5462), 2461−2463 (2000). [DOI] [PubMed] [Google Scholar]
- Shin J. W. et al. Infrared signature of structures associated with the H+(H2O)n (n = 6 to 27) clusters. Science 304(5674), 1137−1140 (2004). [DOI] [PubMed] [Google Scholar]
- Robertson W. H., Diken E. G., Price E. A., Shin J. W. & Johnson M. A. Spectroscopic determination of the OH-solvation shell in the OH-center dot(H2O)n clusters. Science 299(5611), 1367−1372 (2003). [DOI] [PubMed] [Google Scholar]
- Giangiacomo R., Pani P. & Barzaghi S. Sugars as a perturbation of the water matrix. J. Near Infrared Spec. 17(6), 329−335 (2009). [Google Scholar]
- Hirschfeld T. Salinity determination using NIRA. Appl. Spectrosc. 39(4), 740−741 (1985). [Google Scholar]
- Williams P. Influence of water bands on prediction of composition and quality factors: the aquaphotomics of low moisture agricultural materials. J. Near Infrared Spec. 17(6), 315−328 (2009). [Google Scholar]
- Tsenkova R., Atanassova S. & Toyoda K. Near infrared spectroscopy for diagnosis: influence of mammary gland inflammation on cow's milk composition measurement. Near Infrared Anal. 2(1), 59−66 (2001). [Google Scholar]
- Gowen A., Tsenkova R., Esquerre C., Downey G. & O'Donnell C. Use of near infrared hyperspectral imaging to identify water matrix co-ordinates in mushrooms (Agaricus bisporus) subjected to mechanical vibration. J. Near Infrared Spec. 17(6), 363−371 (2009). [Google Scholar]
- Tsenkova R. et al. Near infrared spectra of cows' milk for milk quality evaluation: disease diagnosis and pathogen identification. J. Near Infrared Spec. 14(6), 363−370 (2006). [Google Scholar]
- Kinoshita K. et al. Near infrared spectroscopy of urine proves useful for estimating ovulation in giant panda (Ailuropoda melanoleuca). Anal. Methods 2, 1671−1675 (2010). [Google Scholar]
- Tsenkova R. Aquaphotomics: Water in the biological and aqueous world scrutinised with invisible light. NIR news 22(6), 6−10 (2010). [Google Scholar]
- Jinendra B. et al. Near infrared spectroscopy and aquaphotomics: Novel approach for rapid in vivo diagnosis of virus infected soybean. Biochem. Biophys. Res. Commun. 397(4), 685−690 (2010). [DOI] [PubMed] [Google Scholar]
- Lindburg D. G., Czekala N. M. & Swaisgood R. R. Hormonal and Behavioral relationships during estrus in the giant panda. Zoo Biol. 20(6), 537−543 (2001). [Google Scholar]
- Walrafen G. E. & Pugh E. Raman combinations and stretching overtones from water, heavy water, and NaCl in water at shifts to ca. 7000 cm−1. J. Solution Chem. 33(1), 81−97 (2004). [Google Scholar]
- Sakudo A. et al. A novel diagnostic method for human immunodeficiency virus type-1 in plasma by near-infrared spectroscopy. Microbiol. Immunol. 49(7), 695−701 (2005). [DOI] [PubMed] [Google Scholar]
- Maeda H., Ozaki Y., Tanaka M., Hayashi N. & Kojima T. Near infrared spectroscopy and chemometrics studies of temperature- dependent spectral variations of water: relationship between spectral changes and hydrogen bonds. J. Near Infrared Spec. 3, 191−201 (1995). [Google Scholar]
- Ball P. Water as an active constituent in cell biology. Chem. Rev. 108(1), 74−108 (2008). [DOI] [PubMed] [Google Scholar]
- Stillinger F. H. Water revisited. Science 209(4455), 451−457 (1980). [DOI] [PubMed] [Google Scholar]
- Wiggins P. Life depends upon two kinds of water. PLoS ONE 3(1), e1406 (2008). [DOI] [PMC free article] [PubMed] [Google Scholar]
- Geladi P., Macdougall D. & Martens H. Linearization and scatter correction for near infrared reflectance spectra of meat. Appl. Spectrosc. 39(3), 491−500 (1985). [Google Scholar]
- Ozaki Y. Application in chemistry in Near infrared spectroscopy principles, instruments, applications edited by H.W. Siesler, Y. Ozaki, S. Kawata, & H.M. Heise (Wiley-VCH Verlag GmbH, Weinheim., 2002).


