Abstract
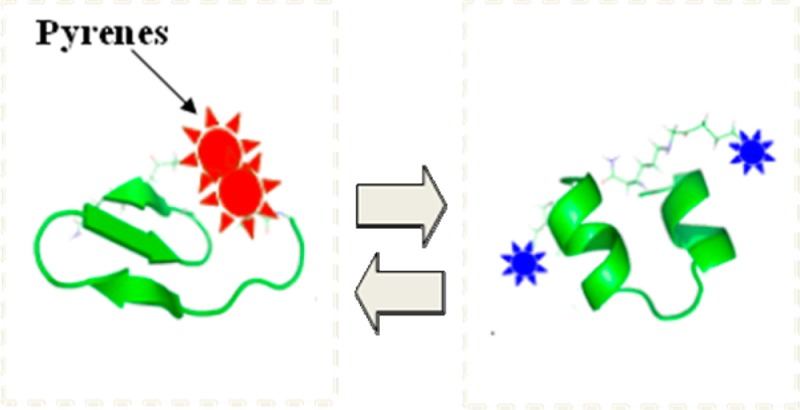
Amyloid β (Abeta) peptides in their oligomeric form have been proposed as major toxic species in Alzheimer’s disease (AD). There are a limited number of anti-Abeta antibodies specific to oligomeric forms of Abeta compared to the monomeric form, and accurate measurement of oligomeric forms in biological samples, cerebrospinal fluid (CSF), or brain extracts remains challenging. We introduce an oligomer-specific (in preference to monomers or fibrils) fluorescence assay based on a conformationally sensitive bis-pyrene-labeled peptide that contains amino acid residues 16–35 of the human amyloid beta protein (pronucleon peptide, PP). This peptide exhibits a shift in fluorescence emission from pyrene excimer to pyrene monomer emission resulting from a conformational change. Specific binding of PP to oligomeric forms of Abeta can be monitored in solution by a change in fluorescence spectrum as well as a change in pyrene monomer fluorescence anisotropy (or polarization). The mechanism of binding and its relation to anisotropy and fluorescence lifetime changes are discussed. The development of a simple, rapid, anisotropy assay for measurement of Abeta oligomers is important for further study of the oligomers’ role in AD, and specific detection of oligomers in biological samples, such as cerebrospinal fluid.
Keywords: oligomeric amyloid-beta, Alzheimer’s disease, structure selective assay, fluorescence anisotropy, fluorescence polarization
Dementia of early Alzheimer’s disease (AD) was for many years attributed to nerve cell death induced by deposits of fibrillar amyloid β (Abeta) peptides observed as the hallmark neuritic plaques. More recently, the hypothesis has been proposed that synapse failure is caused by soluble Abeta oligomers. Monomeric Abeta is a product of normal metabolism and not toxic; but as it forms multimeric and polymeric assemblies, it becomes toxic for neuronal cells.1−3 Soluble oligomers of amyloid β-peptides, especially Aβ 1–42 oligomers, are considered as a biomarker for AD in body fluids, such as serum and cerebrospinal fluid (CSF).4−9 Increasing effort is being devoted to the development of methods suitable for the detection of different Abeta aggregates in body fluids; an overview of the current state of detecting Abeta aggregates is given in Funke et al.4 At present, most detection methods for Abeta oligomers are antibody-based and often suffer from cross-reactivity and high nonspecific binding,10,11 so measurement of the levels of oligomeric Abeta in biological samples remains challenging. Since the neuropathogenic effect of Abeta oligomers seems to arise from a specific conformation the peptide adopts, rather than a specific molecular weight/aggregate size,12 developing a structure-specific assay for Abeta oligomers is important for understanding the disease biology. In order to gain conformational specificity, several groups developed other recognition and transduction approaches based on different receptors or other ligands13−16 including peptides,16,17 with varying success.
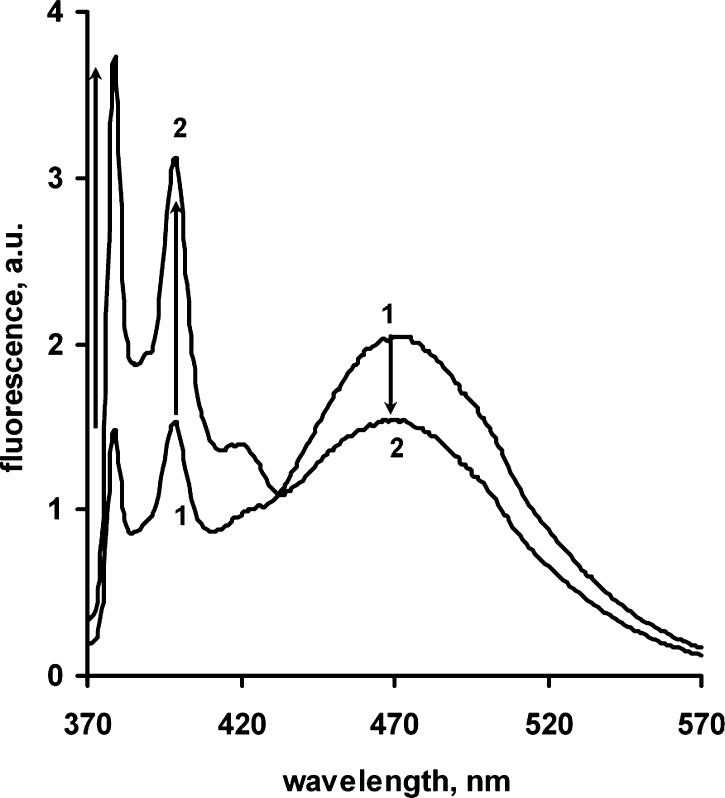
We have previously reported the use of small, conformationally dynamic peptides bis-labeled with pyrene at N- and C-termini (pronucleon peptides, PP), that enable the sensitive detection of misfolded prion proteins in prion disease.18−20 The β-sheet conformer of the peptide brings the two pyrene moieties closer together on average than the α-helix-containing conformer, permitting enhanced formation of an excited state pyrene dimer (excimer), which emits broadly in the blue-green compared to the structured UV-purple emission of pyrene alone (23) Figure 1. The peptide secondary structure as measured by circular dichroism is correlated with the fluorescence change. The detection of misfolded prion protein was demonstrated with pronucleon peptides undergoing an α-helix to β-sheet conversion, resulting in a decrease in the ratio of pyrene monomer to pyrene excimer emission. In contrast, we found that pronucleon peptides incorporating Abeta peptides upon binding to Abeta oligomers undergo the opposite transition from a β-sheet conformation to an extended conformation, resulting in an excimer to monomer fluorescence signal change (see Results, below). These fluorescently labeled peptides undergo a sequence-specific conformational rearrangement in the presence of Abeta aggregates, resulting in changes in their fluorescence properties that can be monitored using standard laboratory instrumentation.. We demonstrated the fluorescence response of these peptides was correlated with changes in their secondary structure, and the specificity of these peptides for binding oligomer over monomer and fibril forms of Abeta. We found that the variation in excimer emission under certain conditions with this system led to undesirably large coefficients of variation in the monomer to excimer emission ratio (typically measured as the ratio of intensity at 400 (monomer) to 480 nm (excimer)). Since PP is relatively small in comparison to the Abeta oligomer, we also examined the fluorescence anisotropy (polarization) of the PP binding to Abeta oligomers, with the goal of determining its suitability for fluorescence assay of oligomers.
Figure 1.
Fluorescence emission spectra of pyrenated peptide PP alone (curve 1) (190 nM in 50 mM HEPES pH 7.5 buffer) and PP + 10 nM Abeta oligomer following 10 min incubation at 37 °C. (curve 2). Spectra were measured using an AB-2 fluorometer at 37 C, with excitation at 350 nm.
Results and Discussion
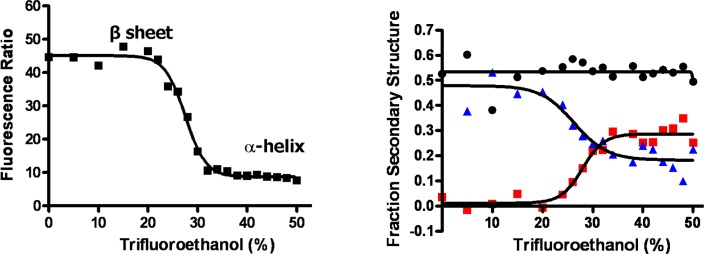
The ability of pronucleon peptides to detect Abeta oligomers was assessed using changes in pyrene fluorescence as pronucleon peptides bound to oligomers. When the bis-pyrenyl peptide PP is incubated with a preparation of Abeta oligomers, it exhibits a reduced proportion of the broad excimer emission (460–500 nm) and enhanced emission from the pyrene monomer with its characteristic narrow peaks at 380–400 nm. Figure 1 shows the fluorescence emission spectral profile of peptide PP alone (curve 1) and PP incubated with synthetic Abeta oligomer (2). PP in aqueous solution exhibits a profile characteristic of pyrene excimer, which has been shown to be associated with amyloid beta beta-sheet conformation (1 on Figure.1) with a maximum from 460 to 500 nm (broad peak with maximum about 470 nm on Figure.1). Upon binding to SDS-Abeta oligomer, the peptide’s fluorescence emission spectrum changes from primarily excimeric to a greater proportion of pyrene alone (i.e., self-fluorescence peaks at 380 and 400 nm). The relative intensities of monomer and excimer emission are determined by multiple factors, including the emissive and nonemissive decay rates of the monomer, the rate of excimer formation, and the emissive and nonemissive decay rates of the excimer;23 moreover, it is likely the excimer formation rate can also be influenced by the segmental mobility of the peptide during the relatively long (50+ ns, see below) pyrene monomer lifetime. Detailed studies of these rates are beyond the scope of this report. The change in proportions of pyrene monomer and excimer emissions corresponds to the circular dichroism measurements of the isolated peptide undergoing the conformational transition from beta to alpha structure induced by changes in solvent conditions (Figure 2) described above, suggesting that the PP undergoes a similar transition upon binding to the oligomer.
Figure 2.
Dependence of pyrene monomer:excimer ratio (left panel) and percent secondary structural elements (right panel blue triangle, β sheet; black circle, turns/unstructured; red square, α helix) of pronucleon peptide on trifluoroethanol concentration in buffer.
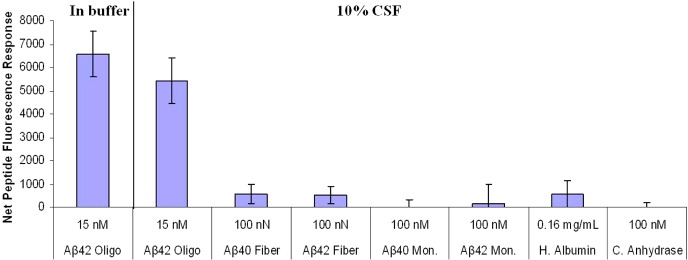
The specificity of this assay was shown by the lack of apparent binding to 100 nN Abeta40 fibers, 100 nN Abeta42 fibers, 100 nM Abeta40 monomer, Abeta 42 monomer, 0.16 mg/mL human serum albumin, or 100 nM carbonic anhydrase (Figure 3), as well as the failure of the scrambled random peptide to exhibit a similar increase in fluorescence in binding [data not shown] Specificity is also confirmed by independent direct binding methods, such as colocalization of the PP probe with oligomer demonstrated by immunoprecipitation by beads coated with antibody 6E10 by protein A or protein G binding to beads; PP probe did precipitate with oligomer-coated beads but did not precipitate with monomer-coated beads. Monoclonal antibody 6E10 to human sequence Aβ recognizes amino acid residues 1–16 of beta amyloid such that these antibodies bind SDS-oligomer which was also demonstrated by gel chromatography studies (SDS-PAGE, Western blot) of beads pulled out from the sample and washed (data not shown). We conclude that the pronucleon peptide binds quite specifically to the oligomeric form of the Abeta peptide, and the binding is accompanied by a significant conformational change which can be detected fluorometrically.
Figure 3.
Specificity of pronucleon peptide binding differing Abeta oligomers in buffer and 10% cerebrospinal fluid (CSF) compared with binding to Abeta monomers and fibers, as well as serum albumin and an archetypical globular protein, measured by pyrene monomer/excimer emission ratio.
We found in these experiments a more substantial variability in the monomer:excimer emission ratio than had been observed in the prion studies. This can be seen in the two left bars in Figure 3, which exhibit about 20% variation. Such large variation would adversely affect our limit of detection, and seemed to arise mainly from variation in the apparent excimer intensity. The source of the variation was not immediately apparent. By comparison, the pyrene monomer emission showed less apparent variation and increased with oligomer concentration (Figure 4). Oligomer concentration was calculated assuming that it is a 20-mer on average: for example, 1 nM oligomer corresponds to 20 nanonormal Abeta peptide. The enhanced monomer intensity may arise from reduction of a quenching process associated with the unbound conformation, such as reduced exposure to the aqueous medium or reduction of excimer formation which from the standpoint of the pyrene monomer is a quenching process. The enhanced intensity represents a useful tool for studying the peptide:oligomer association, although accurately quantifying the percent associated with just an isolated intensity measurement is often problematic.
Figure 4.
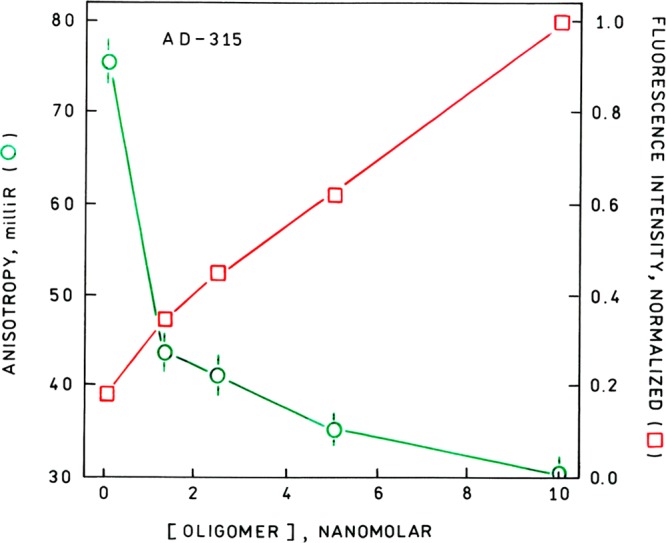
Normalized pyrene monomer fluorescence intensity (red open square) and anisotropy (green open circle) of pronucleon peptide AD-315 as a function of oligomer concentration. Excitation 350 nm, emission 380 nm.
Like the monomer/excimer ratio, fluorescence anisotropy (synonymous with polarization, but normalized differently) can also be measured ratiometrically (see eq 1, below), where I∥ and I⊥ are fluorescence intensities measured with the emission polarizer oriented parallel and perpendicular, respectively, to the (vertically oriented) excitation
| 1 |
As a result, the anisotropy r can be measured very accurately since variations in emission intensity because of variations in excitation intensity, fluorophore concentration, specimen thickness, photobleaching, and other factors cancel out in the ratio. In general, one would expect that binding of the labeled pronucleon peptides to the thirty-fold larger oligomers will result in increased fluorescence anisotropy of the pyrene monomer however, this was not the case (Figure 4). In particular, the anisotropy declined more than 60% with increasing oligomer concentration. The low anisotropies (less than 0.1 for the peptide in the absence of oligomer) are expected because of the long fluorescence lifetime of the pyrene fluorophore. Nevertheless, the change is large enough to make anisotropy a convenient research tool in this instance for studying peptide-oligomer binding. The accuracy and precision of anisotropy measurements in commercial instruments is typically ±0.002 (2 milli-r), and most of our measurements would seem to fall in this range; some hand-built instruments have demonstrated better accuracy. For anisotropy determination we used only the 380 nm emission peak to avoid the possibility of admixing (highly polarized) Raman scatter at 399 nm; emission spectra (not shown) confirmed there was no admixture of Raman scatter with the fluorescence emission in either anisotropy or lifetime measurements. By comparison, the intensity change was larger but roughly followed (the inverse of) the anisotropy.
In general we would expect the PP peptide to exhibit an elevated anisotropy upon binding to the oligomer, as the latter is more massive and could be expected to rotate more slowly and thus increase the anisotropy of fluorophores tightly coupled to its motion. This may be predicted from Perrin’s equation
| 2 |
where r is the measured anisotropy, r0 is the limiting anisotropy at the excitation wavelength, τ is the lifetime, and θc is the rotational correlation time of the fluorophore. Thus a fluorophore becoming bound to a larger molecule or aggregate with a longer rotational correlation time should generally exhibit a larger anisotropy. Spherical molecules exhibit a single rotational correlation time that is a function of their rotating volume (V), and the temperature (T) and viscosity (η) of the solvent, where R is the gas constant
| 3 |
Molecules which are less symmetric than spheres or for which the fluorophore rotates somewhat independently of the rest of the molecule to which it is bound (termed segmental motion) exhibit multiple correlation times and complex time-dependent decays of anisotropy; see ref (24) for a complete discussion.
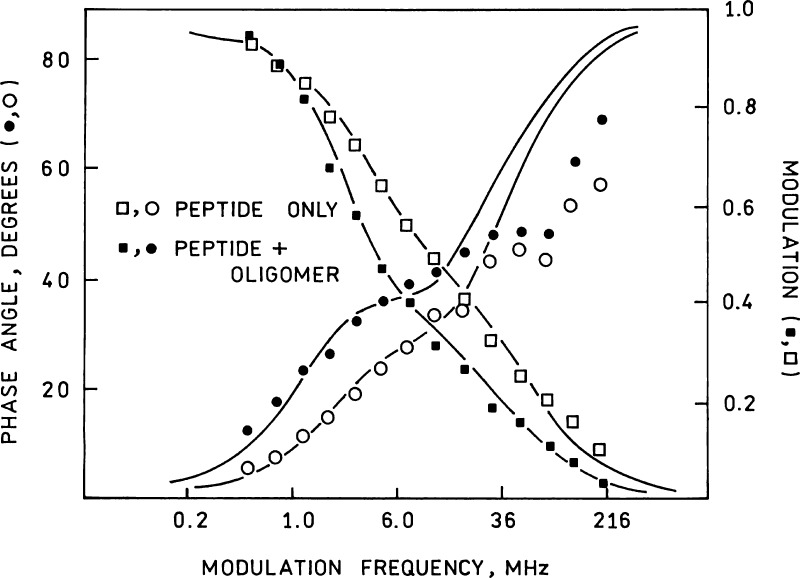
There are two broad explanations for the fact that the PP peptide exhibits a decrease in anisotropy upon binding: the first is that it also exhibits an increase in lifetime (typically accompanied by an increase in quantum yield and apparent intensity), and the second is that the bound fluorophore exhibits increased segmental motion upon binding. Since binding is accompanied by an increase in intensity of the monomer, we measured the fluorescence lifetime of the peptide free in solution and bound to the oligomer using phase fluorometry (Figure 5). We found that the lifetime did increase (Table 2), with the component lifetime attributable to the pyrene monomer almost doubling from 46 to 86 ns and increasing its fractional intensity upon binding to the oligomer. The increased lifetime is expected in view of the increased intensity, but the intensity increase (5-fold) is greater than the 2-fold lifetime increase, indicating that static quenching is reduced in the bound form. The poor fit of the phase data at higher frequencies is probably attributable to the lower accuracy of phase measurement at high frequencies where the modulation declines to less than 20%. The data in Figure 5 make it clear that one could also use lifetime measurements (or even phase and modulation measurements at a single frequency around 4 MHz) to determine the presence of the oligomer by binding reaction, although this is somewhat more complex than the steady state intensity or anisotropy measurements. Knowing the average lifetimes of the bound (⟨τ⟩ = ∑ fiτi = 57 ns) and free (22 ns) label we can approximate the rotational correlation times of the Pronucleon peptide free in solution and bound to the oligomer using Perrin’s equation (eq 2) as 4.4 and 5.7 ns, respectively. The low value for the oligomer-bound label indicates the label has substantial segmental mobility independent of the oligomer: an oligomer of twenty peptides would have a molecular weight over 30 000 Da and if globular one would estimate its rotational correlation time to be approximately 12 ns using eq 3 above. The apparent rotational correlation time of the free peptide is greater than expected for a globular molecule of the peptide’s molecular weight, suggesting that the labeled pronucleon peptide may exist free in solution as an oligomer on its own. Fluorescence experiments employing time-resolved anisotropy (or its frequency domain analog, differential polarized phase fluorometry) measurements or NMR studies would be necessary to confirm this; however, the relatively long lifetime of the pyrene label (Table 2) in comparison with the expected rotational correlation times above makes it poorly suited for such experiments. Experiments using labels with shorter lifetimes better suited for time-resolved anisotropy measurements in this system are underway.
Figure 5.
Frequency-dependent phase shifts (circles) and modulations (squares) of 100 nM labeled peptide AD-315 alone (open symbols) and following 3 h incubation with oligomer (filled symbols). Lines indicate best two component fits to the data; fitted parameters are given in Table 2.
Table 2. Fluorescence Lifetimes for Peptide (AD-315) Alone and Bound to Abeta Oligomer.
| sample | τ1 | f1 | τ2 | f2 | χ2 |
|---|---|---|---|---|---|
| peptide alone | 45.9 ± 0.0 | 0.45 | 4.7 ± 0.1 | 0.43 | 62 |
| peptide + oligo | 86 ± 1 | 0.64 | 6.7 ± 0.2 | 0.30 | 14 |
Table 1. Structures of the Pronucleon Peptides PP Used in This Research: Wild Type, AD-315 (Two Point Mutations Indicated in Bold), AD-204, Which Has the Wildtype Composition but the Sequence Is Scrambled.
| peptide | sequence | description |
|---|---|---|
| AD-wildtype | PBA-KLVFF AEDVG SNKGA IIGLM K(PBA)-NH2 | wild type amyloid-β sequence 16–35 |
| AD-315 | PBA-KLVFF AEDVG SNKHA IIELM K(PBA)-NH2 | PP two point mutations |
| AD-204 | (PBA-NIAD GLEF SIKF KALV GMVG K(PBA)-NH2) | wild type composition, scrambled |
We also measured the kinetics of the binding reaction by intensity and anisotropy; the results of that experiment are depicted in Figure 6. The response was relatively rapid, with over 80% of the response as measured by anisotropy occurring within 20 min at 37 °C. The anisotropy response appears to mirror the intensity response, suggesting that the cause of the intensity change occurs at the same time as the anisotropy change; the simplest explanation is that the binding is accompanied by the conformational change of the labeled peptide. In view of the low concentrations (nanomolar) of the reactants in this binding reaction and the likely diffusion constants of the peptide and oligomers, conformational change does not seem to present much of a barrier.
Figure 6.

Time-dependence of fluorescence anisotropy (green open circles) and fluorescence intensity (red open squares) of 190 nM Pronucleon peptide added to 10 nM Abeta oligomer.
Conclusions
We have demonstrated a sensitive fluorescence assay for Abeta oligomers which discriminates well for the neuropathogenic oligomer aggregation state against the monomeric and fibril forms of the peptide. Unlike the monomer/excimer intensity ratios, which showed unexpected variation, the monomer intensities and anisotropies were relatively precise and appeared accurate. While the pyrene label provides a unique response in the form of excimer emission, its long lifetime provides only a modest change in anisotropy. Further development, perhaps with different labels, will be necessary to increase the response.
Materials and Methods
Reagents
Bovine serum albumin (BSA), Tween-20, 1,1,1,3,3,3-hexafluoro-2-propanol (HFIP), and dimethylsulfoxide (DMSO) were purchased from Sigma-Aldrich (St. Louis, MO, USA). Pronucleon peptides were prepared by solid-phase FMOC synthesis by SciLight. Stock solutions of peptides, at 200 μM in HFIP stored at −80 C were thawed and diluted 10-fold in water and then to desired concentration in appropriate buffer before use. Aβ1–40 and Aβ1–42 monomer peptides were obtained from AnaSpec, Inc. (Fremont, CA, USA). Monomer peptides were dissolved in DMSO at a concentration of 2.5 mg/mL and sonicated for 10 min at room temperature in a Branson 1510 water bath sonicator. Concentration was determined using Pierce 660 nm Protein assay (Thermo-Scientific), and the peptide stored in DMSO at a concentration of ∼500 μM. Samples were divided into aliquots and stored at −80 C. Thioflavin T (ThT) staining was used to confirm that the sample was monomeric. Stock solutions in DMSO at 200–600 μM (stored at −80 C) were thawed and diluted into an appropriate buffer before use. Aβ1–42 fiber was synthesized by Adlyfe, Inc. and a stock solution (in 10% DMSO in 40 mM sodium phosphate pH 7.4 100 mM NaCl, PBS) at 55 μM (stored at +4 C) was diluted in appropriate buffer before use.
To aid in development of an effective in vitro diagnostic test to measure neurotoxic Abeta species, we produced SDS-derived soluble oligomers. We have developed a formulation to maximize their stability, and extensively characterized them with respect to size distribution, ThT staining, and structural properties. Aβ1–42 SDS-derived oligomers were used for the experiments described in this report. Aβ1–42 SDS-derived oligomers (globulomers) were prepared according to the general protocol described in,21 but with some modifications. Aβ1–42 monomer from Anaspec was redissolved in DMSO (1.0 mg/44 μL/), and sonicated for 5 min. Two milliliters of 1× PBS (Cellgro) was added per mg Aβ1–42; then SDS was added to a final concentration of 0.12% (4.3 mM), and Aβ1–42 concentration of 100 μM. This mixture was incubated for 24 h at 37 °C. After incubation, samples were centrifuged at 3000g for 20 min to remove any fibrils that had formed. Samples were then concentrated to 250–400 μL per 1 mg of starting material using a 4 mL Millipore filter (molecular weight cutoff = 30 000 MW). Samples were then dialyzed into a stabilizing formulation buffer (10 mM sodium phosphate, pH 7.4, 300 mM sucrose, 1.9% glycine) (PSG). After dialysis, samples were centrifuged at 10 000g for 10 min, then the concentration determined by Pierce 660 nm colorimetric assay. Samples were subsequently diluted in formulation buffer to 100 μM (based on Aβ1–42 monomer molecular weight), and lyophilized. Lyophilized samples have been shown to be stable for at least one year when stored at 4 °C. For use, lyophilized samples were reconstituted in equal volume water.
To determine the molecular size of Aβ1–42 SDS oligomers, samples were chromatographed on two gel filtration HPLC columns in tandem (GE/Pharmacia G75 Superdex 75 10/300 GL and Superose 6 10/300) in PBS mobile phase on an Agilent 1100 HPLC instrument. The elution time of the SDS oligomer was compared to molecular weight standards to determine its average native molecular weight. The average molecular weight was determined to be ∼80 kDa, equivalent to a 20-mer.
Amyloid Beta Fibrils:
Aβ1–40 and Aβ1–42 fibrils were prepared using the corresponding monomeric stocks (preparation described above). Monomer stocks (∼500 μM in DMSO) were diluted to 50 μM in a solution containing final concentrations of 0.9X PBS, 10% DMSO, and 0.02% sodium azide. Samples were then incubated for 24–72 h at 37 °C with agitation at 750 rpm using an Eppendorf Thermomixer. Throughout the incubation, samples were removed for evaluation by ThT assay. ThT assay was performed by dilution of an aliquot from the growing fibril sample to ∼1 μM in 8 μM ThT reagent, followed by incubation for 10 min at room temperature. Samples were subsequently added to a 96-well plate and fluorescence intensity measured (excitation at 440 nm, emission at 490 nm). Fibrils were considered ready for use when aliquots reached maximum fluorescence. Fibrils were stored at 4 °C, and were considered usable for 1 month after the preparation date.
Monoclonal antibodies to human sequence Aβ 6E10 (reactive to amino acid residues 1–16 of beta amyloid) and 4G8 (reactive to amino acid residues 17–24 of beta amyloid), and their respective horseradish peroxidase labeled conjugates were purchased from Covance (NJ, USA).
Fluorescence Methods
Fluorescence spectra and anisotropies were measured on a Thermo Spectronics AB-2 fluorometer with excitation at 350 nm and emission at 360–700 or 380 nm (4 nm slits). Anisotropy experiments were performed either in 50 mM HEPES buffer (pH 7.5), or in 20 mM HEPES buffer (pH 7.5) containing 0.05% NP-40 and 0.1% BSA.
Fluorescence lifetime data were collected in the frequency domain on an ISS K2 phase fluorometer with excitation at 326 nm from a Kimmon HeCd laser with polarizers at the magic angle orientation through a 380 nm center wavelength, 25 nm fwhm bandpass filter, essentially as previously described; (22) no Raman scatter was detected in spectral measurements. Frequency-dependent phases and modulations were fit to biexponential decay models using ISS software. We mainly measured fluorescence intensity and anisotropy at the pyrene monomer emission peak at 380 nm (Figure 1); we note the longest wavelength pyrene monomer emission peak at ∼400 nm is strongly overlapped by a Raman peak and is less accurate in consequence.
Acknowledgments
The authors are grateful to Rolf Swenson for careful reading of an earlier version of the manuscript.
The authors declare the following competing financial interest(s): The authors (AR, JM, EGM) declare competing financial interests.
References
- Pike C. J.; Burdick D.; Walencewicz A. J.; Glabe C. G.; Cotman C. W. (1993) Neurodegeneration induced by beta-amyloid peptides in vitro: the role of peptide assembly state. J. Neurosci. 13(4), 1676–1687. [DOI] [PMC free article] [PubMed] [Google Scholar]
- Lacor P. N.; Buniel M. C.; Chang L.; Fernandez S. J.; Gong Y.; Viola K. L.; Lambert M. P.; Velasco P. T.; Bigio E. H.; Finch C. E.; Krafft G. A.; Klein W. L. (2004) Synaptic targeting by Alzheimer’s-related amyloid beta oligomers. J. Neurosci. 24(45), 10191–10200. [DOI] [PMC free article] [PubMed] [Google Scholar]
- Cerpa W.; Dinamarca M. C.; Inestrosa N. C. (2008) Structure-function implications in Alzheimer’s disease: Effect of Abeta oligomers at central synapses. Curr. Alzheimer Res. 5(3), 233–243. [DOI] [PubMed] [Google Scholar]
- Funke S. A.; Birkmann E.; Willbold D. (2009) Detection of amyloid-beta aggregates in body fluids: a suitable method for early diagnosis of Alzheimer’s disease?. Curr. Alzheimer Res. 6(3), 285–289. [DOI] [PubMed] [Google Scholar]
- Watson D.; Castaño E.; Kokjohn T. A.; Kuo Y. M.; Lyubchenko Y.; Pinsky D.; Connolly E. S. Jr.; Esh C.; Luehrs D. C.; Stine W. B.; Rowse L. M.; Emmerling M. R.; Roher A. E. (2005) Physicochemical characteristics of soluble oligomeric Abeta and their pathologic role in Alzheimer’s disease. Neurol. Res. 27, 869–881. [DOI] [PubMed] [Google Scholar]
- Schupf N.; Tang M. X.; Fukuyama H.; Manly J.; Andrews H.; Mehta P.; Ravetch J.; Mayeux R. (2008) Peripheral Abeta subspecies as risk biomarkers of Alzheimer’s disease. Proc. Natl. Acad. Sci. U.S.A. 105(37), 14052–14057. [DOI] [PMC free article] [PubMed] [Google Scholar]
- Rahimi F.; Shanmugam A.; Bitan G. (2008) Structure-function relationships of pre-fibrillar protein assemblies in Alzheimer’s disease and related disorders. Curr. Alzheimer Res. 5(3), 3193–3141. [DOI] [PMC free article] [PubMed] [Google Scholar]
- Aluise C. D.; Sowell R. A.; Butterfield D. A. (2008) Peptides and proteins in plasma and cerebrospinal fluid as biomarkers for the prediction, diagnosis, and monitoring of therapeutic efficacy of Alzheimer’s disease. Biochim. Biophys. Acta 1782(10), 549–558. [DOI] [PMC free article] [PubMed] [Google Scholar]
- Fukumoto H.; Tokuda T.; Kasai T.; Ishigami N.; Hidaka H.; Kondo M.; Allsop D.; Nakagawa M. (2010) High-molecular-weight beta-amyloid oligomers are elevated in cerebrospinal fluid of Alzheimer patients. FASEB J. 24(8), 2716–2726. [DOI] [PubMed] [Google Scholar]
- van Helmond Z.; Heesom K.; Love S. (2009) Characterization of two antibodies to oligomeric Abeta and their use in ELISAs on human brain tissue homogenates. J. Neurosci. Methods 176(2), 206–212. [DOI] [PubMed] [Google Scholar]
- Klaver A. C.; Patrias L. M.; Coffey M. P.; Finke J. M.; Loeffler D. A. (2010) Measurement of anti-Abeta1–42 antibodies in intravenous immunoglobulin with indirect ELISA: the problem of nonspecific binding. J. Neurosci. Methods 187(2), 263–269. [DOI] [PubMed] [Google Scholar]
- Hillen H.; Barghorn S.; Striebinger A.; Labkovsky B.; Müller R.; Nimmrich V.; Nolte M. W.; Perez-Cruz C.; van der Auwera I.; van Leuven F.; van Gaalen M.; Bespalov A. Y.; Schoemaker H.; Sullivan J. P.; Ebert U. (2010) Generation and therapeutic efficacy of highly oligomer-specific beta-amyloid antibodies. J. Neurosci. 30(31), 10369–10379. [DOI] [PMC free article] [PubMed] [Google Scholar]
- James E. A.; Schmeltzer K.; Ligler F. S. (1996) Detection of endotoxin using an evanescent wave fiber-optic biosensor. Appl. Biochem. Biotechnol. 60(3), 189–202. [DOI] [PubMed] [Google Scholar]
- Schmid E. L.; Tairi A. P.; Hovius R.; Vogel H. (1998) Screening ligands for membrane protein receptors by total internal reflection fluorescence: the 5-HT3 serotonin receptor. Anal. Chem. 70(7), 1331–1338. [DOI] [PubMed] [Google Scholar]
- Lee M.; Walt D. R. (2000) A fiber-optic microarray biosensor using aptamers as receptors. Anal. Biochem. 282, 142–146. [DOI] [PubMed] [Google Scholar]
- Kulagina N. V.; Lassman M. E.; Ligler F. S.; Taitt C. R. (2005) Antimicrobial peptides for detection of bacteria in biosensor assays. Anal. Chem. 77(19), 6504–6508. [DOI] [PubMed] [Google Scholar]
- Kulagina N. V.; Shaffer K. M.; Ligler F. S.; Taitt C. R. (2007) Antimicrobial peptides as new recognition molecules for screening challenging species. Sens. Actuators, B 121, 150–157. [DOI] [PMC free article] [PubMed] [Google Scholar]
- Grosset A.; Moskowitz K.; Nelsen C.; Pan T.; Davidson E.; Orser C. S. (2005) Rapid presymptomatic detection of PrPSc via conformationally responsive palindromic PrP peptides. Peptides 26(11), 2193–2200. [DOI] [PubMed] [Google Scholar]
- Tcherkasskaya O.; Davidson E.A..; Schmerr M. J.; Orser C. S. (2005) Conformational biosensor for diagnosis of prion diseases. Biotechnol. Lett. 27(9), 671–675. [DOI] [PubMed] [Google Scholar]
- Pan T.; Sethi J.; Nelsen C.; Rudolph A.; Cervenakova L.; Brown P.; Orser C. S. (2007) Detection of misfolded prion protein in blood with conformationally sensitive peptides. Transfusion 47(8), 1418–1425. [DOI] [PubMed] [Google Scholar]
- Barghorn S.; Nimmrich V.; Striebinger A.; Krantz C.; Keller P.; Janson B.; Bahr M.; Schmidt M.; Bitner R. S.; Harlan J.; Barlow E.; Ebert U.; Hillen H. (2005) Globular amyloid beta-peptide oligomer—A homogenous and stable neuropathological protein in Alzheimer’s disease. J. Neurochem. 95(3), 834–847. [DOI] [PubMed] [Google Scholar]
- Thompson R. B.; Gratton E. (1988) Phase fluorimetric method for determination of standard lifetimes. Anal. Chem. 60, 670–674. [DOI] [PubMed] [Google Scholar]
- Forster T.; Kasper K. (1954) Ein konzentrationsumschlag der fluoreszenz des pyrens. Z. Phys. Chem. (Neue Folge) 1, 275–277. [Google Scholar]
- Lakowicz J.R. (2006) Principles of Fluorescence Spectroscopy 3rd revised ed., Springer-Verlag, Inc., New York. [Google Scholar]


