Abstract
The application of biomolecular magnetic resonance imaging becomes increasingly important in the context of early cartilage changes in degenerative and inflammatory joint disease before gross morphological changes become apparent. In this limited technical report, we investigate the correlation of MRI T1, T2 and T1<rho> relaxation times with quantitative biochemical measurements of proteoglycan and collagen contents of cartilage in close synopsis with histologic morphology. A recently developed MR imaging sequence, T1<rho>, was able to detect early intracartilaginous degeneration quantitatively and also qualitatively by color mapping demonstrating a higher sensitivity than standard T2-w sequences. The results correlated highly with reduced proteoglycan content and disrupted collagen architecture as measured by biochemistry and histology. The findings lend support to a clinical implementation that allows rapid visual capturing of pathology on a local, millimeter level. Further information about articular cartilage quality otherwise not detectable in-vivo, via normal inspection, is needed for orthopedic treatment decisions in the present and future.
Keywords: cartilage, osteoarthritis, degeneration, MRI, histology
Introduction
Osteoarthritis (OA) of the knee is a multifactorial disease [1–3]. In this investigation we 1) focus on focal degenerative processes that primarily involve the cartilage; and 2) discuss the potential role of a novel MRI technique (T1ρ) in the investigation of early biochemical changes in cartilage when gross morphological changes are not yet apparent. Once the cartilage surface starts to degenerate through non-physiologic repetitive loading, followed by cellular, biochemical and finally macroscopic morphological changes, a vicious cycle of secondary intermittent inflammatory processes and an altered motion-loading situation progresses to disrupt a fine balanced joint mechanism [4].
Hyaline cartilage consists of four main components: Chondrocytes, type II collagen, negatively charged proteoglycans (PG) made of glycosaminoglycans (GAG) and hyaluronic acid and a significant amount of water - altogether maintaining an optimal degree of osmotic pressure, resilience and stiffness [1]. Joint cartilage consists of four continuous layers where each of its four components are present in varying concentrations and orientations resulting in different biomechanical functions. Interestingly, with regards to MR signal detection, the cartilage water concentration has an inverse relation to the present hydrophilic GAG [5]. A number of MRI parameters have been investigated to follow any of the processes and conditions described above. Among them, T2 and T1<rho> have both demonstrated sensitivity to molecular structure and concentration in cartilage to varying degrees [6–9]. Menezes et al. investigated T1 and T2 in articular cartilage systems ex-vivo to show general sensitivity to pathology but also its limitations at the time [10]. The degree of specificity for cartilage pathology is yet undecided. The understanding of interactions between the cartilage components and the underlying patho-mechanisms that lead to primary changes in cartilage composition are of great interest in the development of non-invasive diagnostic procedures to detect early –, and possibly reversible changes – and future treatment options that intervene with cartilage metabolism [11–18].
Case report
We extensively investigated degenerative cartilage disease in one fully-preserved cadaveric knee from a 47-year-old woman with no known history of trauma to the knee or disease of bones/joints. The cadaver knee was obtained through NDRI (shipped frozen). The protocol in this report for all methods is identical to a study of a larger osteoarthritis cohort recently published by Li et al. [19].
All exams were performed in accordance with the rules and regulations from the Human Research Committee of our institute and comply with the principles outlined in the Declaration of Helsinki.
MRI
Prior to invasive examination or dissection of the specimen, the entire unopened specimen was scanned at room temperature using a quadrature knee coil in a 3.0 T GE MR scanner (GE Healthcare, Milwaukee, WI, USA). Sagittal 3D SPGR and T1ρ-weighted images (3mm slice thickness) where acquired using a protocol previously described for an in vivo OA study [20]. Three-dimensional T1ρ mapping was accomplished based on SPGR sequence [21] (in-plane resolution = 0.55 × 0.55 mm, slice thickness = 3 mm, time of spin-lock (TSL) = 0/10/40/80 ms, frequency of spin-lock = 500 Hz). The T1ρ map was reconstructed by fitting the T1ρ weighted images pixel-by-pixel to the equation S(TSL) = S0 * exp(−TSL/T1ρ). After reconstruction, T1ρ color maps representing the local relaxation times were generated. After MRI image acquisition was complete, the knee capsule was opened using a median parapatellar approach, and the specimen was carefully examined for cartilage surface changes. A 5×5 mm focal soft area with an intact surface was palpable in the medial posterior femoral condyle (MPFC). This soft ‘lesion’ is referred to as the region of interest (‘ROI’; Fig. 1). This particular region was separately prepared and re-scanned using a smaller wrist coil with similar MR sequences but at higher spatial resolution (0.31 × 0.31 mm, slice thickness 1 mm).
Fig. 1.
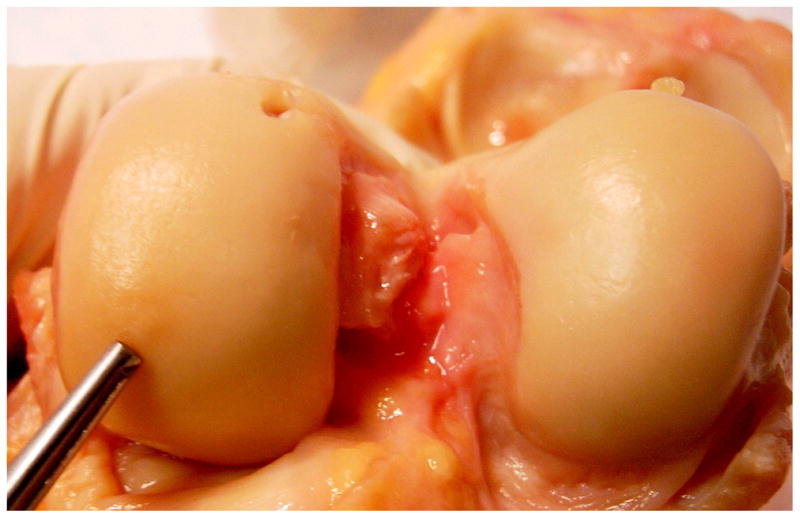
Human knee cadaver with visually intact femoral condyles. Forceps tip pointing to a 5×5mm soft region (ROI) that was examined in sagittal sections histologically, biochemically and with MR.
Significantly higher T1ρ relaxation times were found in the ROI. Values in the ROI were ~4x higher (−120ms ± 11.8 ms) (Fig. 2b) than in the surrounding unaffected cartilage (30–50ms ± 8 ms ).
Fig. 2.
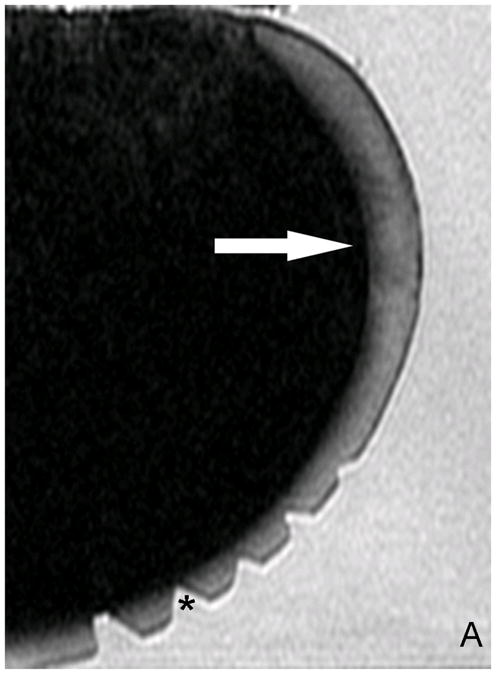
A) Original T2 -w image. Without color mapping the ROI (white arrow) in the human posterior femoral condyle (PFC) presents only subtle structural signal inhomogeneity. *(Cutting artifacts). B) SPGR image with fitted T1ρ color map. ROI in the PFC (sagittal image orientation through the knee) displays T1ρ values up to 120ms (red=abnormal, blue=normal cartilage) as an indicator for extended relaxation times due to an increase in cartilage bound water and a reduction in PG related to catabolic cartilage processes. C) Magnification of the ROI after repeated scanning of the separated PFC. D) Safranin-O stained histo section of a representative sagittal slice through the ROI shows focal PG (red) reduction and a bow-like intrasubstance fissure. The cartilage surface shows only mild irregularities. *(Cutting artifacts)
Biochemistry
Multiple cartilage punch biopsies (weighing approximately 50 mg each) were acquired from the ROI and from the healthy contralateral side for quantitative biochemistry (PG + COL) measurements using a DMMB based assay. PG content in the ROI was reduced by 47% to 1.9 wt% compared to the healthy-appearing condyle. No significant difference in the collagen content was found (COL content →) between the ROI compared to the control side (12wt% vs. 11 wt%)
Histology
4μm-thick histologic sections were taken through the ROI directly adjacent to the punch biopsy sites for biochemical analysis. The tissue was fixed and paraffin embedded. The tissues were stained using Hematoxylin and Eosin (H&E), Safranin-O for assessment of proteoglycan content and Sirius-red for visualization of collagen content and orientation under polarized light. Chondrocytes in the ROI appeared small, pycnotic and reduced in number. Safranin-O staining revealed a very localized reduction in proteoglycan content throughout all cartilage layers. Above the center of the lesion, the superficial cartilage layer was intact and smooth but the superior and inferior ROI borders showed minor superficial fibrillation. In addition, a horizontal cleft in the intermediate layer could be observed. Collagen fiber orientation under polarized light in normal cartilage showed an inverse correlation to proteoglycan and collagen content with regards to the depth of the cartilage layer (deep zone: high PG and low collagen) [22]. Collagen content in the ROI appeared increased without polarized light and disorganized using polarized light microscopy.
Discussion
The hyaline joint cartilage investigated in this report did not show any signs of disease by simple visual observation, however direct physical examination revealed a slight decrease in focal resilience suspicious for underlying cartilage pathology. This was a rare occasion to study early degenerative cartilage disease in a human. In contrast to ex-vivo conditions, pathophysiological processes in cartilage degeneration is a continuous cycle with overlapping stages not limited to one component at one time point which may explain many of the inconsistencies in studies investigating cartilage ‘specific’ parameters [10;23]. T1<rho> and T2 mapping are influenced by the main cartilage specific components: water hydration, COL architecture, PG content and to a lesser extend – cells - due to their small number [24]. Which component is dominantly reflected in each MR parameter is controversial. Therefore only a multi-methodological investigative approach, as presented here, may differentiate the influence of each component.
Clinically applied, standard T2-w image sequences did not detect significant changes in cartilage signal intensity, which underlines results from studies showing T2 insensitivity to proteoglycan depletion but a stronger influence of collagen architecture [23;25]. T1<rho>, previously applied in a larger cohort in human cartilage ex-vivo specimen [19], has been shown to predict PG loss across all samples in reference to histology. Also, previous ex-vivo experiments with enzymatic degradation of cartilage have shown changes in T1<rho> relaxation times [26]. Here, in a morphologically intact and unaltered human cartilage, T1<rho> MRI was able to detect biochemical changes in a small region of cartilage (52mm), under in-vivo equivalent conditions. The size of the lesion was large enough to be detected by thorough palpation but without visible surface irregularities as it would have been performed via arthroscopy view.
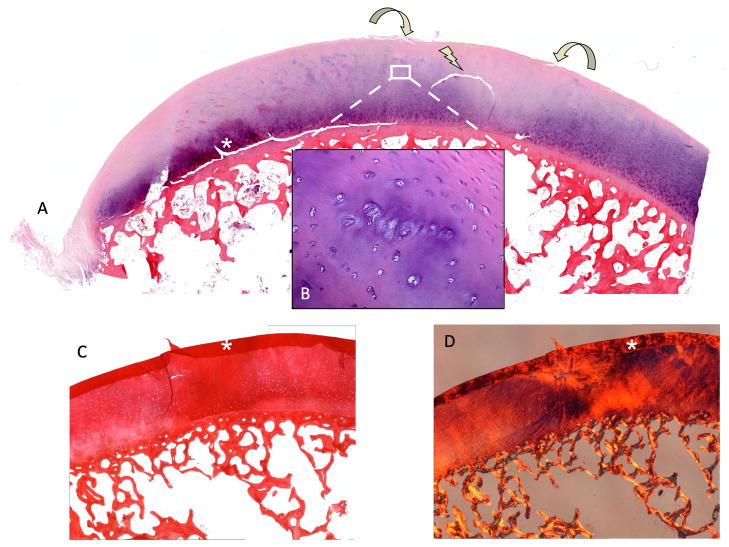
The histological and biochemical investigation revealed five main pathologies in the ROI: 1.) chondrocyte necrosis 2.) reduced proteoglycan content and chondrocyte death (Fig. 5b) 3.) disorganized collagen fiber architecture 4.) initial microscopical superficial fibrillation, and a 5.) horizontal cleft (Fig. 4).
Fig. 5.
A) Section through the ROI with H&E stain. Focal reduction in staining throughout all cartilage layers with a horizontal cleft is visible (arrow). B) CCs within the transitional zone in affected area. A reduced diffusion gradient between synovial fluid and cartilage matrix leads to a decrease in chondrocyte metabolism resulting in chondrocyte death with dissolution of the surrounding matrix, a reduction in pericellular PG and dying CCs (Weichselbaum’s lacunae) [1]. With the loss of PG, COL fibers, usually masked by interstitial matrix become visible (image center). C) (+Fig. 2d) A reduction in PG Safranin-O and changes COL quality (D, polarized light) and orientation Sirius-red (COL) led to a blister-like lesion through hypermobility in the ROI. Biomechanical changes in stiffness and resilience in the transition to normal cartilage led to surface fibrillation (curved arrows).
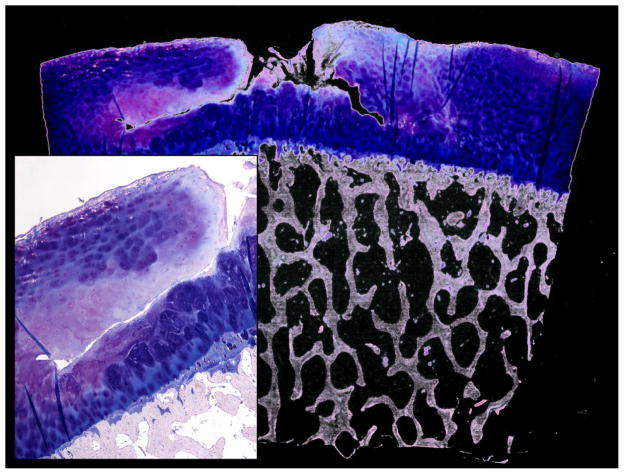
Fig. 4.
Giemsa staining (overview and magnification from a different case) presenting a large horizontal cartilage cleft with vertical surface contact as a probable consequence of pre-damaged cartilage and tissue failure due to loading.
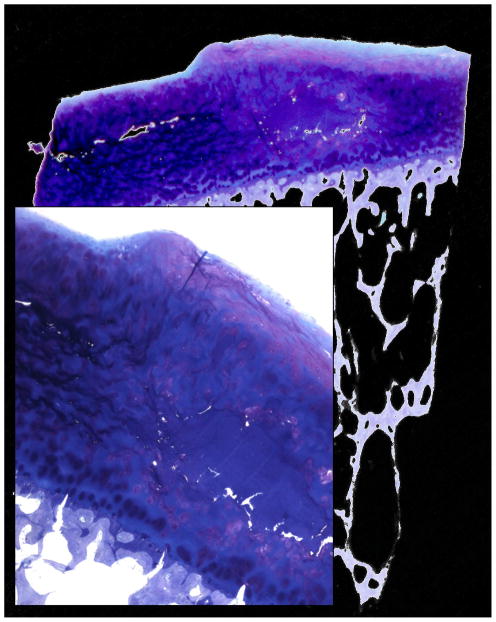
As a pathophysiological principle this means, once the elastic forces of the collagen network are disrupted, GAG, though fewer in quantity, will be able to achieve a higher degree of hydration (H2O ↑) [27]. This is sometimes referred to as ‘swelling’ although a significant difference in cartilage height is rarely observed (Fig. 3 ) [28;29]. The initial local disruption of the superficial layer gives rise to deeper fissures (and less frequent horizontal clefts; Fig. 4) due to high shearing strain.
Fig. 3.
Giemsa staining (overview and magnification from a different case) presenting rarely observed cartilage swelling with surface height differences in the affected area consisting of an acellular matrix surplus (light blue). Additionally fibrous cartilage can be observed on the top surface.
While there were significant increases in T1<rho> in the pathologic ROI compared to the healthy contralateral regions, T2-weighted MRI did not show these changes which may be mainly due to the fact that histopathology did not reveal significant changes in collagen content. In fact, degraded cartilage in OA may show no change in collagen concentration or even increased levels [28;30].
The histopathology and biochemistry confirmed that the changes observed in T1<rho> are correlated with the loss of PG, increased water content and disorganized molecular structure [9]. Previously, T1ρ has been shown to detect depletion of PG in artificially degraded bovine cartilage [6;31;32] but in-vivo data on local intrasubstance changes due to degradation with reference histology and biochemistry are still missing. An in-vivo study by Li et al. [19] was a step forward towards a clinical implementation but time consuming segmentation and quantification is not always feasible in a clinical setting. There is a growing request for image protocols for clinical use, capable of detecting focal changes in cartilage composition before gross structural changes appear. Arthroscopists and musculoskeletal radiologists are well aware of the discrepancies of their tools and modalities. T1<rho> and other cartilage specific sequences [33;34] may build a new bridge between these two specialties. Musculoskeletal pathologists and histology as the standard of reference, although time consuming, should play a pivotal role in validation studies of newly developed MR-sequences [19;24;25;35–45], in particular with regard to interaction between tissue architecture and MR image acquisition [25;43;46–48].
Conclusion
T1ρ, in contrast to clinically applied T2-w sequence was capable of detecting subtle changes in biochemical composition (H2O ↑ + PG ↓+ COL content → ) in early OA of the human knee. This study introduces new insights into pathophysiological changes in human cartilage microstructure depicted by sensitive MR signal and their potential for clinical application.
Further improvements in spatial resolution, protocols and image acquisition will significantly change the way we investigate cartilage pathology in the future.
Acknowledgments
The research was supported by NIH R01 AR46905 and K25 AR053633.
Footnotes
Conflict of interest
The authors state no conflict of interest.
Publisher's Disclaimer: This is a PDF file of an unedited manuscript that has been accepted for publication. As a service to our customers we are providing this early version of the manuscript. The manuscript will undergo copyediting, typesetting, and review of the resulting proof before it is published in its final citable form. Please note that during the production process errors may be discovered which could affect the content, and all legal disclaimers that apply to the journal pertain.
Reference List
- 1.Bullough P. Orthopedic Pathology. Mosby; 2003. [Google Scholar]
- 2.Peterfy CG, Guermazi A, Zaim S, Tirman PF, Miaux Y, White D, Kothari M, Lu Y, Fye K, Zhao S, Genant HK. Whole-Organ Magnetic Resonance Imaging Score (WORMS) of the knee in osteoarthritis. Osteoarthritis Cartilage. 2004;12:177–190. doi: 10.1016/j.joca.2003.11.003. [DOI] [PubMed] [Google Scholar]
- 3.Felson DT. Clinical practice. Osteoarthritis of the knee. N Engl J Med. 2006;354:841–848. doi: 10.1056/NEJMcp051726. [DOI] [PubMed] [Google Scholar]
- 4.Huber M, Trattnig S, Lintner F. Anatomy, biochemistry, and physiology of articular cartilage. Invest Radiol. 2000;35:573–580. doi: 10.1097/00004424-200010000-00003. [DOI] [PubMed] [Google Scholar]
- 5.Maroudas A, Muir H, Wingham J. The correlation of fixed negative charge with glycosaminoglycan content of human articular cartilage. Biochim Biophys Acta. 1969;177:492–500. doi: 10.1016/0304-4165(69)90311-0. [DOI] [PubMed] [Google Scholar]
- 6.Akella SV, Regatte RR, Gougoutas AJ, Borthakur A, Shapiro EM, Kneeland JB, Leigh JS, Reddy R. Proteoglycan-induced changes in T1rho-relaxation of articular cartilage at 4T. Magn Reson Med. 2001;46:419–423. doi: 10.1002/mrm.1208. [DOI] [PubMed] [Google Scholar]
- 7.Duvvuri U, Kudchodkar S, Reddy R, Leigh JS. T(1rho) relaxation can assess longitudinal proteoglycan loss from articular cartilage in vitro. Osteoarthritis Cartilage. 2002;10:838–844. doi: 10.1053/joca.2002.0826. [DOI] [PubMed] [Google Scholar]
- 8.Jazrawi LM, Alaia MJ, Chang G, Fitzgerald EF, Recht MP. Advances in magnetic resonance imaging of articular cartilage. J Am Acad Orthop Surg. 2011;19:420–429. doi: 10.5435/00124635-201107000-00005. [DOI] [PubMed] [Google Scholar]
- 9.Keenan KE, Besier TF, Pauly JM, Han E, Rosenberg J, Smith RL, Delp SL, Beaupre GS, Gold GE. Prediction of glycosaminoglycan content in human cartilage by age, T1rho and T2 MRI. Osteoarthritis Cartilage. 2011;19:171–179. doi: 10.1016/j.joca.2010.11.009. [DOI] [PMC free article] [PubMed] [Google Scholar]
- 10.Menezes NM, Gray ML, Hartke JR, Burstein D. T2 and T1rho MRI in articular cartilage systems. Magn Reson Med. 2004;51:503–509. doi: 10.1002/mrm.10710. [DOI] [PubMed] [Google Scholar]
- 11.Burstein D, Gray M, Mosher T, Dardzinski B. Measures of molecular composition and structure in osteoarthritis. Radiol Clin North Am. 2009;47:675–686. doi: 10.1016/j.rcl.2009.04.003. [DOI] [PubMed] [Google Scholar]
- 12.Burstein D, Bashir A, Gray ML. MRI techniques in early stages of cartilage disease. Invest Radiol. 2000;35:622–638. doi: 10.1097/00004424-200010000-00008. [DOI] [PubMed] [Google Scholar]
- 13.Crema MD, Roemer FW, Marra MD, Burstein D, Gold GE, Eckstein F, Baum T, Mosher TJ, Carrino JA, Guermazi A. Articular cartilage in the knee: current MR imaging techniques and applications in clinical practice and research. Radiographics. 2011;31:37–61. doi: 10.1148/rg.311105084. [DOI] [PMC free article] [PubMed] [Google Scholar]
- 14.Eckstein F, Burstein D, Link TM. Quantitative MRI of cartilage and bone: degenerative changes in osteoarthritis. NMR Biomed. 2006;19:822–854. doi: 10.1002/nbm.1063. [DOI] [PubMed] [Google Scholar]
- 15.Link TM, Stahl R, Woertler K. Cartilage imaging: motivation, techniques, current and future significance. Eur Radiol. 2007;17:1135–1146. doi: 10.1007/s00330-006-0453-5. [DOI] [PubMed] [Google Scholar]
- 16.Recht MP, Goodwin DW, Winalski CS, White LM. MRI of articular cartilage: revisiting current status and future directions. AJR Am J Roentgenol. 2005;185:899–914. doi: 10.2214/AJR.05.0099. [DOI] [PubMed] [Google Scholar]
- 17.Roemer FW, Crema MD, Trattnig S, Guermazi A. Advances in imaging of osteoarthritis and cartilage. Radiology. 2011;260:332–354. doi: 10.1148/radiol.11101359. [DOI] [PubMed] [Google Scholar]
- 18.Trattnig S, Domayer S, Welsch GW, Mosher T, Eckstein F. MR imaging of cartilage and its repair in the knee--a review. Eur Radiol. 2009;19:1582–1594. doi: 10.1007/s00330-009-1352-3. [DOI] [PubMed] [Google Scholar]
- 19.Li X, Cheng J, Lin K, Saadat E, Bolbos RI, Jobke B, Ries MD, Horvai A, Link TM, Majumdar S. Quantitative MRI using T1rho and T2 in human osteoarthritic cartilage specimens: correlation with biochemical measurements and histology. Magn Reson Imaging. 2011;29:324–334. doi: 10.1016/j.mri.2010.09.004. [DOI] [PMC free article] [PubMed] [Google Scholar]
- 20.Li X, Han ET, Ma CB, Link TM, Newitt DC, Majumdar S. In vivo 3T spiral imaging based multi-slice T(1rho) mapping of knee cartilage in osteoarthritis. Magn Reson Med. 2005;54:929–936. doi: 10.1002/mrm.20609. [DOI] [PubMed] [Google Scholar]
- 21.Li X, Benjamin MC, Link TM, Castillo DD, Blumenkrantz G, Lozano J, Carballido-Gamio J, Ries M, Majumdar S. In vivo T(1rho) and T(2) mapping of articular cartilage in osteoarthritis of the knee using 3 T MRI. Osteoarthritis Cartilage. 2007;15:789–797. doi: 10.1016/j.joca.2007.01.011. [DOI] [PMC free article] [PubMed] [Google Scholar]
- 22.Muir H, Bullough P, Maroudas A. The distribution of collagen in human articular cartilage with some of its physiological implications. J Bone Joint Surg Br. 1970;52:554–563. [PubMed] [Google Scholar]
- 23.Regatte RR, Akella SV, Lonner JH, Kneeland JB, Reddy R. T1rho relaxation mapping in human osteoarthritis (OA) cartilage: comparison of T1rho with T2. J Magn Reson Imaging. 2006;23:547–553. doi: 10.1002/jmri.20536. [DOI] [PubMed] [Google Scholar]
- 24.Nieminen MT, Rieppo J, Toyras J, Hakumaki JM, Silvennoinen J, Hyttinen MM, Helminen HJ, Jurvelin JS. T2 relaxation reveals spatial collagen architecture in articular cartilage: a comparative quantitative MRI and polarized light microscopic study. Magn Reson Med. 2001;46:487–493. doi: 10.1002/mrm.1218. [DOI] [PubMed] [Google Scholar]
- 25.Xia Y, Moody JB, Burton-Wurster N, Lust G. Quantitative in situ correlation between microscopic MRI and polarized light microscopy studies of articular cartilage. Osteoarthritis Cartilage. 2001;9:393–406. doi: 10.1053/joca.2000.0405. [DOI] [PubMed] [Google Scholar]
- 26.Witschey WR, Borthakur A, Fenty M, Kneeland BJ, Lonner JH, McArdle EL, Sochor M, Reddy R. T1rho MRI quantification of arthroscopically confirmed cartilage degeneration. Magn Reson Med. 2010;63:1376–1382. doi: 10.1002/mrm.22272. [DOI] [PMC free article] [PubMed] [Google Scholar]
- 27.Mankin HJ, Thrasher AZ. Water content and binding in normal and osteoarthritic human cartilage. J Bone Joint Surg Am. 1975;57:76–80. [PubMed] [Google Scholar]
- 28.Bank RA, Soudry M, Maroudas A, Mizrahi J, TeKoppele JM. The increased swelling and instantaneous deformation of osteoarthritic cartilage is highly correlated with collagen degradation. Arthritis Rheum. 2000;43:2202–2210. doi: 10.1002/1529-0131(200010)43:10<2202::AID-ANR7>3.0.CO;2-E. [DOI] [PubMed] [Google Scholar]
- 29.Chen MH, Broom ND. Concerning the ultrastructural origin of large-scale swelling in articular cartilage. J Anat. 1999;194 ( Pt 3):445–461. doi: 10.1046/j.1469-7580.1999.19430445.x. [DOI] [PMC free article] [PubMed] [Google Scholar]
- 30.Buckwalter JA, Martin J. Degenerative joint disease. Clin Symp. 1995;47:1–32. [PubMed] [Google Scholar]
- 31.Duvvuri U, Reddy R, Patel SD, Kaufman JH, Kneeland JB, Leigh JS. T1rho-relaxation in articular cartilage: effects of enzymatic degradation. Magn Reson Med. 1997;38:863–867. doi: 10.1002/mrm.1910380602. [DOI] [PubMed] [Google Scholar]
- 32.Wheaton AJ, Dodge GR, Elliott DM, Nicoll SB, Reddy R. Quantification of cartilage biomechanical and biochemical properties via T1rho magnetic resonance imaging. Magn Reson Med. 2005;54:1087–1093. doi: 10.1002/mrm.20678. [DOI] [PubMed] [Google Scholar]
- 33.Roemer FW, Kwoh CK, Hannon MJ, Crema MD, Moore CE, Jakicic JM, Green SM, Guermazi A. Semiquantitative assessment of focal cartilage damage at 3T MRI: a comparative study of dual echo at steady state (DESS) and intermediate-weighted (IW) fat suppressed fast spin echo sequences. Eur J Radiol. 2011;80:e126–e131. doi: 10.1016/j.ejrad.2010.07.025. [DOI] [PubMed] [Google Scholar]
- 34.Duc SR, Koch P, Schmid MR, Horger W, Hodler J, Pfirrmann CW. Diagnosis of articular cartilage abnormalities of the knee: prospective clinical evaluation of a 3D water-excitation true FISP sequence. Radiology. 2007;243:475–482. doi: 10.1148/radiol.2432060274. [DOI] [PubMed] [Google Scholar]
- 35.Andresen R, Radmer S, Konig H, Banzer D, Wolf KJ. MR diagnosis of retropatellar chondral lesions under compression. A comparison with histological findings. Acta Radiol. 1996;37:91–97. doi: 10.1177/02841851960371P118. [DOI] [PubMed] [Google Scholar]
- 36.Foster JE, Maciewicz RA, Taberner J, Dieppe PA, Freemont AJ, Keen MC, Watt I, Waterton JC. Structural periodicity in human articular cartilage: comparison between magnetic resonance imaging and histological findings. Osteoarthritis Cartilage. 1999;7:480–485. doi: 10.1053/joca.1999.0243. [DOI] [PubMed] [Google Scholar]
- 37.Fragonas E, Mlynarik V, Jellus V, Micali F, Piras A, Toffanin R, Rizzo R, Vittur F. Correlation between biochemical composition and magnetic resonance appearance of articular cartilage. Osteoarthritis Cartilage. 1998;6:24–32. doi: 10.1053/joca.1997.0089. [DOI] [PubMed] [Google Scholar]
- 38.Goodwin DW, Dunn JF. High-resolution magnetic resonance imaging of articular cartilage: correlation with histology and pathology. Top Magn Reson Imaging. 1998;9:337–347. [PubMed] [Google Scholar]
- 39.Kim DJ, Suh JS, Jeong EK, Shin KH, Yang WI. Correlation of laminated MR appearance of articular cartilage with histology, ascertained by artificial landmarks on the cartilage. J Magn Reson Imaging. 1999;10:57–64. doi: 10.1002/(sici)1522-2586(199907)10:1<57::aid-jmri8>3.0.co;2-4. [DOI] [PubMed] [Google Scholar]
- 40.Kiraly K, Lammi M, Arokoski J, Lapvetelainen T, Tammi M, Helminen H, Kiviranta I. Safranin O reduces loss of glycosaminoglycans from bovine articular cartilage during histological specimen preparation. Histochem J. 1996;28:99–107. doi: 10.1007/BF02331414. [DOI] [PubMed] [Google Scholar]
- 41.McGibbon CA, Trahan CA. Measurement accuracy of focal cartilage defects from MRI and correlation of MRI graded lesions with histology: a preliminary study. Osteoarthritis Cartilage. 2003;11:483–493. doi: 10.1016/s1063-4584(03)00078-5. [DOI] [PubMed] [Google Scholar]
- 42.Monson NL, Haughton VM, Modl JM, Sether LA, Ho KC. Normal and degenerating articular cartilage: in vitro correlation of MR imaging and histologic findings. J Magn Reson Imaging. 1992;2:41–45. doi: 10.1002/jmri.1880020108. [DOI] [PubMed] [Google Scholar]
- 43.Rubenstein JD, Kim JK, Morova-Protzner I, Stanchev PL, Henkelman RM. Effects of collagen orientation on MR imaging characteristics of bovine articular cartilage. Radiology. 1993;188:219–226. doi: 10.1148/radiology.188.1.8511302. [DOI] [PubMed] [Google Scholar]
- 44.Uhl M, Ihling C, Allmann KH, Laubenberger J, Tauer U, Adler CP, Langer M. Human articular cartilage: in vitro correlation of MRI and histologic findings. Eur Radiol. 1998;8:1123–1129. doi: 10.1007/s003300050519. [DOI] [PubMed] [Google Scholar]
- 45.Vahlensieck M, Dombrowski F, Leutner C, Wagner U, Reiser M. Magnetization transfer contrast (MTC) and MTC-subtraction: enhancement of cartilage lesions and intracartilaginous degeneration in vitro. Skeletal Radiol. 1994;23:535–539. doi: 10.1007/BF00223085. [DOI] [PubMed] [Google Scholar]
- 46.Goodwin DW, Wadghiri YZ, Dunn JF. Micro-imaging of articular cartilage: T2, proton density, and the magic angle effect. Acad Radiol. 1998;5:790–798. doi: 10.1016/s1076-6332(98)80264-x. [DOI] [PubMed] [Google Scholar]
- 47.Goodwin DW. MRI appearance of normal articular cartilage. Magn Reson Imaging Clin N Am. 2011;19:215–227. doi: 10.1016/j.mric.2011.02.007. [DOI] [PubMed] [Google Scholar]
- 48.Mosher TJ, Smith H, Dardzinski BJ, Schmithorst VJ, Smith MB. MR imaging and T2 mapping of femoral cartilage: in vivo determination of the magic angle effect. AJR Am J Roentgenol. 2001;177:665–669. doi: 10.2214/ajr.177.3.1770665. [DOI] [PubMed] [Google Scholar]


