Abstract
Previously not shown this study support that mfVEP is an indicator of optic nerve neuropathy in diabetic patients and there could be a correlation between the optic nerve dysfunction and diabetic poly neuropathy. The early optic nerve involvement might explain some of the visual complain in this group of diabetic patients.
Purpose:
To investigate the function of the visual pathway measured by mfVEP (multifocal Visual Evoked Potentials) in patients with diabetic retinopathy and neurophysiologically verified polyneuropathy
Subjects and Methods:
Thirty-two diabetic patients with the same degree of diabetic retinopathy were classified with neurography regarding polyneuropathy and further examined with mfVEP. The mfVEPs of eighteen patients with polyneuropathy were compared to those of fourteen diabetic patients without polyneuropathy and to those of ten nondiabetic subjects.
Results:
Diabetic duration, and the number of patients who had undergone panretinal photocoagulation for proliferative diabetic retinopathy were similar in the two patient groups, 29±13 vs 25±7 years, p=0.3.
Both groups of patients with diabetic retinopathy had significantly lower amplitudes in the mfVEP than the healthy subjects.
In addition the mfVEP amplitudes, which reflect selected areas of the visual function, were significantly reduced in the lower nasal quadrant in patients with neuropathy compared to patients without neuropathy.
Conclusion:
The results indicate that mfVEP could be an indicator of optic nerve neuropathy in patients with diabetic retinopathy. The early optic nerve involvement might explain some of the visual complaints in this group of diabetic patients.
Keywords: Diabetic retinopathy, neuropathy, multifocal VEP (mfVEP).
INTRODUCTION
Diabetic retinopathy is usually considered as a vascular disease, known to cause vision loss and blindness [1]. Additionally, attention has been paid to the neurodegenerative aspects [2], and functional studies with pattern electroretinography (pERG) [3], and multifocal ERG (mfERG)[4] have been done.
Until recently the standard form of visual evoked potential (VEP) has been the objective method for measuring the function of the optic nerve and the visual pathways [5]. Since VEP reflects the total response from the visual pathways, the multifocal visual evoked potential (mfVEP) enhances our possibility to further evaluate the cortical responses on stimulation of localized retinal areas [6-8]. These developments of mfVEP give us new opportunities to evaluate the neurodegenerative component involved in the pathogenesis of diabetic retinopathy.
While several studies have focused on the correlation between retinopathy and nephropathy, the relationship between retinopathy and neuropathy is poorly documented, but half of all diabetic patients will experience neuropathy [9,10]. If neuropathy is an important component in the pathogenesis of diabetic retinopathy then patients with clinical polyneuropathy might demonstrate more deficits in the visual function measured with mfVEP.
The purpose of the present study was to determine whether diabetic patients demonstrate signs of changed neural function measured with mfVEP compared to normals and patients with the same degree of retinopathy with and without polyneuropathy.
METHODS
Subjects
Thirty-two consecutive diabetic patients with and without neuropathy and regularly attending the Medicine and Ophthalmology departments in Lund and Malmö were included. Ten healthy age similar volunteers with no previous eye disorder and a best corrected visual acuity (VA) of 20/20 were included for comparison. The right eye in each patient was examined. The research procedures were in accordance with institutional guidelines and the Declaration of Helsinki. The study was approved by the Committee of Ethic at the University Hospital of Lund
Ophthalmological Examination and Grading of Retinopathy
The best visual acuity after correction was assessed using a Snellen Charts at a distance of 6.0 meter. The classification of retinopathy was based on findings from fundus photographs using a 45° Topcon camera including the three areas nasal, temporal and the central with stereo photo. The degree of retinopathy was based on three retinopathy levels as; no retinopathy, background retinopathy, and sight-threatening retinopathy. Sight-threatening retinopathy included clinically significant macular oedema and/or severe non-proliferative retinopathy according to definitions by the ETDRS [11], or clinically significant macular oedema and/or proliferative retinopathy. Proliferative retinopathy was considered most severe, followed by severe non-proliferative retinopathy and clinically significant macular oedema.
Eyes with clinically significant macular oedema with visual acuity over 0.2 and a duration not longer than 6 months were treated according to guidelines from the ETDRS [12], and eyes with proliferative retinopathy were treated according to DRS [13]. Only eyes without a visible cataract using a slit-lamp biomicroscopy were included in the study. The mean number of laser shots given was for macular edema 200 barely visible shots and for panretinal photocoagulation on average 1800 laser shots.
Analytical Techniques
HbA1c levels were analysed by ion-exchange chromatography using commercially available microcolumns (Bio-Rad, Richmond, CA) or by fast liquid chromatography (Kontron Instruments, Milan, Italy). The upper normal reference range for both methods is <5.3%.
Neurophysiology
To distinguish the diabetes group into two, with or without diabetic neuropathy, neurography was performed on one side in the following nerves: Motor conduction velocities, distal motor latencies, response amplitudes, and F-wave latencies in median and peroneal nerves; Sensory conduction velocities and response amplitudes in the median (on stimulation of dig I and dig III) and sural nerves. In addition, thresholds for detecting warm and cold on the lateral part of the foot and vibration on the big toe and tibia were measured.
MfVEP
MfVEPs were recorded using the Visual Evoked Response Imaging System (VERIS 4.3) (EDI. San Mateo, CA), developed by Sutter et al. [14], Baseler et al. [15], Baseler and Sutter [16]. A cathode ray tube (CRT) monitor with a refresh rate of 75 Hz was used for recording and the stimuli had the appearance of a dartboard containing 60 segments [16]. The monitor was a part of a system with a refractor unit in combination with an infrared eye camera to monitor the position of the eye. The segments were cortically scaled in order to produce 60 recordings of approximately similar amplitude from the visual cortex. Each segment contained a checkerboard pattern with 16 checks, 8 white and 8 black that contrast reversed in pseudorandom binary m-sequences at 75 Hz. The m -sequence chosen for this study was16 with the total recording time of 14 minutes divided into 8 segments. The signals were amplified 100 000 times and were passed through a band-pass filter between 3 and 100 Hz. The 1st slice of the 2nd order kernel was extracted from the responses for further analysis. At the viewing distance of 5 cm the radius of the stimulus array subtended approximately 20-25 degrees.
Recordings
Three pairs of electrodes and three different electrode positions were used. One pair of electrodes was placed on the inion and 4 cm above the inion. The other two pairs were distributed 4 cm to the left and 4 cm to the right of the first pair of electrodes. The ground electrode was placed behind the right ear.
Two channel registrations were used during the same stimulation. Each run contained 16 segments of 27 seconds with a total recording time of 7.2 min.
The subjects were seated comfortably to minimize muscle interactions fixating the center of the dartboard approximately 5 cm from the screen of the IR camera. The pupils were undilated and the stimulation was monocular. The contra lateral eye was carefully occluded to prevent light stimulation of this eye. A dim room light was used as a background illumination [8,17]. By using VERIS system refractor/camera unit the patient has possibility to adjust the refractor for best vision and by the IR camera the fixation could be monitored during the whole recording procedure. If a patient couldn’t co operate during a test, it was repeated.
Analysis
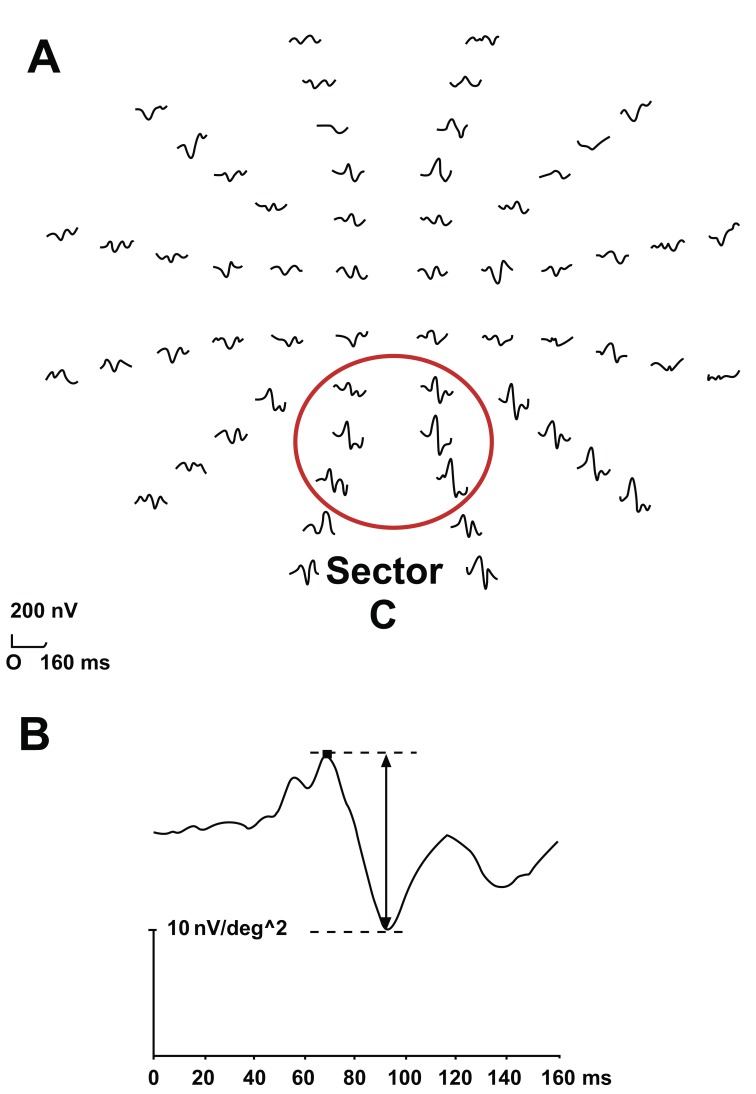
The two first components in the response, similar to the P70 and N100 in the classic VEP as described by Betsuin et al.6 were identified and the peak-to-peak amplitude was measured (Fig. 1).
Fig. (1).
A normal mfVEP. (A) Cortical responses to stimulation of 60 segments in the central visual field. The ring indicates sector C, the region with the highest amplitudes when measured with the midline electrodes. (B) The arrow indicates the peak-to-peak amplitude of the first two components according to VERIS program, which correlate to N 70 and P 100 in the classic VEP.
Responses were recorded with midline electrodes on stimulation of six segments in a defined central region (sector C) where the highest signal to noise level could be measured [18].
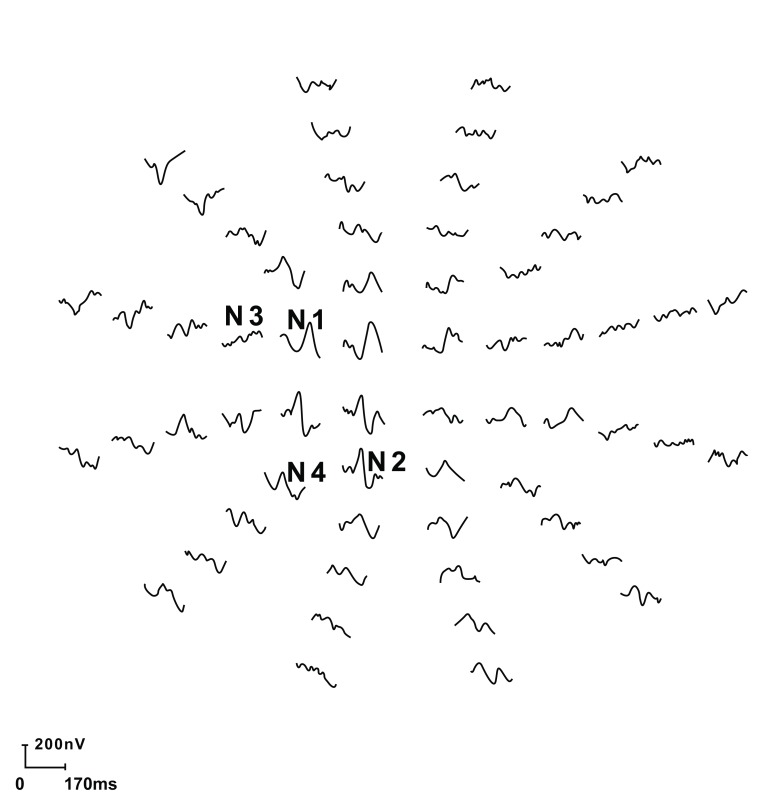
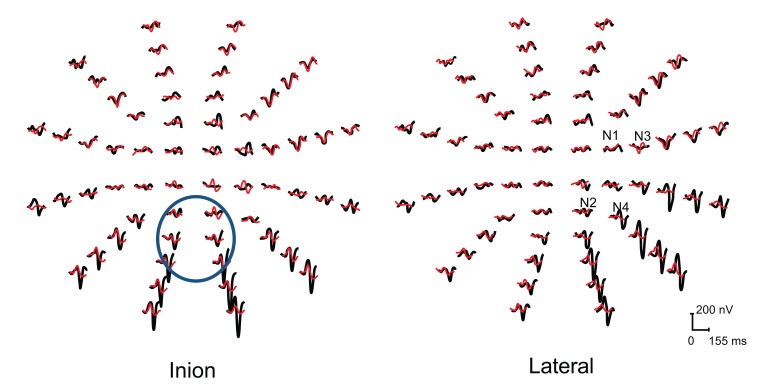
In addition the mfVEP amplitudes, which reflect the upper and lower nasal quadrant of the visual function and further responses of four nasal specific central segments with in previous study have demonstrated the highest signal-to-noise ratio (N1, N2, N3, N4) were analyzed (Fig. 2). The measurements were compared between the two diabetic groups as well as between the patients and the normal controls (Fig. 3) [9].
Fig. (2).
Responses on stimulation of the right eye in a normal eye. N1, N2, N3, N4 are the four segments in the nasal visual field with the highest signal-to-noise ratio.
Fig. (3).
MfVEP responses from the left eye two patients included in the study with neuropathy (red traces) and with out neuropathy (black traces). The traces comprise both central (a) and temporal (b) recordings.
Statistical Methods
Mann- Whitney U-test for two independent samples was used since the distribution is skewed. To evaluate differences in proportions between groups, the Chi-square test was used. A significance level of <0.05 was considered significant. The calculations were made in SPSS for Windows version 16.0.
RESULTS
Patient Characteristics
Eighteen patients with diabetic retinopathy and neurophysiologically verified polyneuropathy and 14 patients with diabetic retinopathy but without neuropathy were included in the study. Age was similar between diabetic patients and non-diabetic control subjects, 53 ± 10 years vs 46 ± 7 years; p=0.052, and also between diabetic patients without neuropathy and non-diabetic patients 47 ± 9 years vs 46 ± 7 years; p=0.93.
Diabetic patients with neuropathy were older than diabetic patients without 59 ± 7 vs 47 ± 9 years; p<0.01, but diabetes duration was similar 29 ± 13 vs 25 ± 7 years; p=0.3, as was the mean level of HbA1c 7 ± 1% vs 6.6 ± 0.7%; p=0.3.
Diabetic Retinopathy and Visual Acuity
The degree of diabetic retinopathy and number of photocoagulated eyes did not differ between patients with and without neuropathy (Table 1).
Table 1.
Diabetic Retinopathy in Patients with and without Neuropathy
| Retinopathy Degree | Neuropathy (n= 18) | No Neuropathy (n=14) | P Value |
|---|---|---|---|
| Right Eye | |||
| Background | 6 | 5 | |
| Macular oedema | 4 | ||
| Proliferative retinopathy | 12 | 5 | 0.083 |
| Left Eye | |||
| Background | 6 | 7 | |
| Macular oedema | 2 | 2 | |
| Proliferative retinopathy | 12 | 5 | 0.083 |
In patients with neuropathy 12/18 right eyes had sight-threatening retinopathy (i.e. macular oedema and/or proliferative retinopathy) vs 9/14 right eyes in patients without neuropathy, p= 0.89.
No difference was seen in the visual acuity of right eyes between patients with and without neuropathy, 0.9; 0.3-1.0 (md, range) vs 1.0; 0.4-1.0 (md, range); p=0.30.
Multifocal VEP in Diabetic Patients
The amplitudes of the responses from the central sector C, mediated by both uncrossed and crossed visual pathways, were similar in the two diabetic patient groups, as was the amplitude response from the nasal upper and lower quadrant sections (Table 2).
Table 2.
Multifocal VEP in Diabetic Patients
| Amplitude (nV/ deg2) | Neuropathy (n= 18) | No Neuropathy (n=14) | P Value |
|---|---|---|---|
| Right Eye | |||
| Inion | 8.2 ± 3.4 | 6.9 ± 4.4 | 0.19 |
| Upper nasal quadrant | 3.2 ± 1.4 | 3.3 ± 1.0 | 0.78 |
| Lower nasal quadrant | 4.6 ± 1.8 | 4.7 ± 1.7 | 0.93 |
| N1 | 24 ± 16 | 35 ± 15 | 0.020* |
| N2 | 28 ± 18 | 37 ± 13 | 0.099 |
| N3 | 20 ± 12 | 28 ± 10 | 0.054 |
| N4 | 34 ± 27 | 50 ± 31 | 0.32 |
| Left Eye | |||
| Inion | 18 ± 25 | 24 ± 27 | 0.135 |
| N1 | 21 ± 9 | 33 ± 15 | 0.008 ** |
| N2 | 30 ± 19 | 38 ± 24 | 0.377 |
| N3 | 24 ± 15 | 33 ± 13 | 0.045 * |
| N4 | 32 ± 20 | 40 ± 20 | 0.125 |
P>0.05
P> 0.01
*** P> 0.001.
These two quadrants were further investigated in separated nasal sectors and within the diabetic group the amplitudes of the responses were lower in patients with neuropathy compared to patients without neuropathy (Table 2).
Diabetic Patients Compared to Non-Diabetic Subjects
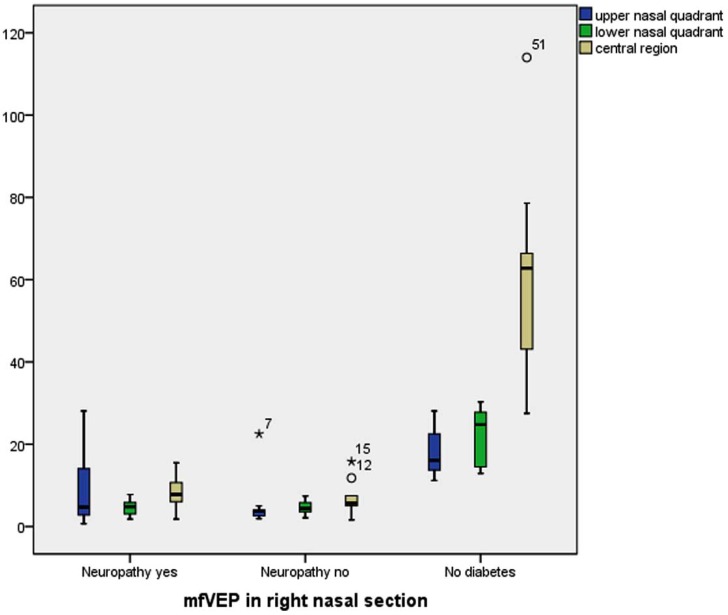
The amplitudes of the responses from a central region (previous described as sector C), the upper and lower nasal quadrants and the response amplitudes from the segments N1-N4 of the right eye was significantly lower in diabetic patients compared to healthy volunteers (n=10) (Table 3, Fig. 4).
Table 3.
Multifocal VEP in Patients with and without Diabetes
| Amplitude (nV/ deg2 | Diabetic Patients (n= 32) | None Diabetics (n=10) | P Value |
|---|---|---|---|
| Right Eye | |||
| Inion | 7.8 ± 3.7 | 60.8 ± 24.2 | 0.000*** |
| Upper nasal quadrant | 3.2 ± 1.3 | 17.7 ± 5.5 | 0.000*** |
| Lower nasal quadrant | 4.6 ± 1.7 | 22.2 ± 6.9 | 0.000*** |
| N1 | 29 ± 16 | 55 ± 31 | 0.000*** |
| N2 | 32 ± 16 | 69 ± 56 | 0.012* |
| N3 | 24 ± 11 | 56 ± 60 | 0.001*** |
| N4 | 36 ± 25 | 68 ± 42 | 0.000*** |
| Left Eye | |||
| Inion | 21 ± 26 | 28 ± 11 | 0.002** |
| N1 | 26 ± 13 | 56 ± 45 | 0.002 ** |
| N2 | 34 ± 21 | 68 ± 42 | 0.001*** |
| N3 | 28 ± 15 | 62 ± 30 | 0.000*** |
| N4 | 35 ± 20 | 57 ± 30 | 0.012* |
P>0.05
P> 0.01
P> 0.001.
Fig. (4).
MfVEP responses from nasal sections in patients with no diabetes in comparison to diabetes with or without neuropathy.
Comparing diabetic eyes not previously laser treated (n=11) with non diabetic eyes demonstrated lower amplitudes in diabetic eyes in upper nasal quadrant (9±10 vs 18±5 nV/ deg2 ; p=0.048), lower nasal quadrant (5±2 vs 22±7 nV/ deg2 ;p=0.001) and central region (8±4 vs 61±24 nV/ deg2; p=0.001).
DISCUSSION
During the last years several authors have pointed at neuropathy being an important component in the pathogenesis of diabetic retinopathy [2,4,19]. Muller cells and neurons are known to express vascular endothelial growth factor in vivo in diabetes [20] and electrophysiologic tests are affected early in diabetes, preceding clinical signs of retinopathy [4,21]. Furthermore, prolonged latencies of VEP responses in diabetics without retinopathy have been demonstrated as a sign of neurodegenerative involvement [22]. In accordance to this, patients with clinical neuropathy, which also influence higher levels of CNS [23] might demonstrate more deficits in the mfVEP recordings than patients without neuropathy, but with the same degree of retinopathy.
Testing with visual evoked potential VEP provides data from the visual pathways and pathologic changes in VEP latencies have been reported in patients with diabetes [24], and in diabetics with polyneuropathy [25]. As the classic VEP reflects the total visual response, minor or localized pathology along the visual pathway could be difficult to verify, and a further investigation with multifocal VEP would be of interest [8].
In the present study we could demonstrate that patients with diabetes had significantly lower amplitudes in all recorded areas. In addition diabetic patients with polyneuropathy had significantly lower amplitudes in a localized area representing the uncrossed visual pathways compared to patients without neuropathy but with the same degree of retinopathy. Interestingly, Guillery and Taylor [26] reported that crossed pathways degenerate more slowly than the uncrossed ones. Since equal many eyes were laser treated in diabetic with and without neuropathy this is not likely to have influenced the results. Furthermore, when comparing diabetic eyes not previously laser treated with non diabetic eyes there was a significant difference in the amplitudes in the nasal section.
The responses from the sector C region, reflecting both crossed and uncrossed visual pathways [6, 7], were equal in patients with and without neuropathy, but significantly lower compared to non-diabetic patients.
Diabetes duration is known to be one of the most important risk factors for the development of both neuropathy [27], and a correlation between diabetes duration and VEP latencies has been demonstrated [22]. In the present study, diabetes duration was similar in patients with and without neuropathy and can not have influenced the results.
CONCLUSION
The results of this study suggest that mfVEP could be an indicator of neurodegenerative influence on bipolar cells and of optic nerve neuropathy in patients with diabetic retinopathy and that there is a correlation between this dysfunction and diabetic neuropathy. This neurodegenerative influence and optic nerve involvement might explain some of the visual complaints in this group that cannot be explained by retinopathy alone.
ACKNOWLEDGEMENTS
Declared none.
CONFLICT OF INTEREST
The authors confirm that this article content has no conflict of interest.
REFERENCES
- 1. Moss SE, Klein R, Klein BEK. Ten-year incidence of visual loss in a diabetic population. Ophthalmology. 1994;101:1061–70. doi: 10.1016/s0161-6420(94)31217-6. [DOI] [PubMed] [Google Scholar]
- 2. Lieth E, Gardner TW, Barber AJ, Antonetti DA. Retinal neurodegeneration: early pathology in diabetes. Clin Exp Ophthalmol. 2000;28:3–8. doi: 10.1046/j.1442-9071.2000.00222.x. [DOI] [PubMed] [Google Scholar]
- 3. Prager TC, Garcia CA, Mincher CA, Mishra J, Chu HH. The pattern elektroretinogram in diabetes. Am J Ophthalmol. 1990;109:279–84. doi: 10.1016/s0002-9394(14)74550-7. [DOI] [PubMed] [Google Scholar]
- 4. Palmowski AM, Sutter EE, Bearse MA, Jr, Fung W. Mapping of retinal function in diabetic retinopathy using the multifocal electroretinogram. Invest Ophthalmol Vis Sci. 1997;38:2586–96. [PubMed] [Google Scholar]
- 5. Celesia GG, Bodis-Wollner I, Chatrian GE, Harding GFA, Sokol S, Spekreijse H. Recommended standards for elektroretinograms and visual evoked potentials. Elektroenceph Clin Neurophysiol. 1993; 87:421–36. doi: 10.1016/0013-4694(93)90157-q. [DOI] [PubMed] [Google Scholar]
- 6. Betsuin Y, Mashima Y, Ohde H, Inoue R, Oguchi Y. Clinical application of the multifocal VEPs. Curr Eye Res. 2001;22:54–63. doi: 10.1076/ceyr.22.1.54.6982. [DOI] [PubMed] [Google Scholar]
- 7. Hood D, Greenstein V. The multifocal VEP and ganglion cell damage: applications and limitations for the study of glaucoma. Prog Ret Eye Res. 2003;22:201–51. doi: 10.1016/s1350-9462(02)00061-7. [DOI] [PubMed] [Google Scholar]
- 8. Bengtsson M, Andréasson S, Andersson G. Multifocal visual evoked potentials-a method study of responses from small sectors of the visual field. Clin Neurophysiol. 2005;116:1975–83. doi: 10.1016/j.clinph.2005.04.009. [DOI] [PubMed] [Google Scholar]
- 9. Dyck PJ, Kratz KM, Karnes JL, et al. Prevalence by staged severity of variuos types of diabetic neuropathy, nephropathy and retinopathy in a population-based cohort: the Rochester Diabetic Neuropathy Study. Neurology. 1993;43:817–24. doi: 10.1212/wnl.43.4.817. [DOI] [PubMed] [Google Scholar]
- 10. Boulton AJM. Treatment of symptomatic diabetic neuropathy. Diabetes Metab Res. 2003;19:16–21. doi: 10.1002/dmrr.361. [DOI] [PubMed] [Google Scholar]
- 11. Early Treatment Diabetic Retinopathy Study Research Group. Photocoagulation for diabetic macular oedema: ETDRS report number 1. Arch Ophthalmol. 1985;103:1796–806. [PubMed] [Google Scholar]
- 12.Waheed A. Early Treatment Diabetic Retinopathy Study Research Group. Treatment techniques and clinical guidelines for photocoagulation of diabetic macular oedema. Ophthalmology. 1987;94:761–74. doi: 10.1016/s0161-6420(87)33527-4. [DOI] [PubMed] [Google Scholar]
- 13. Diabetic Retinopathy Study Research Group. Photocoagulation treatment of proliferative diabetic retinopathy: clinical applications of Diabetic Retinopathy Study (DRS) findings. Ophthalmology . 1981;88:583–600. [PubMed] [Google Scholar]
- 14. Sutter E, Tran D. The Field Topographv of ERG components in Man—I. The Photopic Luminance Response. Vision Res. 1992;32:433–46. doi: 10.1016/0042-6989(92)90235-b. [DOI] [PubMed] [Google Scholar]
- 15. Baseler HA, Sutter EE, Klein SA, Carrey T. The topography of visual evoked properties across the visual field. Electroencephalogr Clin Neurophysiol. 1994;90:65–81. doi: 10.1016/0013-4694(94)90114-7. [DOI] [PubMed] [Google Scholar]
- 16. Baseler HA, Sutter EE. M and P components of the VEP and their visual field distribution. Vision Res. 1997;37:675–90. doi: 10.1016/s0042-6989(96)00209-x. [DOI] [PubMed] [Google Scholar]
- 17. Gränse L, Andréasson S, Ponjavic V. Full-field ERG multifocal ERG and multifocal VEP in patients with retinitis pigmentosa and residual central visual fields. Acta Ophthalmol Scand. 2004;82(6 ):701–6. doi: 10.1111/j.1600-0420.2004.00362.x. [DOI] [PubMed] [Google Scholar]
- 18. Gränse L, Bergstrand I, Thiselton D, et al. Electrophysiology and ocular blood flow in a family with dominant optic nerve atrophy and a mutation in the OPA1 gene. Ophthalmic Genetics. 2003;24:233–45. doi: 10.1076/opge.24.4.233.17230. [DOI] [PubMed] [Google Scholar]
- 19. Mitzutani M, Gerhardinger C, Lorenzi M. Müller cell changes in human diabetic retinopathy. Diabetes. 1998;47:445–9. doi: 10.2337/diabetes.47.3.445. [DOI] [PubMed] [Google Scholar]
- 20. Amin RH, Frank RN, Kennedy A, Eliott D, Puklin JE, Abrams GW. Vascular endothelial growth factors is present in glial cells of the retina and optic nerve of human subjects with non-proliferative diabetic retinopathy. Invest Ophthalmol Vis Sci. 1997;38:36–47. [PubMed] [Google Scholar]
- 21. Han Y, Schneck ME, Bearse MA, et al. Formulation and evaluation of a predictive model to identify the sites of future diabetic retinopathy. Invest Ophthalmol Vis Sci. 2004;45:4106–12. doi: 10.1167/iovs.04-0405. [DOI] [PubMed] [Google Scholar]
- 22. Anastasi M, Lauricella M, Giordano C, Galluzzo A. Visual evoked potentials in insulin-dependent diabetics. Acta Diabetol Lat. 1985;22:343–9. doi: 10.1007/BF02624753. [DOI] [PubMed] [Google Scholar]
- 23. Kapur D. Neuropathic pain and diabetes. Diabetes Metab Res. 2003;19:9–15. doi: 10.1002/dmrr.359. [DOI] [PubMed] [Google Scholar]
- 24. Varkonyi T, Peto T, Degi R, et al. Impairment of visual evoked potentials. Diabetes Care. 2002;25:1661–2. doi: 10.2337/diacare.25.9.1661. [DOI] [PubMed] [Google Scholar]
- 25. Mariani E, Moreo G, Colucci GB. Study of visual evoked potentials in diabetics without retinopathy: correlations with clinical findings and polyneuropathy. Acta Neurol Scand. 1990;81:337–40. doi: 10.1111/j.1600-0404.1990.tb01566.x. [DOI] [PubMed] [Google Scholar]
- 26. Guillery RW, Taylor JS. Links different rates of axonal degeneration in the crossed and uncrossed retinofugal pathways. J Neurocytol. 1993;22:707–16. doi: 10.1007/BF01181316. [DOI] [PubMed] [Google Scholar]
- 27.The Diabetes Control and Complications Trial Research Group. The effect of intensive diabetes therapy on the development and progression of neuropathy. Ann Intern Med. 1995;122:561–8. doi: 10.7326/0003-4819-122-8-199504150-00001. [DOI] [PubMed] [Google Scholar]


