

Background: ADNP is vital for embryonic development. Is this function conserved for the homologous protein ADNP2?
Results: Down-regulation/silencing of ADNP or ADNP2 in zebrafish embryos or mouse erythroleukemia cells inhibited erythroid maturation, with ADNP directly associating with the β-globin locus control region.
Conclusion: ADNPs are novel molecular regulators of erythropoiesis.
Significance: New regulators of globin synthesis are suggested.
Keywords: Development, Erythrocyte, Erythropoeisis, Hemoglobin, Neurodevelopment
Abstract
Activity-dependent neuroprotective protein (ADNP) and its homologue ADNP2 belong to a homeodomain, the zinc finger-containing protein family. ADNP is essential for mouse embryonic brain formation. ADNP2 is associated with cell survival, but its role in embryogenesis has not been evaluated. Here, we describe the use of the zebrafish model to elucidate the developmental roles of ADNP and ADNP2. Although we expected brain defects, we were astonished to discover that the knockdown zebrafish embryos were actually lacking blood and suffered from defective hemoglobin production. Evolutionary conservation was established using mouse erythroleukemia (MEL) cells, a well studied erythropoiesis model, in which silencing of ADNP or ADNP2 produced similar results as in zebrafish. Exogenous RNA encoding ADNP/ADNP2 rescued the MEL cell undifferentiated state, demonstrating phenotype specificity. Brg1, an ADNP-interacting chromatin-remodeling protein involved in erythropoiesis through regulation of the globin locus, was shown here to interact also with ADNP2. Furthermore, chromatin immunoprecipitation revealed recruitment of ADNP, similar to Brg1, to the mouse β-globin locus control region in MEL cells. This recruitment was apparently diminished upon dimethyl sulfoxide (DMSO)-induced erythrocyte differentiation compared with the nondifferentiated state. Importantly, exogenous RNA encoding ADNP/ADNP2 significantly increased β-globin expression in MEL cells in the absence of any other differentiation factors. Taken together, our results reveal an ancestral role for the ADNP protein family in maturation and differentiation of the erythroid lineage, associated with direct regulation of β-globin expression.
Introduction
The highly conserved activity-dependent neuroprotective protein (ADNP)5 and ADNP2 constitute a protein family, containing zinc finger motifs and a homeobox profile (1, 2). ADNP was originally cloned from P19 teratocarcinoma cells induced to differentiate into neuroglia (1). In this cell line, ADNP was found to associate with chromatin upon neuro-differentiation, and co-immunoprecipitations identified binding with heterochromatin protein 1α (3). Additionally, ADNP directly interacts with Brg1, a member of the mating-type switching/sucrose nonfermenting (SWI/SNF) chromatin-remodeling complex (4).
During embryogenesis, pronounced ADNP expression was found in the developing mouse brain, and ADNP was identified as essential for brain development (5). ADNP knock-out mice exhibited marked growth retardation, failure to complete axial rotation, and defects in the closure of the cranial neural tube and did not survive beyond embryonic day 9.5 (E9.5) (5). At this developmental point, ADNP was shown to regulate >400 genes, including genes associated with organogenesis, neurogenesis, and heart development (3).
ADNP2 is an ADNP homologue with 33% identity and 46% similarity (2), exhibiting ADNP-like expression patterns during mouse embryogenesis and adulthood. ADNP2 was associated with cell survival and protected P19 cells from oxidative damage (6), similar to ADNP that has been shown to protect neuron-like cells (7).
This study was set out to elucidate ADNP and ADNP2 developmental function. Considering the high homology between ADNP2 and ADNP, we assumed that ADNP2 may also have an important role during development. Here, RNA knockdown experiments in the developing zebrafish vertebrate model, presenting external fertilization, rapid development, and embryonic optical transparency (8), revealed an essential role for the ADNP protein family in erythropoiesis. This finding was confirmed in mouse erythroleukemia (MEL) cells. Direct recruitment of ADNP to the β-globin LCR posits a mechanistic basis to the regulation of erythropoiesis.
EXPERIMENTAL PROCEDURES
Fish Maintenance and Isolation of Zebrafish ADNP and ADNP2 Genes
Standard wild-type zebrafish strains (TL and AB) were cross-bred and maintained as described previously (9). Alignment of human ADNP and ADNP2 sequences with the zebrafish genome identified four ADNP and ADNP2 orthologues. The EMBOSS Pairwise Alignment Algorithm and ClustalW were used for two-sequence alignment or multiple sequence alignment, respectively. The coding sequence of the four zebrafish genes was isolated from cDNA of 24-h post-fertilization (hpf) embryos and cloned into the pGEM-T-easy vector (Promega, Madison, WI) in two fragments. These plasmids were used as templates to produce digoxygenin-labeled antisense RNA for whole-mount in situ hybridization (WMISH).
Morpholino Knockdown Experiments
Gene knockdown experiments were performed using injection of morpholino-modified antisense oligonucleotides (MO, Gene-Tools, Philomath, OR) into wild-type embryos immediately after fertilization, at the one- or two-cell stage embryo (within the 1st hpf, 2 nl, 1–2 mm). 4–6 independent experiments were performed for each MO. Six splicing MOs were designed. adnp1a-sp1MO (5′-TAGTCCTGCAACATTTGAGAAACCA-3′) and adnp2b-spMO (5′-TTCCCACTGAGGATGGAAAATTCTT-3′), directed to intron3-exon4 boundary, were designed to block adnp1a and adnp2b, respectively. Four additional splicing blocking MOs were tested and are described in supplemental Table S1. The resulting RNA species were evaluated by reverse-transcription-PCR (supplemental Fig. S1). Translation MOs were designed to block adnp1b, adnp2a, and adnp2b (adnp1b-tMO, 5′-TTGTTCACTGGGAGTTGAAACATTC-3′; adnp2a-tMO, 5′-CACTGGAATCTGATACATTTTGCTC-3′; and adnp2b-tMO, 5′-ACCTTTTACTGGAAACTGGTACATG-3′). BLAST analysis was performed to verify the specificity of MO targets (supplemental Fig. S2). Gene-Tools standard control MO, which has not been reported to have other targets or generate any phenotypes, was used as a negative control (5′-CCTCTTACCTCAGTTACAATTTATA-3′).
Criteria for Evaluating the Status of Zebrafish Blood and Hemoglobin Staining
Blood circulation was evaluated at 48 hpf for adnp2a-tMO-injected embryos and at 72 hpf for the other MO, when red blood is easily seen. Based on observations, embryos were divided to have normal blood cells, no blood cells, or hypochromic and/or fewer blood cells. Hemoglobin was detected ENREF_26 in whole embryos using o-dianisidine staining (supplemental material) (10).
Whole-mount in Situ Hybridization
Transcripts of scl (NM_213237), lmo2 (NM_131111), gata1 (NM_131234), band3 (NM_198338), embryonic α-globin 1 (NM_182940), lys-C (NM_139180), l-plastin (NM_131320), ikaros (NM_130986), c-myb (NM_131266), irx7 (NM_131881), flk1 (NM_131472), cmlc2 (NM_131329), adnp1a (NM_001080015), adnp1b (XM_002666474), adnp2a (NM_001098265), and adnp2b (NM_001080013) were detected by WMISH using digoxygenin-labeled antisense RNA probes at a concentration of 1 ng/μl. Transcription of RNA probes was performed from pGEM-T Easy plasmids linearized before the coding sequence using SP6 or T7 RNA polymerases (digoxygenin RNA labeling kit, Roche Applied Science). Embryos at different developmental stages were fixed overnight in 4% paraformaldehyde, stored in 100% methanol, and subjected to the WMISH procedure as described previously (9, 11) (supplemental material).
Murine Erythroleukemia Cell Line
MEL cells were a gift from Prof. Nurit Shaklai (Tel Aviv University, Israel). Cells were cultured as described previously (12). A 3-day treatment with 2% DMSO (v/v, Sigma) was used to induce erythroid differentiation. Benzidine staining was performed as described previously (13).
RNA Interference and Transfections
Two short hairpin RNA (shRNA) clones (sh68 and sh71, Sigma) were used for mouse ADNP (NM_009628) silencing (14). To preclude off-target effects, a control shRNA vector containing a nonspecific green fluorescent protein (GFP) fragment in pRetroSuper plasmid that does not have a match in the mouse genome was used (4). For mouse ADNP2 (NM_175028) silencing, a mixture of two stealth small-interfering RNA (siRNA) duplexes (Invitrogen) was used (6). Transfections were performed using Lipofectamine2000 (Invitrogen) as described in the supplemental material. RNA was extracted on the 3rd experimental day and expression levels of ADNP, ADNP2, band3, β-globin, c-kit, and Brg1 were evaluated.
Rescue and RNA Overexpression
Mouse ADNP and ADNP2 RNA were synthesized using the mMESSAGE mMACHINE kit with T7 promoter (Ambion, Austin, TX) from pGEM-T-Easy plasmids containing mouse ADNP and ADNP2 coding sequence. Control RNA encoding Xenopus elongation factor 1α was synthesized to monitor for nonspecific effects.
Two experiments were designed as follows: 1) ADNP/ADNP2 RNA rescue experiment, aimed to demonstrate specificity of the ADNP and ADNP2 knockdown phenotypes, in DMSO-treated MEL cells; 2) RNA overexpression experiment in MEL cells, examining erythroid differentiation efficacy of ADNP/ADNP2 RNA species as a substitutes for DMSO.
For ADNP rescue experiments, 1 × 10⁵ cells/well were plated on 24-well plates in 300 μl of serum-free medium (Invitrogen), and transfected with the following: 1) control shRNA plasmid (control, 900 ng); 2) ADNP shRNA plasmid (sh68, 900 ng); 3) ADNP shRNA plasmid (900 ng) plus control RNA (400–500 ng); 4) ADNP shRNA plasmid (900 ng) plus ADNP RNA (400–500 ng); and 5) control shRNA plasmid (900 ng) plus ADNP RNA (400–500 ng).
For ADNP2 rescue experiments, 5 × 10⁴ cells/well were plated on 24-well plates in 100 μl of serum-free medium and transfected as follows: 1) scrambled ADNP2 siRNA sequence (control, 50 pmol); 2) ADNP2 siRNA (siADNP2, 50 pmol); 3) ADNP2 siRNA (50 pmol) plus control RNA (400 ng); 4) ADNP2 siRNA (50 pmol) plus ADNP2 RNA (400 ng); and 5) control siRNA (50 pmol) plus ADNP2 RNA (400 ng).
For RNA overexpression, 1 × 10⁵ cells/well were plated on 24-well plates in 200 μl of serum-free medium and treated as follows: 1) no treatment (−DMSO); 2) 2% DMSO (+DMSO); 3) control RNA (500 ng); 4) ADNP RNA (500 ng); 5) ADNP2 RNA (500 ng); and 6) ADNP + ADNP2 RNA (250 ng each).
4 h after transfection, 500 μl of standard growth medium was added to each well. DMSO was added to all treatment groups in the rescue experiment and to the +DMSO group in the RNA overexpression experiment. 3 days later, RNA was extracted, and mRNA levels of ADNP, ADNP2, band3, and β-globin were evaluated. RNA extraction and quantitative real time PCR were performed as described previously (supplemental material) (15). Primers (supplemental Table S2) were synthesized by Sigma Genosys.
Immunoprecipitation
For ADNP2 and Brg1 co-immunoprecipitation assays, human embryonic kidney cells (HEK293) were transfected with a pEGFP-C3 (Clontech) expression vector carrying the full-length mouse ADNP2 coding sequence or with a control pEGFP plasmid. 24 h later, GFP expression was visualized by fluorescent microscopy, and total protein was extracted. 25 μl of anti-GFP covalently conjugated to agarose beads (MBL International, Woburn, MA) were added to 1.5–2 mg of HEK293 protein extract followed by immunoprecipitation (4). Proteins were then separated by SDS-PAGE and incubated with horseradish peroxidase (HRP)-conjugated anti-GFP antibody (1:1000, Hypromatrix, Worcester, MA) and with rabbit anti-Brg1 antibody (1:5000, Sigma). Protein extraction and Western blot analysis are described in the supplemental material.
Chromatin Immunoprecipitation (ChIP)
ChIP was performed as described previously (3). Although nonquantitative, DNA concentration was measured following sonication, and an equal amount of material was taken for the ChIP procedure. Briefly, MEL cells were exposed to cross-linking with 1% formaldehyde (10 min at room temperature), followed by quenching (125 mm glycine for 5 min), resuspended in lysis buffer, and sonicated to an average DNA length of 100–1000 bp. 25 μg of supernatant DNAs was diluted in 0.01% SDS, 1.1% Triton X-100, 1.2 mm EDTA, 16.7 mm Tris-HCl, pH 8.1, 167 mm NaCl with protease inhibitors. Pre-cleared samples (with protein A/G beads (Santa Cruz Biotechnology) previously blocked with single-stranded herring sperm DNA (MP Biomedicals, OH)) were subjected to 16 h of immunoprecipitation with 10 μg of goat anti-ADNP (R&D Systems, Minneapolis, MN), 10 μg of rabbit anti-Brg1 (Sigma) or without antibody as negative control. Immunocomplexes were adsorbed onto 30 μl of blocked protein A/G beads for 16 h. The beads were sequentially washed with low salt wash buffer (0.1% SDS, 1% Triton X-100, 2 mm EDTA, 20 mm Tris-HCl, pH 8.1, and 150 mm NaCl), high salt wash buffer (same as above, with 500 mm NaCl), and lithium chloride buffer (250 mm LiCl, 1 mm EDTA, 1% Nonidet P-40, 1% deoxycholic acid, and 10 mm Tris-HCl, pH 8.1). Precipitates were washed with TE buffer, and antibody-bound chromatin fragments were eluted from the beads (1% SDS in 100 mm NaHCO3). Cross-linking was reversed, and DNA was recovered using phenol chloroform DNA precipitation. ChIP DNA was amplified by PCR with the following primers: sense 5′-TGTAAGTGTAAATTTTGGAGCACAGG-3′ and antisense 5′-CTGAAAGACTAAAGTTCCCGGC-3′. The amplification product (481 bp) was located within the DNase I-hypersensitive site3 (HS3) of the mouse β-globin LCR (16). The second amplification product was HS2F, located within the DNase I-hypersensitive site2 (HS2; 450 bp) of the mouse β-globin LCR 5′-AGTGTCAGCATATTACCGATGTTCC-3 and HS2R 5′-CACACAGCAAGGCAGGGTC-3. Samples were analyzed by agarose gel electrophoresis and ethidium bromide staining.
Statistical Analyses
Student's t tests for comparisons of two variables and analysis of variance for comparisons of multiple variables with the appropriate post hoc analyses were used as indicated in the figure legends.
RESULTS
Silencing of Zebrafish adnp1 and adnp2 Results in Defective Hematopoiesis
Blast search for human ADNP (NP_056154) and ADNP2 (NP_055728) orthologues in zebrafish revealed two zebrafish orthologues for each mammalian gene. adnp1a and adnp1b are the two mammalian ADNP orthologues, whereas adnp2a and adnp2b are the two mammalian ADNP2 orthologues. High conservation levels were found between zebrafish, human, and mouse orthologues, especially along the functional domains. Expression profile analyses indicated that all four zebrafish genes are expressed during zebrafish embryogenesis (supplemental Fig. S3).
The functional role of zebrafish adnp1 and adnp2 during embryonic development was assessed by MO knockdown experiments. After injection, the phenotype of live embryos and larvae was monitored daily for 10 days. Standard control MO injection did not cause any visible morphological abnormalities. Knocking down adnp1a and adnp1b (by adnp1a-sp1MO and adnp1b-tMO, respectively) produced a similar phenotype; starting from 28 hpf, when blood circulation had already begun, knockdown embryos had fewer blood cells in circulation than control MO embryos. At 72 hpf, the blood of adnp1a-sp1MO- and adnp1b-tMO-injected embryos was hypochromic compared with the red blood in control embryos (Fig. 1A). o-Dianisidine staining at 48 and 72 hpf showed significant reduction in hemoglobin content (Fig. 1, B and E). Cardiac edema was visible in some embryos. Regarding morphology, adnp1 knockdown embryos suffered from developmental delay (supplemental Fig. S4) and distorted tail morphology and had much smaller head and eyes than control embryos (Fig. 1C, smaller head and eyes were observed in 73% of embryos, n = 171 for adnp1a-sp1MO, and 92% of embryos, n = 276 for adnp1b-tMO compared with 0% of embryos, n = 115 for control MO). Silencing of adnp2b was achieved with both tMO (adnp2b-tMO) and spMO (adnp2b-spMO), generating similar results regarding blood (Fig. 1, A, B and E), although no developmental delay or major morphological changes were noted. The efficiency of adnp1a-sp1MO and adnp2b-spMO was evaluated by RT-PCR (supplemental Fig. S1). Knockdown of adnp2a using adnp2a-tMO had no effect on the overall morphology; however, it exhibited the most dramatic effect on hematopoiesis. At the onset of blood circulation (∼24 hpf), blood cells were visible; however, between 33 and 48 hpf, no blood cells were evident, and the embryos developed noticeable cardiac edema (Fig. 1, A and D; supplemental Movies 1–3). Staining for hemoglobin was totally negative (Fig. 1, B, E, and F). High magnification light microscopy revealed isolated blood cells moving occasionally across the vessels (supplemental Movies 4–6). It is worthwhile mentioning that some adnp2a-tMO-injected embryos recovered blood circulation at day 4 (ranging from 20% in some experiments to 70% in others), indicating normal onset of definitive hematopoiesis or dilution and/or degradation of MO due to ongoing cell divisions. However, most of zebrafish adnp1 and adnp2 MO-injected embryos did not resume blood circulation. Moreover, they became severely edematous at day 4–5 (Fig. 1G), and no blood cells were visible in their vessels, and death occurred toward the end of the 1st week.
FIGURE 1.

Silencing of zebrafish adnp1 and adnp2 causes impaired hematopoiesis. A, MOs were injected into zebrafish embryos, and blood phenotypes were examined. B, assessment of hemoglobin content by o-dianisidine staining at 48 and 72 hpf (n ≥15 embryos/staining). C, 48 hpf control MO injected (top), adnp1a-sp1MO injected (middle), and adnp1b-tMO injected (bottom) embryos. Head and eyes of adnp1a-sp1MO and adnp1b-tMO injected embryos are smaller than those of control MO embryo. Red blood is visible in the heart of control MO embryo and not in adnp1a-sp1MO or adnp1b-tMO injected embryos. D, 72 hpf wild-type embryo (top) and adnp2a-tMO injected embryo (bottom). Red blood is visible in the heart of wild-type embryo but not in adnp2a-tMO injected embryo (arrows). Cardiac edema is notable in adnp2a-tMO injected embryo. E, 48 hpf o-dianisidine assay, showing reduced staining in adnp1a-sp1MO, adnp1b-tMO, adnp2b-tMO, and adnp2b-spMO injected embryos compared with control embryo. No staining is visible in adnp2a-tMO injected embryo. Embryos are at lateral views, anterior to the top. F, 48 hpf o-dianisidine staining of wild-type embryos versus adnp2a-tMO injected embryos. G, wild-type and adnp2a-tMO injected embryos at 8 dpf. Knockdown embryos suffer from significant edema.
Silencing of adnp1 and adnp2 Results in Impaired Maturation of the Erythroid Lineage during Zebrafish Primitive Hematopoiesis
As the most dramatic effect on blood formation was achieved by knocking down adnp2a, it was used for further phenotypic characterization. Vertebrate hematopoiesis occurs in two successive waves, “primitive” and “definitive” (17). Stem cells of both waves are specified from the mesoderm layer. The primitive wave of hematopoiesis produces predominantly erythroid cells that begin to circulate at 24–26 hpf. The intermediate cell mass (ICM), located in the trunk, ventral to the notochord, is the site of primitive zebrafish erythropoiesis and is analogous to the extra-embryonic yolk sac of mammals (8, 18). The definitive wave of hematopoiesis initiates by ∼30–36 hpf in the ventral wall of the dorsal aorta, which is equivalent to the aorta-gonad-mesonephros in mammals. Definitive hematopoietic progenitors give rise to all hematopoietic cell lineages during the life span of the animal (8, 18). Here, the defects we observed in hematopoiesis occurred early during development, corresponding to the primitive wave (19). To identify the exact stage in which primitive hematopoiesis was blocked, we examined the expression of several markers characteristic of specific stages during this process (20). lmo2 and scl are early hematopoietic stem cells markers, first expressed in zebrafish from the 1 to 3 somite stage (10 and 11 hpf) (8). At 17–19 hpf, the expression of scl and lmo2 was intact in the ICM of adnp2a-tMO injected embryos (100% of embryos, n = 35 for scl and n = 38 for lmo2), indicating normal specification of the mesoderm layer to the hematopoietic lineage (Fig. 2, A and B). Zebrafish, unlike mammals, undergo robust myelopoiesis during primitive hematopoiesis (8). Thus, the expression of two terminal myeloid markers was evaluated as follows: lys-C, which marks granulocytes (21), and l-plastin, which marks macrophages (22). At 28 hpf, expression of lys-C and l-plastin was intact in adnp2a-tMO-injected embryos (100% of embryos, n = 35 for lys-C and n = 30 for l-plastin), meaning intact myeloid differentiation (Fig. 2, C and D). We next examined the development of the erythroid lineage. Surprisingly, expression of the erythroid marker gata1 (8) appeared normal in the ICM of 17–19 hpf adnp2a-tMO-injected embryos (Fig. 2E, 100% of embryos, n = 34) indicating that early commitment to the erythroid lineage was also normal. Although expression of gata1 demonstrated intact early erythroid development, the erythroid progenitors did not appear to develop into hemoglobinized erythrocytes, as shown by the lack of circulating blood cells and hemoglobin staining in older embryos from the same experiment. At 28 and 48 hpf, expression of band3, a marker of mature erythrocytes (23), was almost absent in adnp2a-tMO injected embryos compared with control embryos (Fig. 2, F and G, 83% of embryos, n = 23 for 28 hpf versus 0% of embryos, n = 18 for control MO and 97% of embryos, n = 30 for 48 hpf versus 7% of embryos, n = 27 for control MO). In addition, gata1 expression, which was intact at 17–19 hpf, was dramatically reduced in knockdown embryos at 28 hpf (Fig. 2H, 90% of embryos, n = 21 versus 0% of embryos, n = 26 for control MO). Expression of embryonic α-globin1, an additional erythrocyte marker (24), was also significantly reduced at 28 hpf adnp2a-knockdown embryos (Fig. 2I, 96% of embryos, n = 24 versus 0% of embryos, n = 23 for control MO). At 4 days post-fertilization (dpf), gata1 and band3 were almost absent in control embryos, representing erythroid cell maturation (25), although in adnp2a-tMO-injected embryos, ectopic expression of gata1 and band3 was visible along the tail and yolk sinus (Fig. 2, J and K, 86% of embryos, n = 21 versus 0% of control MO, n = 17 for gata1 and 100% of embryos, n = 15 versus 0% of control MO, n = 15 for band3). These observations suggest blocked erythroid maturation as a result of adnp2a suppression. Regarding definitive hematopoiesis and vasculogenesis, preliminary WMISH indicated no involvement of adnp2a in the definitive wave (although MO dilution effect cannot be ruled out, see above) and a possible effect on vasculogenesis (supplemental Fig. S5).
FIGURE 2.

Characterization of the hematopoietic defect in adnp2a-tMO injected embryos by WMISH. A and B, normal specification of the mesoderm layer into the hematopoietic lineage. C and D, normal myeloid differentiation. E, normal early erythroid development, in the presence of adnp2a-tMO. F–K, impaired maturation and differentiation of the erythroid lineage. A–K present lateral views with anterior to the bottom (A, B, and E) or to the right (C, D, and F–K). A, B, and E are 17–19 hpf embryos. C, D, F, H, and I are 28-hpf embryos. G is 48-hpf embryos. J and K are 4-dpf embryos. n ≥15 embryos/staining. It should be noted that the adnp2a MO used is a translation-blocking MO. Under these conditions, RNA is not affected, and protein levels are reduced. Unfortunately, an antibody for zebrafish ADNP2 is unavailable, and therefore, it is not possible to monitor changes at the protein level.
The expression of scl at 17–19 hpf and of lys-C, gata1, band3, and α-globin 1 at 28 hpf was also evaluated for adnp1a-sp1MO, adnp1b-tMO, adnp2b-tMO, and adnp2b-spMO. Results were similar to those obtained with adnp2a-tMO, although less robust (supplemental Fig. S6).
Expression of ADNP or ADNP2 Is Required for Proper Erythroid Differentiation in MEL Cells
To test whether the role of ADNP and ADNP2 in zebrafish erythroid maturation is conserved in mammals, we used the MEL model, an established in vitro model for erythroid differentiation. MEL cells are Friend virus-transformed erythroid precursors blocked at an early stage in the pathway of differentiation. To induce differentiation, cells were treated with 2% DMSO for 3 days (26, 27) resulting in red cell pellets representing hemoglobin production versus white pellets of nondifferentiated cells (Fig. 3A). To ascertain effective erythroid differentiation following DMSO treatment, two parameters were evaluated as follows: mRNA expression of specific erythroid markers and growth rate. As expected, the expression level of the erythroid markers β-globin and band3 (28) was dramatically increased by ∼40- and 140-fold, respectively, in the DMSO-treated cells. The expression of c-kit, marker of hematopoietic stem cells representing undifferentiated cells (29), was 200 times lower in the DMSO-treated cells compared with nondifferentiated cells (Fig. 3B). Growth rate of differentiating cells showed a significant reduction compared with nondifferentiated cells (Fig. 3C), corresponding to the growth arrest accompanying cell differentiation processes. We next evaluated ADNP and ADNP2 expression during DMSO-induced MEL cell differentiation, demonstrating no change in ADNP/ADNP2 mRNA levels between differentiated and nondifferentiated cells. Interestingly, when the same experiment was repeated with reduced serum concentration, ADNP and ADNP2 levels were up-regulated by 2-fold in the DMSO-treated cells (supplemental Fig. S7).
FIGURE 3.

ADNP and ADNP2 are required for mouse erythroid differentiation. A–C, MEL cells were differentiated with 2% DMSO for 3 days and compared with nondifferentiated (ND) cells incubated for the same time period. Results are means ± S.E. analyzed by Student's t test (*, p < 0.05; **, p < 0.01; ***, p < 0.001). A depicts the red pellet (hemoglobin) of differentiated (D) cells compared with the white pellet of ND cells. B, RNA transcript levels of β-globin, band3, and c-kit in differentiated versus ND MEL cells. Four experiments were performed, each in duplicate. Data are presented in logarithmic scale as fold-change from the expression level in the ND state. C, growth curves of differentiated versus ND MEL cells. Results are % of the number of cells at plating (100%). Experiments were repeated three times. D--I, MEL cells were transfected with ADNP/ADNP2 shRNA/siRNA, respectively, or with nonspecific shRNA/siRNA sequences (control), and subjected to 3 days of differentiation with DMSO. Results, means ± S.E., were analyzed using Student's t test (*, p < 0.05; **, p < 0.01; ***, p < 0.001, relative to control). D and E, RNA expression levels of ADNP, ADNP2, β-globin, band3, and c-kit. 4–5 experiments were performed, each in triplicate. F, validation of ADNP knockdown at the protein level by Western analysis. Experiment was performed four times, each in duplicate. One representative blot is shown. G, graphic depiction of the densitometric analysis of ADNP protein expression, showing ∼40% reduction in knockdown cells compared with control cells. H and I, MEL cells were transfected with ADNP/ADNP2 shRNA/siRNA, respectively, and viable cells were counted daily for a 3-day differentiation process. Two separate experiments were performed in triplicate for every time point. Results are presented as % from the number of cells at plating (100%).
To test the effect of ADNP and ADNP2 silencing on differentiation, MEL cells were transfected with two different ADNP shRNA plasmids (sh68/sh71) or with ADNP2 siRNA prior to addition of DMSO. The efficiency of silencing after 3 days of DMSO treatment was evaluated at the RNA level (Fig. 3, D and E, 40–50% silencing for ADNP and 55% for ADNP2) and protein level (Fig. 3, F and G). Gene expression analysis indicated that ADNP silencing resulted in 30–55% reduction in β-globin mRNA expression, 40–50% reduction in band3, and ∼250% increase in c-kit expression compared with control cells treated with nonspecific shRNA plasmid (Fig. 3D). Similarly, ADNP2 knockdown reduced β-globin expression by 45% and band3 by 40% and increased c-kit expression by ∼250%, compared with control cells treated with scrambled ADNP2 siRNA (Fig. 3E). Cells treated with ADNP2 siRNA were 2-fold more proliferative than control cells at the 3rd experimental day (Fig. 3I), indicating that the balance between differentiation and proliferation was in favor of proliferation in the ADNP2 siRNA-treated cells. In contrast, ADNP silencing did not affect cell proliferation (Fig. 3H), although it down-regulated β-globin and band3.
Specificity of RNA interference was ascertained in one experiment in MEL cells with ADNP2 siRNA showing a 54% reduction in ADNP2 (p < 0.001) and an insignificant 16% reduction in ADNP (p = 0.08). Similar results were obtained in other systems (supplemental Fig. S8). These observations essentially preclude mistargeting of the corresponding paralogue RNA as a cause for the similar ADNP and ADNP2 knockdown phenotypes and indicate that ADNP and ADNP2, each separately and independently, affected erythroid differentiation.
Exogenous ADNP/ADNP2 RNAs Rescue Impaired Erythroid Differentiation Caused by ADNP/ADNP2 Silencing and Induce MEL Cell Differentiation in the Absence of DMSO
To prove that the failure of MEL cells to differentiate was specific to ADNP or ADNP2 silencing, rescue experiments were performed using RNA encoding mouse ADNP/ADNP2. Although addition of control Xenopus RNA did not affect ADNP or ADNP2 expression levels in DMSO-differentiated ADNP- or ADNP2-silenced cells, addition of ADNP or ADNP2 RNA resulted in a 10,000 or 1000 times increase in the respective transcripts (Fig. 4, A and B). 2-Fold increase in the ADNP protein signal was observed in cells transfected with ADNP RNA versus cells transfected with control RNA (Fig. 4, C and D), demonstrating efficient translation of exogenous RNA. Furthermore, although addition of control Xenopus RNA had no significant effect on β-globin or band3 levels in the DMSO-treated ADNP/ADNP2-silenced cells, addition of RNA encoding ADNP or ADNP2 completely rescued β-globin levels to control levels. The band3 levels were slightly increased as a result of the expression of ADNP/ADNP2 RNA, but this trend was insignificant (Fig. 4, E and F).
FIGURE 4.

Exogenous ADNP/ADNP2 RNA rescue MEL cell-impaired erythroid differentiation caused by ADNP/ADNP2 silencing and induce differentiation in the absence of DMSO. A–F, MEL cells were transfected with ADNP/ADNP2 shRNA/siRNA alone or together with murine ADNP/ADNP2 RNA and subjected to a 3-day differentiation with DMSO. For each panel, results are means ± S.E. Statistical analysis included one-way analysis of variance with post hoc least significant difference (LSD) (A and B and E and F) or Student's t test (C and D) (*, p < 0.05; **, p < 0.01; ***, p < 0.001, relative to ADNP/ADNP2 shRNA/siRNA plus control RNA samples). A and B, transfection efficacy of exogenous ADNP (A) or ADNP2 (B) RNA was evaluated by measuring ADNP/ADNP2 mRNA levels. Five independent experiments were performed, each in triplicate. Results are presented in logarithmic scale as fold-change from the expression level in control cells (treated with nonspecific shRNA/siRNA sequences). C, MEL cells were transfected with ADNP shRNA (sh68) plus control nonspecific RNA or with sh68 plus ADNP RNA followed by a 3-day DMSO differentiation. Western analysis confirmed translation of exogenous ADNP RNA. Experiment was repeated three times, each in duplicate. One representative blot is shown. D, graphic depiction of the densitometric analysis of ADNP protein expression using α-tubulin as a normalizing protein. E and F, rescue of MEL cell undifferentiated state by exogenous ADNP/ADNP2 RNA as shown by mRNA expression analyses of β-globin and band3. Five different experiments were performed, each in triplicate. Results are presented as % from control levels. G and H, to assess whether exogenous ADNP/ADNP2 RNA may induce erythroid differentiation, MEL cells were transfected with murine ADNP/ADNP2 RNA and incubated for 3 days without DMSO. For each panel, results are means ± S.E. Statistical analysis included one-way analysis of variance with post hoc Tukey honest significant difference (including five groups as follows: −DMSO, control RNA (conRNA), ADNP RNA, ADNP2 RNA, and ADNP + ADNP2 RNA) (G) or Student's t test (I) (*, p < 0.05; **, p < 0.01; ***, p < 0.001, relative to control RNA-treated cells). G, differentiation was evaluated by measuring the mRNA levels of β-globin. The experiment was repeated three times, each in triplicate. Results are presented in logarithmic scale as fold-change from the expression level in control RNA cells. H depicts the darker pellet (hemoglobin) of ADNP RNA-transfected cells compared with control RNA-transfected cells. I, benzidine assay was performed to evaluate the number of hemoglobin-positive cells. Each treatment was performed in duplicate. 7–8 fields were photographed for each treatment, and the number of stained cells was counted (∼1000 cells/treatment). Results are presented as percentage from the total number of cells counted.
To examine the role of ADNP and ADNP2 as inducers of erythroid differentiation, MEL cells were transfected with ADNP/ADNP2 RNA or control RNA, in the absence of DMSO. 3-days later, the expression levels of β-globin were examined and compared with undifferentiated cells and with DMSO-treated cells. Results demonstrated that exogenous addition of ADNP or ADNP2 RNA and the combination of both up-regulated β-globin expression levels compared with control RNA-treated cells by ∼1.6-fold (Fig. 4G). The color of the pellet of ADNP RNA-treated cells appeared darker than that of control RNA-treated cells, reflecting higher levels of hemoglobin (Fig. 4H), and benzidine staining demonstrated a 1.8-fold increase in the number of stained cells in ADNP RNA samples compared with control (Fig. 4I). Importantly, DMSO treatment showed the highest differentiation efficacy with ∼18-fold increase in the β-globin transcript compared with control RNA and 72% of benzidine-stained cells (data not shown) compared with 5.2% for ADNP RNA (Fig. 4, G and I). Regardless, in both cases this was significantly higher than control RNA values.
Brg1, Member of the SWI/SNF Chromatin-remodeling Complex, Interacts with ADNP2
Brg1 is involved in the hematopoietic process through regulation of the β-globin locus (30, 31). As we have previously shown that Brg1 interacts with ADNP (4), we opted to explore the possibility that it also binds to ADNP2. For this purpose, protein extract from GFP-ADNP2/control GFP-transfected HEK293 cells was used for immunoprecipitation using GFP antibodies, followed by gel electrophoresis and Western analysis. Results showed co-immunoprecipitation of GFP-ADNP2 with Brg1 (Fig. 5). Interestingly, Brg1 mRNA levels increased upon MEL cell differentiation and were influenced by ADNP and ADNP2 silencing (supplemental Fig. S9).
FIGURE 5.
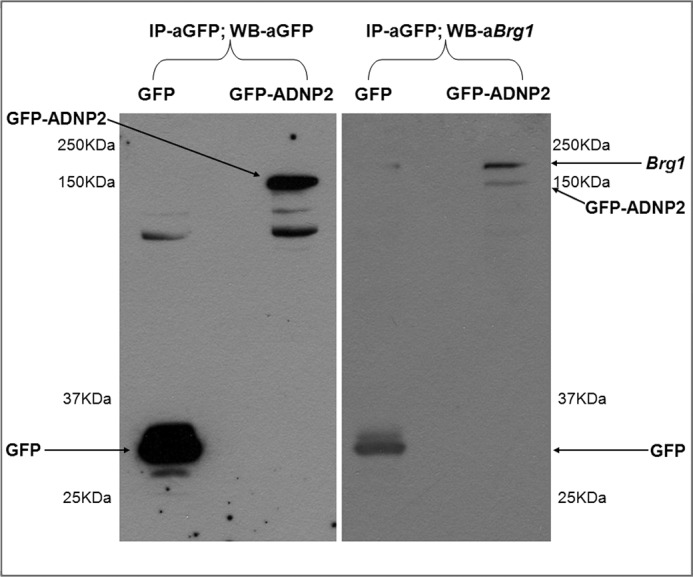
Brg1, a member of the SWI/SNF chromatin-remodeling complex, interacts with ADNP2. Protein extract from GFP-ADNP2/control-GFP transfected HEK293 cells was used for immunoprecipitation (IP) using agarose bead-conjugated anti-GFP antibodies. Results show that both GFP-ADNP2 and control GFP were precipitated with antibodies against GFP (left membrane). Brg1 co-immunoprecipitation with ADNP2 was evaluated using Western analysis on the same immunoprecipitation results showing enrichment with GFP-ADNP2 immunoprecipitation compared with GFP immunoprecipitation (right membrane). Please note that the same blot was used for reacting with GFP antibodies and Brg1 with no stripping in-between. The experiment was repeated twice, and representative blots are shown.
ADNP Is Recruited to the Mouse β-globin Locus Control Region
ChIP assays revealed an association between ADNP to the mouse β-globin LCR in differentiated and nondifferentiated MEL cells. Specifically, ADNP showed interaction with both HS2 and HS3 and not with the β-globin coding region. Recruitment of Brg1 to the β-globin LCR was also seen, in agreement with previous studies (30). Differentiated cells showed diminished ADNP binding to the β-globin locus on the 3rd day after DMSO treatment compared with control nondifferentiated cells, in a similar manner to what was shown for Brg1 (Fig. 6) (32).
FIGURE 6.

ADNP is recruited to the mouse β-globin locus. ChIP was performed using ADNP and Brg1 antibodies in DMSO-differentiated and nondifferentiated cells, followed by PCR amplification of the HS2 site within the β-globin LCR (A), as well as the HS3 site within the β-globin LCR (B), and β-globin coding region as in Fig. 3 (PCR product, 100 bp) (C). Lanes 1 and 9, positive (Pos) control, sonicated DNA not subjected to ChIP. Lanes 2, 3, 10, and 11, negative (Neg) control, sonicated DNA immunoprecipitated without antibody. Lanes 4, 5, 12, and 13, sonicated DNA immunoprecipitated with ADNP antibody. Lanes 6, 7, 14, and 15, sonicated DNA immunoprecipitated with Brg1 antibody. Lane 8, water. m = DNA molecular weight marker. Each panel (A–C) is representative of two identical experiments, and each was repeated in duplicate.
DISCUSSION
This study reveals for the first time, to our knowledge, a crucial role for ADNP and ADNP2, each separately, in globin synthesis and erythropoiesis in two model systems, the zebrafish and the murine erythroleukemia cell.
We found that zebrafish adnp1 and adnp2 are ubiquitously expressed during the first 3 days of development, a time period that is associated with rapid embryogenesis and organogenesis (supplemental Fig. S3) (33). By using MOs knockdown approach, we demonstrated that all four zebrafish adnp1 and adnp2 genes are required for primitive erythropoiesis. Maturation and differentiation of the erythroid lineage were the main defect caused by adnp1/adnp2 silencing, resulting in a reduced number of circulating cells and blocked hemoglobin synthesis. Mesodermal specification to the hematopoietic lineage, myeloid differentiation, and early erythroid development were not affected by adnp1/adnp2 silencing. Definitive hematopoiesis markers appeared normal in adnp2a knockdown embryos and part of the embryos resumed blood circulation at 4 dpf. As the “bloodless” mutant (which has a restricted defect in the primitive wave but not in the definitive wave of hematopoiesis) resumed its blood circulation at ∼5 dpf (19), our results might indicate an undamaged definitive wave. However, because not all adnp2a knockdown embryos and almost none of adnp1a, adnp1b, and adnp2b knockdown embryos resumed blood circulation, further experiments were required to draw firm conclusions regarding the definitive wave, also taking into consideration the dilution effect of the silencing MOs. In this context, MEL cell terminal differentiation closely resembles definitive erythropoiesis, because it results in the expression of adult-type globin genes (34), and in these cells, ADNP and ADNP2 regulated globin expression.
The lack of circulating blood cells in adnp1 and adnp2 knockdown zebrafish embryos is suggested to result from delayed maturation, as implied by the ectopic expression of band3 and gata1 in 4 dpf knockdown embryos. This ectopic expression could result from deregulation associated with MO dilution, allowing the expression of band3 and gata1 at 4 dpf. Interestingly, in the zebrafish sauternes mutant, deficient in heme biosynthesis, similar ectopic patterns of gata1 and βe2-globin were observed at 72 hpf embryos (25). Furthermore, in fgf1 knockdown embryos, persistent expression of gata1 and ikaros was maintained in the ICM and in circulating cells at 32–40 hpf, whereas in control embryos expression was slowly diminished after 30 hpf, and in these embryos fgf1 was essential for normal erythropoiesis (35).
In MEL cells, silencing of ADNP and ADNP2 resulted in defective erythroid differentiation, characterized by down-regulation of the erythroid markers β-globin and band3 and up-regulation of the hematopoietic stem cell marker, c-kit, corroborating our observation in the zebrafish. Expression of exogenous RNA encoding ADNP or ADNP2 rescued the undifferentiated phenotype of MEL cells by up-regulating β-globin back to control levels. However, the effect on band3 was less robust. Interestingly, band3 is regulated by gata1 (36), and gata1 interacts with Brg1 (37), which is essential for globin expression (31). It is possible that direct versus indirect targets exist for ADNP and ADNP2, with band3 being an indirect target, thus longer time is needed for its expression to recover.
The increase in ADNP/ADNP2 mRNA was much more pronounced than the increase observed at the protein level potentially reflecting differences in efficacy of translation versus transcription (38). When culturing the cells in the absence of DMSO, exogenous ADNP and ADNP2 RNA as well as a combination of both resulted in increased β-globin expression as well as increased hemoglobin production, implicating the ADNP protein family in the molecular signaling is necessary for the induction of differentiation.
Primitive erythropoiesis in the mouse is first observed at E7.5 in blood islands of the yolk sac. These primitive cells are the exclusive red cells in the embryo until the newly formed fetal liver releases the first definitive red cells into the circulation at E12 (18). Therefore, anemia observed in the fetus before E13 is due to a loss or decreased synthesis of primitive erythroid cells (18). As our previous analysis conducted on the ADNP knock-out mice concentrated on the embryos and avoided the yolk sacs, globin was not detected as a major down-regulated gene among the >400 regulated genes (3). However, ADNP knock-out mouse embryos die between E8.5 and E9.5 (5), a time period corresponding to primitive hematopoiesis, which was also impaired in the zebrafish embryos. Importantly, fgf1, lhx2, hipk2, flt1, and klf2 that were down-regulated in the ADNP knock-out mice (3) were shown to be required for proper hematopoiesis (5, 35, 39–43). Interestingly, ADNP insufficiency did not result in reduced hemoglobin levels in the mouse, suggesting complex compensatory mechanisms or involvement only in the definitive erythropoiesis (supplemental Fig. S10 shows embryonic yolk sac, β-globin mRNA, and adult hemoglobin levels).
Although ADNP knock-out mice died at early developmental stages (5), ADNP heterozygous mice survived to adulthood (44). Here, the knockdown zebrafish embryos survived their 1st week of life. It should be taken into consideration that higher redundancy exists in the zebrafish (four adnp genes in the zebrafish compared with two in the mouse) and that in the mouse ADNP knock-out was complete, although in zebrafish ADNP was knocked down. Additionally, previous studies demonstrated that completely anemic zebrafish mutants are viable for at least 2 weeks post-fertilization, suggesting that blood cell-mediated oxygen transport is not critical until relatively late stages of larval development (45).
Previously, we have demonstrated that ADNP interacts with Brg1, a member of the SWI/SNF chromatin-remodeling complex (4), that coordinates the disruption of nucleosomes to permit the binding of various transcription factors, an activity crucial for achieving the correct spatiotemporal gene expression during embryonic development (46). Previous studies have demonstrated that Brg1 is involved in hematopoietic regulation during both primitive and definitive erythropoiesis, mediating chromatin-remodeling of the β-globin locus and required for transcription of both embryonic and adult globins (30, 31). Here, we have extended our previous data showing interaction between ADNP and Brg1 (4) to include ADNP2 and Brg1 binding. Moreover, our ChIP assay demonstrated an association between ADNP and the β-globin LCR and further confirmed Brg1 recruitment of to the β-globin locus as was shown previously (30). Interestingly, Brg1 occupancy at the β-globin locus as well as at the β-globin and P4.2 (an erythrocyte membrane protein) promoters decreased with terminal erythroid differentiation (32, 47). The same phenomenon was observed here for ADNP showing diminished β-globin LCR occupancy in DMSO-differentiated cells compared with nondifferentiated cells, initiating differentiation. Importantly, Brg1 is recruited to the β-globin locus by selective association with zinc finger transcription factors such as EKLF and gata1 (37, 48). Although we now provide direct evidence linking ADNP and the β-globin locus, we cannot rule out that this interaction is mediated through Brg1 recruitment to the β-globin locus in a similar manner to other zinc finger transcription factors. Regardless, the novel findings of ADNP recruitment to the β-globin locus and direct ADNP/ADNP2 RNA induction of globin expression reinforce our argument that the ADNP protein family participates in erythropoiesis and globin regulation.
ADNP and ADNP2 are homologous proteins, but their exact inter-relationship remains to be further elucidated. In zebrafish hematopoiesis, there was high resemblance between the phenotype of adnp1 and adnp2 knockdown embryos, yet it was not exactly the same, and several functional differences were observed. Thus, knockdown of adnp2a caused complete lack of blood and hemoglobin synthesis, although knockdown of the three other genes resulted in less severe phenotypes. More efficient gene knockdown achieved by adnp2a-MO might account for the increased phenotype severity. Alternatively, redundancy between the four zebrafish adnp1 and adnp2 genes may exist, with the adnp2a gene being less replaceable by the other orthologues. We have previously shown that ADNP is necessary for neurogenesis (3, 4) and brain development (5). Here, we observed smaller head and eyes in adnp1 MO-injected embryos, and our preliminary data suggest a developmental delay in these embryos, exhibiting a postponed expression pattern of the central nervous system marker irx7. Importantly, these changes were observed only with adnp1 suppression but not with adnp2. Finally, in MEL cells, either ADNP or ADNP2, each separately, were required for proper differentiation and for up-regulation of specific erythroid markers, but only ADNP2 affected cell growth during differentiation. Thus, ADNP and ADNP2 may have similar roles in some aspects but may have different regulatory effect on target genes, resulting in different functional outcomes.
Taken together, we revealed a novel striking role for the ADNP gene family in erythropoiesis. In zebrafish, adnp1 and adnp2 were not required for hematopoietic stem cell specification, myeloid differentiation, or early erythroid development. Instead, they were required for progression through the later stages of erythroid differentiation. Similar results were observed in the mammalian model system, suggesting that this role is probably an ancestral function common to all vertebrate ADNP and ADNP2 genes. Given the newly discovered direct interaction of ADNP and ADNP2 with Brg1, the direct association of ADNP with the β-globin LCR and the induction of β-globin expression in MEL cells by either ADNP or ADNP2 RNA, we suggest a novel role for the ADNP gene family in vertebrate erythropoiesis. This study adds another dimension to our appreciation of the complexity in regulating embryogenesis in general and erythropoiesis in particular, by the ADNP protein family, leading to further understanding of proper hematopoiesis and providing tools for future studies on defects in crucial hematopoietic processes and embryogenesis.
Supplementary Material
Acknowledgments
We thank Dr. Ori Palevitch for help with the MO injections and Dr. Niva Russek-Blum for help with the WMISH. We are grateful to Dr. Eliezer Giladi for the maintenance and help with the ADNP-deficient mouse colony. We acknowledge Prof. Shai Izraeli and the Allon Therapeutic science team for critical reading of the manuscript. Finally, we thank Yehiel Dresner for help with the artwork.
This work was supported by a stem cell scholarship, the Lily and Avraham Gildor Chair for the Investigation of Growth Factors, the Elton Laboratory for Molecular Neuroendocrinology, the Adams Super Center for Brain Studies at Tel Aviv University, the AMN Foundation, Israel, Montreal Circle of Canadian Friends of Tel Aviv University, Joseph and Grace Alter, Barbara and Donald Seal, the Oberfeld Family, the Adams Family, Australian Friends of Tel Aviv University, and Eva Selwyn and Allon Therapeutics Inc., Vancouver, Canada. I. G. serves as a Director-Founding Scientist of Allon Therapeutics Inc. that funded, in part, the described research. A patent has been applied for ADNP-like influence in anemia.

- ADNP
- activity-dependent neuroprotective protein
- ADNP2
- activity-dependent neuroprotective protein 2
- MEL
- mouse erythroleukemia
- LCR
- locus control region
- SWI/SNF
- mating type switching/sucrose nonfermenting
- E
- embryonic day
- hpf
- hour post-fertilization
- WMISH
- whole-mount in situ hybridization
- MO
- morpholino oligonucleotide
- HEK293
- human embryonic kidney 293
- HS3
- DNase I-hypersensitive site3
- ICM
- intermediate cell mass
- dpf
- day post-fertilization
- ND
- nondifferentiated
- spMO
- splicing blocking morpholino oligonucleotide
- tMO
- translation blocking morpholino oligonucleotide.
REFERENCES
- 1. Bassan M., Zamostiano R., Davidson A., Pinhasov A., Giladi E., Perl O., Bassan H., Blat C., Gibney G., Glazner G., Brenneman D. E., Gozes I. (1999) Complete sequence of a novel protein containing a femtomolar activity-dependent neuroprotective peptide. J. Neurochem. 72, 1283–1293 [DOI] [PubMed] [Google Scholar]
- 2. Zamostiano R., Pinhasov A., Gelber E., Steingart R. A., Seroussi E., Giladi E., Bassan M., Wollman Y., Eyre H. J., Mulley J. C., Brenneman D. E., Gozes I. (2001) Cloning and characterization of the human activity-dependent neuroprotective protein. J. Biol. Chem. 276, 708–714 [DOI] [PubMed] [Google Scholar]
- 3. Mandel S., Rechavi G., Gozes I. (2007) Activity-dependent neuroprotective protein (ADNP) differentially interacts with chromatin to regulate genes essential for embryogenesis. Dev. Biol. 303, 814–824 [DOI] [PubMed] [Google Scholar]
- 4. Mandel S., Gozes I. (2007) Activity-dependent neuroprotective protein constitutes a novel element in the SWI/SNF chromatin remodeling complex. J. Biol. Chem. 282, 34448–34456 [DOI] [PubMed] [Google Scholar]
- 5. Pinhasov A., Mandel S., Torchinsky A., Giladi E., Pittel Z., Goldsweig A. M., Servoss S. J., Brenneman D. E., Gozes I. (2003) Activity-dependent neuroprotective protein. A novel gene essential for brain formation. Brain Res. Dev. Brain Res. 144, 83–90 [DOI] [PubMed] [Google Scholar]
- 6. Kushnir M., Dresner E., Mandel S., Gozes I. (2008) Silencing of the ADNP-family member, ADNP2, results in changes in cellular viability under oxidative stress. J. Neurochem. 105, 537–545 [DOI] [PubMed] [Google Scholar]
- 7. Steingart R. A., Gozes I. (2006) Recombinant activity-dependent neuroprotective protein protects cells against oxidative stress. Mol. Cell. Endocrinol. 252, 148–153 [DOI] [PubMed] [Google Scholar]
- 8. Davidson A. J., Zon L. I. (2004) The “definitive” (and “primitive”) guide to zebrafish hematopoiesis. Oncogene 23, 7233–7246 [DOI] [PubMed] [Google Scholar]
- 9. Ziv L., Levkovitz S., Toyama R., Falcon J., Gothilf Y. (2005) Functional development of the zebrafish pineal gland. Light-induced expression of period2 is required for onset of the circadian clock. J. Neuroendocrinol. 17, 314–320 [DOI] [PubMed] [Google Scholar]
- 10. Iuchi I., Yamamoto M. (1983) Erythropoiesis in the developing rainbow trout, Salmo gairdneri irideus. Histochemical and immunochemical detection of erythropoietic organs. J. Exp. Zool. 226, 409–417 [DOI] [PubMed] [Google Scholar]
- 11. Palevitch O., Kight K., Abraham E., Wray S., Zohar Y., Gothilf Y. (2007) Ontogeny of the GnRH systems in zebrafish brain. In situ hybridization and promoter-reporter expression analyses in intact animals. Cell Tissue Res. 327, 313–322 [DOI] [PubMed] [Google Scholar]
- 12. Toobiak S., Sher E. A., Shaklai M., Shaklai N. (2011) Precise quantification of haemoglobin in erythroid precursors and plasma. Int. J. Lab. Hematol. 33, 645–650 [DOI] [PubMed] [Google Scholar]
- 13. Huo X. F., Yu J., Peng H., Du Z. W., Liu X. L., Ma Y. N., Zhang X., Zhang Y., Zhao H. L., Zhang J. W. (2006) Differential expression changes in K562 cells during the hemin-induced erythroid differentiation and the phorbol myristate acetate (PMA)-induced megakaryocytic differentiation. Mol. Cell. Biochem. 292, 155–167 [DOI] [PubMed] [Google Scholar]
- 14. Mandel S., Spivak-Pohis I., Gozes I. (2008) ADNP differential nucleus/cytoplasm localization in neurons suggests multiple roles in neuronal differentiation and maintenance. J. Mol. Neurosci. 35, 127–141 [DOI] [PubMed] [Google Scholar]
- 15. Dresner E., Agam G., Gozes I. (2011) Activity-dependent neuroprotective protein (ADNP) expression level is correlated with the expression of the sister protein ADNP2: deregulation in schizophrenia. Eur. Neuropsychopharmacol. 21, 355–361 [DOI] [PubMed] [Google Scholar]
- 16. McArthur M., Gerum S., Stamatoyannopoulos G. (2001) Quantification of DNase I sensitivity by real-time PCR. Quantitative analysis of DNase I hypersensitivity of the mouse β-globin LCR. J. Mol. Biol. 313, 27–34 [DOI] [PMC free article] [PubMed] [Google Scholar]
- 17. Galloway J. L., Zon L. I. (2003) Ontogeny of hematopoiesis. Examining the emergence of hematopoietic cells in the vertebrate embryo. Curr. Top. Dev. Biol. 53, 139–158 [DOI] [PubMed] [Google Scholar]
- 18. McGrath K., Palis J. (2008) Ontogeny of erythropoiesis in the mammalian embryo. Curr. Top. Dev. Biol. 82, 1–22 [DOI] [PubMed] [Google Scholar]
- 19. Liao E. C., Trede N. S., Ransom D., Zapata A., Kieran M., Zon L. I. (2002) Noncell autonomous requirement for the bloodless gene in primitive hematopoiesis of zebrafish. Development 129, 649–659 [DOI] [PubMed] [Google Scholar]
- 20. Juarez M. A., Su F., Chun S., Kiel M. J., Lyons S. E. (2005) Distinct roles for SCL in erythroid specification and maturation in zebrafish. J. Biol. Chem. 280, 41636–41644 [DOI] [PubMed] [Google Scholar]
- 21. Su F., Juarez M. A., Cooke C. L., Lapointe L., Shavit J. A., Yamaoka J. S., Lyons S. E. (2007) Differential regulation of primitive myelopoiesis in the zebrafish by Spi-1/Pu.1 and C/ebp1. Zebrafish 4, 187–199 [DOI] [PubMed] [Google Scholar]
- 22. Bennett C. M., Kanki J. P., Rhodes J., Liu T. X., Paw B. H., Kieran M. W., Langenau D. M., Delahaye-Brown A., Zon L. I., Fleming M. D., Look A. T. (2001) Myelopoiesis in the zebrafish, Danio rerio. Blood 98, 643–651 [DOI] [PubMed] [Google Scholar]
- 23. Paw B. H. (2001) Cloning of the zebrafish retsina blood mutation. A genetic model for dyserythropoiesis and erythroid cytokinesis. Blood Cells Mol. Dis. 27, 62–64 [DOI] [PubMed] [Google Scholar]
- 24. Brownlie A., Hersey C., Oates A. C., Paw B. H., Falick A. M., Witkowska H. E., Flint J., Higgs D., Jessen J., Bahary N., Zhu H., Lin S., Zon L. (2003) Characterization of embryonic globin genes of the zebrafish. Dev. Biol. 255, 48–61 [DOI] [PubMed] [Google Scholar]
- 25. Brownlie A., Donovan A., Pratt S. J., Paw B. H., Oates A. C., Brugnara C., Witkowska H. E., Sassa S., Zon L. I. (1998) Positional cloning of the zebrafish sauternes gene: a model for congenital sideroblastic anaemia. Nat. Genet. 20, 244–250 [DOI] [PubMed] [Google Scholar]
- 26. Friend C., Scher W., Holland J. G., Sato T. (1971) Hemoglobin synthesis in murine virus-induced leukemic cells in vitro. Stimulation of erythroid differentiation by dimethyl sulfoxide. Proc. Natl. Acad. Sci. U.S.A. 68, 378–382 [DOI] [PMC free article] [PubMed] [Google Scholar]
- 27. Orkin S. H. (1978) Differentiation of murine erythroleukemic (Friend) cells. An in vitro model of erythropoiesis. In Vitro 14, 146–154 [DOI] [PubMed] [Google Scholar]
- 28. Sabban E. L., Sabatini D. D., Marchesi V. T., Adesnik M. (1980) Biosynthesis of erythrocyte membrane protein band 3 in DMSO-induced Friend erythroleukemia cells. J. Cell. Physiol. 104, 261–268 [DOI] [PubMed] [Google Scholar]
- 29. Uoshima N., Ozawa M., Kimura S., Tanaka K., Wada K., Kobayashi Y., Kondo M. (1995) Changes in c-Kit expression and effects of SCF during differentiation of human erythroid progenitor cells. Br. J. Haematol. 91, 30–36 [DOI] [PubMed] [Google Scholar]
- 30. Bultman S. J., Gebuhr T. C., Magnuson T. (2005) A Brg1 mutation that uncouples ATPase activity from chromatin remodeling reveals an essential role for SWI/SNF-related complexes in β-globin expression and erythroid development. Genes Dev. 19, 2849–2861 [DOI] [PMC free article] [PubMed] [Google Scholar]
- 31. Griffin C. T., Brennan J., Magnuson T. (2008) The chromatin-remodeling enzyme BRG1 plays an essential role in primitive erythropoiesis and vascular development. Development 135, 493–500 [DOI] [PMC free article] [PubMed] [Google Scholar]
- 32. Brand M., Ranish J. A., Kummer N. T., Hamilton J., Igarashi K., Francastel C., Chi T. H., Crabtree G. R., Aebersold R., Groudine M. (2004) Dynamic changes in transcription factor complexes during erythroid differentiation revealed by quantitative proteomics. Nat. Struct. Mol. Biol. 11, 73–80 [DOI] [PubMed] [Google Scholar]
- 33. Kimmel C. B., Ballard W. W., Kimmel S. R., Ullmann B., Schilling T. F. (1995) Stages of embryonic development of the zebrafish. Dev. Dyn. 203, 253–310 [DOI] [PubMed] [Google Scholar]
- 34. Rifkind R. A., Marks P. A., Bank A., Terada M., Reuben R. C., Maniatis G. M., Fibach E., Nudel U., Salmon J. E., Gazitt Y. (1978) Regulation of differentiation in normal and transformed erythroid cells. In Vitro 14, 155–161 [DOI] [PubMed] [Google Scholar]
- 35. Songhet P., Adzic D., Reibe S., Rohr K. B. (2007) fgf1 is required for normal differentiation of erythrocytes in zebrafish primitive hematopoiesis. Dev. Dyn. 236, 633–643 [DOI] [PubMed] [Google Scholar]
- 36. Tripic T., Deng W., Cheng Y., Zhang Y., Vakoc C. R., Gregory G. D., Hardison R. C., Blobel G. A. (2009) SCL and associated proteins distinguish active from repressive GATA transcription factor complexes. Blood 113, 2191–2201 [DOI] [PMC free article] [PubMed] [Google Scholar]
- 37. Kim S. I., Bultman S. J., Kiefer C. M., Dean A., Bresnick E. H. (2009) BRG1 requirement for long-range interaction of a locus control region with a downstream promoter. Proc. Natl. Acad. Sci. U.S.A. 106, 2259–2264 [DOI] [PMC free article] [PubMed] [Google Scholar]
- 38. Ghazalpour A., Bennett B., Petyuk V. A., Orozco L., Hagopian R., Mungrue I. N., Farber C. R., Sinsheimer J., Kang H. M., Furlotte N., Park C. C., Wen P. Z., Brewer H., Weitz K., Camp D. G., 2nd, Pan C., Yordanova R., Neuhaus I., Tilford C., Siemers N., Gargalovic P., Eskin E., Kirchgessner T., Smith D. J., Smith R. D., Lusis A. J. (2011) Comparative analysis of proteome and transcriptome variation in mouse. PLoS Genet. 7, e1001393. [DOI] [PMC free article] [PubMed] [Google Scholar]
- 39. Fong G. H., Rossant J., Gertsenstein M., Breitman M. L. (1995) Role of the Flt-1 receptor tyrosine kinase in regulating the assembly of vascular endothelium. Nature 376, 66–70 [DOI] [PubMed] [Google Scholar]
- 40. Hattangadi S. M., Burke K. A., Lodish H. F. (2010) Homeodomain-interacting protein kinase 2 plays an important role in normal terminal erythroid differentiation. Blood 115, 4853–4861 [DOI] [PMC free article] [PubMed] [Google Scholar]
- 41. Porter F. D., Drago J., Xu Y., Cheema S. S., Wassif C., Huang S. P., Lee E., Grinberg A., Massalas J. S., Bodine D., Alt F., Westphal H. (1997) Lhx2, a LIM homeobox gene, is required for eye, forebrain, and definitive erythrocyte development. Development 124, 2935–2944 [DOI] [PubMed] [Google Scholar]
- 42. Basu P., Morris P. E., Haar J. L., Wani M. A., Lingrel J. B., Gaensler K. M., Lloyd J. A. (2005) KLF2 is essential for primitive erythropoiesis and regulates the human and murine embryonic β-like globin genes in vivo. Blood 106, 2566–2571 [DOI] [PMC free article] [PubMed] [Google Scholar]
- 43. Copp A. J. (1995) Death before birth. Clues from gene knockouts and mutations. Trends Genet. 11, 87–93 [DOI] [PubMed] [Google Scholar]
- 44. Vulih-Shultzman I., Pinhasov A., Mandel S., Grigoriadis N., Touloumi O., Pittel Z., Gozes I. (2007) Activity-dependent neuroprotective protein snippet NAP reduces τ hyperphosphorylation and enhances learning in a novel transgenic mouse model. J. Pharmacol. Exp. Ther. 323, 438–449 [DOI] [PubMed] [Google Scholar]
- 45. Pelster B., Burggren W. W. (1996) Disruption of hemoglobin oxygen transport does not impact oxygen-dependent physiological processes in developing embryos of zebra fish (Danio rerio). Circ. Res. 79, 358–362 [DOI] [PubMed] [Google Scholar]
- 46. de la Serna I. L., Ohkawa Y., Imbalzano A. N. (2006) Chromatin remodeling in mammalian differentiation: lessons from ATP-dependent remodelers. Nat. Rev. Genet. 7, 461–473 [DOI] [PubMed] [Google Scholar]
- 47. Xu Z., Meng X., Cai Y., Koury M. J., Brandt S. J. (2006) Recruitment of the SWI/SNF protein Brg1 by a multiprotein complex effects transcriptional repression in murine erythroid progenitors. Biochem. J. 399, 297–304 [DOI] [PMC free article] [PubMed] [Google Scholar]
- 48. Kadam S., Emerson B. M. (2003) Transcriptional specificity of human SWI/SNF BRG1 and BRM chromatin remodeling complexes. Mol. Cell 11, 377–389 [DOI] [PubMed] [Google Scholar]
Associated Data
This section collects any data citations, data availability statements, or supplementary materials included in this article.