

Background: Store-operated Ca2+ entry is important for cell migration.
Results: This study presents characterization of localization and roles of Orai1, STIM1, and PLA2g6 in adhesion dynamics during cell migration.
Conclusion: Orai1 and PLA2g6 are involved in adhesion formation at the front, whereas STIM1 participates in both adhesion formation and disassembly.
Significance: Results uncovered new parameters of Orai1, STIM1, and PLA2g6 involvement in cell migration.
Keywords: Calcium Channels, Calcium Signaling, Cell Adhesion, Cell Migration, Phospholipase A, Orai1, PLA2g6, STIM1, Store-operated Calcium Entry Mechanism
Abstract
Store-operated Ca2+ entry and its major determinants are known to be important for cell migration, but the mechanism of their involvement in this complex process is unknown. This study presents a detailed characterization of distinct roles of Orai1, STIM1, and PLA2g6 in focal adhesion (FA) formation and migration. Using HEK293 cells, we discovered that although molecular knockdown of Orai1, STIM1, or PLA2g6 resulted in a similar reduction in migration velocity, there were profound differences in their effects on number, localization, and lifetime of FAs. Knockdown of STIM1 caused an increase in lifetime and number of FAs, their redistribution toward lamellae region, and an increase in cell tail length. In contrast, the number of FAs in Orai1- or PLA2g6-deficient cells was significantly reduced, and FAs accumulated closer to the leading edge. Assembly rate and Vinculin phosphorylation of FAs was similarly reduced in Orai1, PLA2g6, or STIM1-deficient cells. Although Orai1 and PLA2g6 accumulated and co-localized at the leading edge, STIM1 distribution was more complex. We found STIM1 protrusions in lamellipodia, which co-localized with FAs, whereas major accumulation could be seen in central and retracting parts of the cell. Interestingly, knockdown of Orai1 and PLA2g6 produced similar and non-additive effect on migration, whereas knockdown of STIM1 simultaneously with either Orai1 or PLA2g6 produced additional inhibition. Together these data suggest that although Orai1, PLA2g6, and STIM1 play major roles in formation of new FAs at the leading edge, STIM1 may also be involved in Orai1- and PLA2g6-independent disassembly of FAs in the back of cells.
Introduction
Cell migration is a complex and highly regulated process that involves hundreds of different proteins and signaling molecules. To ensure efficient migration, a cell needs to integrate signals from both the front and the back at the same time (1–3), and deficiency in any of the mechanisms that determine either lamellipodia protrusion or rear retraction of the cell can lead to impairment of its ability to migrate.
Ca2+ is essential for many processes that determine cell migration, including focal adhesion (FA)2 assembly and disassembly and cytoskeleton dynamics (for review, see Refs. 4–6). Different Ca2+ entry mechanisms have been proposed to control events at the leading edge and/or in the back of a migrating cell (7–11), and store-operated Ca2+ entry (SOCE) is thought to be one of them.
SOCE is activated upon depletion of Ca2+ from endoplasmic reticulum (ER) stores and is mediated by plasma membrane store-operated Ca2+ channel that is encoded by Orai1. Store-operated Ca2+ is activated in response to a signal created by STIM1, a low affinity Ca2+ sensor located in the membrane of ER. Upon Ca2+ depletion within the ER, STIM1 molecules cluster in close proximity to plasma membrane, where they may interact with Orai1 channels, leading to their activation and Ca2+ influx (for review, see Ref. 12–20). Although conformational coupling and direct signal transduction from STIM1 to Orai1 appear to be sufficient for SOCE activation in overexpressed systems, additional endogenous mediators were found to be required for signal transduction from STIM1 to Orai1 in naïve cells (for review, see Ref.20 and 21). One of such mediators of endogenous SOCE is membrane-associated variant of phospholipase A2 (iPLA2β) encoded by PLA2g6 gene (20, 22, 23).
Several recent studies showed the importance of endogenous SOCE and its major determinants (Orai1, STIM1, or PLA2g6) in overall cell migration, but their roles in specific adhesion events in different parts of the cell are yet to be determined. PLA2g6 was shown to be important for speed and directionality of migrating monocytes (24), but specific variants of PLA2g6 involved in this process have not been yet identified. Orai1-induced Ca2+ entry was found to accelerate adhesive events during inflammation by regulating polarity of neutrophils (25). Another study showed that Orai1 is important for overall migration of endothelial cells (26) and for endothelial tube formation. Studies focusing on STIM1 and Orai1 showed that both proteins are critical for effective migration of breast cancer cells and mouse embryonic fibroblasts (27); knockdown or chemical inhibition of Orai1 or STIM1 decreased the number of migrating cells and their migration speed and cell invasion (metastasis) as well as decreased overall dynamics of focal adhesion. Knockdown of either Orai1 or STIM1 was also found to impair overall migration of vascular SMC (28). Moreover, overexpression of the EF-hand mutant of STIM1 was shown to increase Ca2+ influx and enhance migration of epithelial cells after wounding (29). Thus, although each major component of SOCE (Orai1, STIM1, and PLA2g6) was found to be important for cell migration, their individual input into this complex process is unknown, and it is totally unclear if each of them is required for the same or different steps of cell migration.
Coordinated dynamics of FAs in different parts of the cell is one of the important prerequisites for effective cell migration (30). New FAs get primed at the leading edge, assemble, and mature from small focal contacts to large FAs (31, 32) within the lamellipodium, a sheet-like membrane structure consisting of a dense actin meshwork (33, 34). These FAs later get disassembled within the center or the rear part of a migrating cell. Mechanical forces created by Ca2+-dependent actin polymerization in front and Ca2+-dependent actin/myosin contraction in the rear of the cells are known to closely regulate FA dynamics and determine cell migration (32, 35–38). Impairment of formation or maturation of FAs at the leading edge of lamellipodia can significantly slow down or halt cell movement. At the same time, impairment in disassembly of older FAs in the central (lamellae) region or in the back (tail) part of the cell can also prevent the cell from moving effectively (39). Nothing is known about which steps of FA dynamics are regulated by SOCE mechanism. It is also unclear if Orai1, STIM1, and PLA2g6 have the same or different roles in regulation of cell migration. In this study we analyzed individual roles of endogenous Orai1, STIM1, and PLA2g6 in the dynamics of FAs that drives different steps of cell migration and discovered intriguing differences in their involvement.
EXPERIMENTAL PROCEDURES
Cell Culture and Transfection
Human embryonic kidney cells (HEK293) were cultured in Dulbecco's modified Eagle's medium (DMEM, Invitrogen) supplemented with 1% penicillin/streptomycin (Invitrogen) and 10% fetal bovine serum (FBS, Invitrogen) at 37 °C and 5% CO2. For siRNA transfection, 420,000 cells were seeded in a 35-mm dish 1 day before transfection. 5 μl of Lipofectamine2000 (Invitrogen) were diluted in unsupplemented DMEM and incubated for 5 min. siRNAs (final concentration, each 10 nm; 20 nm scrambled RNA transfection as control for double knockdown experiments) and 0.5 μg of pGFPVinculin/0.3 μg pGFP-N1 (Clontech, Mountain View, CA), 0.8 μg of pSTIM1mCherry (40), and 0.5 μg of pGFPVinculin or 0.5 μg of pOrai1GFP (40), and/or 1 μg of pPLA2g6myc (GenBankTM AF064594) were diluted in unsupplemented DMEM and incubated for 5 min. Afterward, Lipofectamine2000 dilution was added to the siRNA/GFP dilution. After an additional 30 min of incubation, the solution was added dropwise to the dish containing unsupplemented DMEM during transfection. Cells were incubated for 4 h, and the transfection solution was exchanged against DMEM containing 10% FBS for 2 h. Afterward, cells were trypsinated and seeded in a 6-cm dish for real time PCR analysis or onto fibronectin (Sigma)-coated (2.5 μg/cm2) glass-bottom dishes for staining, migration, or FA dynamics analysis.
Immunofluorescence
Cells were washed in warm PBS (phosphate-buffered saline) and then fixed in warm 4% formaldehyde diluted in CB buffer (cytoskeleton buffer (CB): 150 mm NaCl, 5 mm MgCl2, 5 mm EGTA, 5 mm glucose, 10 mm MES, pH 6.1 (41)) for 20 min at 37 °C. Cells were washed 3 times for 5 min in CB containing 30 mm glycine, permeabilized in CB with 0.2% Triton X-100 or for myc staining with 0.5% Tween for 8 min, rinsed in CB, and blocked in 5% fat free milk powder or in 3% BSA (for myc staining) in CB for 1 h at room temperature. The samples were incubated with primary antibody (anti-Vinculin, 1:200, clone hVIN-1, Sigma; anti-Vinculin (pY1065), 1:200, Invitrogen; anti-myc, 1:100, 9B11, Cell Signaling, Danvers, MA) diluted in 5% fat-free milk powder or in 3% BSA in CB for 45 min at 37 °C, washed 3 times with 5% fat free milk powder or 3% BSA/CB plus 0.2% Tween 20 followed by secondary antibody (1:200, Alexa594 anti-mouse; Alexa350 anti-rabbit, Invitrogen) for 45 min at 37 °C in 5% fat free milk powder or 3% BSA, CB. Afterward, samples were washed 3 times with CB plus 0.2% Tween 20 and rinsed with CB. For staining with antibody against phosphorylated Vinculin (pY1065) 10% goat serum was used as blocking and PBS for all solutions instead of CB.
Molecular Knockdown and Expression Analysis
Silencer Select® siRNAs were purchased from Ambion (Invitrogen) and used at the final concentration of 10 nm. The sequences used were the following: 5′-GCAACGUGCACAAUCUCAAtt-3′ for Orai1 (s39558), 5′-GCCUAUAUCCAGAACCGUUtt-3′ for STIM1 (s13561), and a custom-made sequence (5′-GAUCAGCCUAAACAACCUAtt-3′)-specific against PLA2g6(L) and negative control #1 (4390843).
Total RNA was extracted from siRNA/GFP-transfected HEK293 cells with a High Pure RNA Isolation kit (Roche Applied Science), and cDNA was prepared using High Capacity RNA-to-cDNA kit (Applied Biosystems, Life Technologies, Grand Island, NY). RNA concentration was determined using a spectrophotometer. Quantitative real-time PCR was used to measure gene expressions using the StepOnePlus real-time PCR system (Applied Biosystems) with the following Taqman Gene Expression Assays (Applied Biosystems): GUSB (4333767), PLA2g6(L) (Hs00899715_m1), PLA2g6(S) (Hs00895670_m1), STIM1 (Hs00963373_m1), or Orai1 (Hs00385627_m1). Gene expression was normalized to control cells (transfected with negative control siRNA), and GUSB (glucouronidase β) was used as endogenous control.
Imaging
Imaging was performed using a Nikon Ti inverted fluorescence microscope equipped with a Perfect Focus system, CO2, and heating incubation (InVivo Scientific) that allowed prolonged live cell imaging at well controlled physiological conditions (37 °C and 5% CO2). For migration analysis, images of moving cells were taken using phase contrast and green fluorescence every 3 min for 3 h using a 20× S Plan Fluar, PH1 objective (Nikon, Melville, NY). To cover larger areas of migration, images of 5 × 7 adjacent areas were taken and combined using the XY-positioning stage and the tiling feature of the NIS Elements software (Nikon). Immunofluorescence staining and GFP- and/or mCherry-tagged protein-expressing cells were imaged using a 60×/1.4 Apo-Plan oil objective (Nikon) and filter sets for GFP (part number 96362; excitation, 465–495; emission, 515–555, Nikon) and Texas Red (part number, 96365; excitation, 540–580; emission, 600–660, Nikon) illumination.
Live cell movement is illustrated by supplemental Movies 1 and 2, which were created using NIS Elements software (Nikon) and ImageJ. For a better visualization, the background of Movie 1 was subtracted (rolling ball radius, 4.2 or 1.05 μm), and a median filter was applied (radius, 0.11 μm).
Vinculin and phosphorylated Vinculin (pY1065) in fixed cells were imaged using a LSM710 system (Zeiss, Thornwood, NY). All images of each siRNA transfection condition were taken with a Plan-Apochromat 63×/1.4 oil objective (Zeiss) and with the same settings. The 488 nm argon laser line was used for imaging GFP. Emitted fluorescence was collected in the range of 492 to 586 nm. Excitation of Alexa594 was performed using the 594 nm HeNe laser. Emission was collected in the range of 604 to 698 nm. The 2-photon laser was set to 725 nm to visualize Alexa350. Emission was collected in the range of 415 to 492 nm. Representative immunofluorescence images (Fig. 7 and 9) were background-corrected in ImageJ using the rolling method (rolling ball radius, 0.54 μm). Afterward, a median filter (radius, 0.05 μm) was applied.
FIGURE 7.

FA distribution in the lamellipodium upon down-regulation of individual SOCE components. A, shown are representative images of HEK293 cells transfected with scrambled RNA (control) or siRNA against Orai1 (siOrai1), STIM1 (siSTIM1), or PLA2g6 (siPLA2g6) fixed and stained for Vinculin 96 h after transfection. The leading edge is marked with a white line. Background subtraction and a median filter were applied to all images. B, analysis of FA distribution shows the histograms of absolute quantities of FAs as a function of the distance from the leading edge in control, siOrai1, siSTIM1, and siPLA2g6 cells. The following number of cells and FAs were analyzed for each condition, respectively; 93 FAs in 4 cells, 93 FAs in 5 cells, 95 FAs in 3 cells, and 74 FAs in 6 cells. Vertical lines separate front (a) and middle (b) parts of lamellipodia and the lamellae region of the cells (c).
Overall Migration Analysis
HEK293 cells were transfected with scrambled RNA, siRNA against Orai1, STIM1, or PLA2g6, and simultaneously with GFP (to mark effectively transfected cells). For double knockdown experiments, cells were transfected with scrambled RNA (20 nm) and a mixture of siOrai1 and siPLA2g6 (10 nm each) or of siOrai1 and siSTIM1 or of siPLA2g6 and siSTIM1. Cells were imaged every 3 min over 3 h. Before analysis, movies were drift-corrected using the StackReg plugin (Philippe Thévenaz, Biomedical Imaging Group, Swiss Federal Institute of Technology, Lausanne, Switzerland) in ImageJ (Wayne Rasband, National Institutes of Health, Bethesda, MD). Cell migration velocities and pathways were analyzed 72 and 96 h after transfection using ImageJ. Only GFP-transfected and single migrating cells were analyzed. To track the pathways of the cells (48–127 cells were analyzed) the manual tracking plugin was used (Fabrice Cordelires, Institute Curie, Orsay, France). For further measurement of migration velocities and to draw the migration-pathway plots, the chemotaxis plugin was used (Gerhard Trapp, Elias Horn, ibidi GmbH, Martinsried, Germany). The data were exported and analyzed with Excel. To allow comparison of single and double knockdown experiments, migration velocities were normalized to corresponding controls (HEK293 cells transfected with 10 or 20 nm scrambled RNA, respectively). To test the effect of low external Ca2+ on migration velocities, Ca2+ was omitted from the media without the addition of EGTA, which reduces Ca2+ concentration from standard 2 mm (used in all other experiments) to about 2 μm (which in the absence of Ca2+ buffers, is known to remain in the media).
Cell Area and Tail Analysis
Cells were transfected with siRNAs or scrambled RNA and imaged 72 or 96 h after transfection. Spreading areas of 58–77 cells out of two independent transfections were analyzed manually using the NIS elements software (Nikon). The cell size and minimal area occupied by non-spread cells (n = 20) was evaluated by measuring the diameter and area of rounded-up cells right before their division. The length of the rear tail was determined in 5 randomly picked images (image size, 1644 μm × 1816 μm) of a 3-h time-lapse movie, and the 10 maximal tails under each condition were measured out of 2 transfections (n = 100 cells per condition). The minimal time difference between each picked image was 30 min. A two-sided, unpaired t test was used to reveal significant differences.
Focal Adhesion Analysis
To analyze FA number per cell as well as their size and distribution, HEK293 cells were transfected simultaneously with GFP and scrambled RNA, siRNA against Orai1, STIM1, or PLA2g6, fixed, and stained for Vinculin 96 h after transfection. FAs were analyzed using an ImageJ macro script written by Dr. Lai Ding. Briefly, images were background corrected by rolling ball method (rolling ball radius, 0.54 μm) and filtered with an unsharp mask filter (radius, 0.32 μm) and a median filter (radius, 0.05 μm). FAs were identified by thresholding images. Afterward, a binary image was created, and particles with a minimal size of 20 pixels (1 pixel, 0.107 μm) were assigned as FAs. Miss-located FAs were erased manually. The leading edge was drawn for each image manually. The macro automatically measured size (μm2) of each FA (23–35 FAs were analyzed), number of FAs per cell (275–444 FAs in 10–15 cells were analyzed), and the minimal distance to the leading edge using the center of mass of each FAs. The data were exported and analyzed with Excel. For FA distribution analysis only adhesions within a maximal distance of 14 μm from the lamellipodium were used. The cross-sectional areas of FAs located within a 1 μm distance from the leading edge were analyzed. A two-sided, unpaired t test was used to analyze significant differences in FA areas, and the U test was used to reveal significant differences in the number of FAs.
FA phosphorylation was analyzed and compared in siRNA (or scrambled RNA)- and GFP-transfected cells. 96 h after transfection the cells were fixed and stained for total Vinculin (Vin) and phosphorylated Vinculin at position 1065 (pVin, 165–271 FAs were analyzed). The positions of FAs were identified by filtering (see above) Vin images using ImageJ. Thresholding the images manually created binary images that were analyzed using the analyze particles tool in ImageJ. Miss-located FAs were erased manually, and regions of interest of FAs were saved. Fluorescence intensities in these areas (regions of interest) were measured separately for the Vin and the pVin channel, and ratios (pVin/Vin) were calculated using Excel. A two-sided, unpaired t test was used to test for significant differences.
To analyze FA dynamics, cells were transfected with siRNA/scrambled RNA and GFPVinculin. 72 h after transfection cells were imaged for at least 15 min. FA lifetime (16–55 FAs were analyzed) and assembly rate (FA/min, 10 cells per condition) were measured manually using the point tool in ImageJ. FA lifetime was defined as the time from the moment of FA formation to its disassembly. For a better visualization of FAs, images were background-corrected using ImageJ by the rolling ball method (rolling ball radius, 0.11 μm). To avoid miscalculation of the lifetime due to FAs with usually shorter lifetimes formed at the outermost sides of moving cells or of FAs assembled in already retracting areas of the cell, only FAs assembled in the center of the lamellipodium with a protruding front were analyzed. A t test was used to test for significant differences in FA lifetime, and the U test was used to reveal significant differences in FA assembly rate.
Statistical Analysis
An unpaired, two-sided t test or U test were used to reveal significant differences. In the figures the following p values were identified: ***, < 0.001; **, < 0.01; *, < 0.05.
RESULTS
Similarities and Differences in Major Parameters of Cell Migration after Molecular Knockdown of Orai1, STIM1, or PLA2g6
To assess the overall migration, we monitored random movement of individual HEK293 cells for 3 h. Migration tracks of control cells (transfected with scrambled RNA and GFP) are presented in Fig. 1A and show their random migration pattern with a calculated mean migration velocity of 0.88 ± 0.02 μm/min (n = 73). To determine individual roles of Orai1, STIM1, and PLA2g6 in the migration process, HEK293 cells were transfected with specific siRNA targeting each of these genes. Quantitative real-time PCR analysis showed that 48 h after transfection, mRNA for Orai1 and STIM1 was reduced by 80 ± 1% and 66 ± 7%, respectively (Fig. 1B). To knock down a specific long variant of PLA2g6 (PLA2g6(L)), we used a new custom-made siRNA which specifically targeted exon 8b that is present in long, but spliced out in short variant of PLA2g6. Fig. 1B shows that in 48 h mRNA for PLA2g6(L) was reduced by 76 ± 1%. There was no significant reduction in mRNA for short PLA2g6(S) (the change was 18 ± 20%).
FIGURE 1.

Cell migration depends on all three SOCE components. A, the graph represents overlay of migratory tracks of control HEK293 cells (n = 73) 96 h after they were co-transfected with scrambled RNA and GFP. The starting point for each cell is in the center of an xy-coordinate system. Black dots mark the end point of the track of each cell after 3 h. B, graphs show normalized average mRNA levels of Orai1, STIM1, and PLA2g6 in HEK293 48 h after transfection with siRNA against Orai1 (siOrai1), STIM1 (siSTIM1), or long variant of PLA2g6 (siPLA2g6). All data were calculated as relative quantities (RQ) normalized to GUSB expression and to control samples (cells transfected with scrambled RNA). Data are shown as an average (±S.E.) from three separate experiments. C–E show migration paths of the cells (n = 73 for each condition) deficient in Orai1 (C), STIM1 (D), or PLA2g6 (E). Cells were monitored, and plots were generated exactly as described in A.
Fig. 1, C–E, compares migration tracks of single cells 96 h after their transfection with specific siRNAs to Orai1 (siOrai1), STIM1 (siSTIM1), or PLA2g6(L) (siPLA2g6). One can see that the overall distance and area covered by randomly moving Orai1-, STIM1-, or PLA2g6-deficient cells was significantly smaller than those of control cells (Fig. 1A); the mean migration velocities were 0.66 ± 0.02 μm/min (n = 127) in siOrai1 cells, 0.56 ± 0.02 μm/min (n = 110) in siSTIM1 cells, and 0.57 ± 0.02 μm/min (n = 100) in siPLA2g6 cells (p value<0.001 in all cases), which was about 25–35% less than in control cells (0.88 ± 0.02, n = 73). Omitting Ca2+ from external media during migration of HEK293 cells resulted in about 40% reduction of migration velocities (from 1.01 ± 0.03 μm/min (n = 41) to 0.59 ± 0.04 μm/min (n = 56)), further suggesting a major role of Ca2+ entry in this process. These results confirmed the importance of Orai1, STIM1, and PLA2g6 for cell migration and showed that molecular knockdown of either of them results, rather, in a similar decrease in the speed and distance of their random migration.
However, a closer look at other parameters of their migration revealed some important differences. Fig. 2A shows phase contrast images of live control, siOrai1, siSTIM1, and siPLA2g6 cells, in which one can notice that the overall appearance of the cells may be different. Detailed analysis of the tail length (Fig. 2B) and spreading area (Fig. 2C) highlighted these differences. Fig. 2B shows that mean tail length of siSTIM1 cells was significantly increased, whereas there were no changes in the cell tail length in siOrai1 or siPLA2g6 cells. We also found that although spreading area occupied by siOrai1, siSTIM1, or siPLA2g6 cells was significantly smaller than in control cells, such reduction was more pronounced in siOrai1 and siPLA2g6 cells (Fig. 2C). Because the size of the cells was identical under all tested conditions (mean diameter of round-up cells before their division was 27.5 ± 0.3 μm), the differences in their actual spreading could be even bigger. To better estimate their actual spreading area, the area occupied by the non-spread cells could be subtracted (as indicated by the dashed line in Fig. 2C), resulting in the actual spreading area in siOrai1 or siPLA2g6 cells being reduced by 49 and 50%, respectively. In contrast, actual spreading area in siSTIM1 cells was only decreased by 33%. All together, these data demonstrate that although siOrai1, siSTIM1, and siPLA2g6 cells show a similar reduction in migration velocity, other parameters of their migratory behavior (such as tail length and spreading area) show significant differences that may arise from different FA dynamics.
FIGURE 2.

Effect of molecular knockdown of Orai1, STIM1, or PLA2g6 on the appearance of migrating cells. A, shown are representative phase contrast images of live cells 96 h after transfection with scrambled RNA (control), or siRNA against Orai1 (siOrai1), STIM1 (siSTIM1), or PLA2g6 (siPLA2g6). White arrows highlight cell tails. The stars indicate non-spread cell used for measuring minimal cell areas. B, summary data (average ±S.E.) show maximal tail length in control, siOrai1, siSTIM1, or siPLA2g6 cells. C, summary data (average ±S.E.) show the spreading area of control, siOrai1, siSTIM1, or siPLA2g6 cells. The dashed line and the striated area in each bar indicate minimal area occupied by non-spread cells (n = 20) right before division. The numbers of cells analyzed for each condition are shown below the bars. Summary data (B and C) are from two independent experiments. p values are <0.001 (***), <0.01 (**), and <0.05 (*).
Down-regulation of STIM1, but Not Orai1 or PLA2g6, Increases the Number and Lifetime of Focal Adhesions
GFPVinculin was expressed, and live cell imaging was used to visualize FAs in migrating cells. Simultaneously, the cells were co-transfected with scrambled RNA or siRNAs against Orai1, STIM1, or PLA2g6. We found that the number of FAs per cell was significantly higher in siSTIM1 cells compared with siOrai1 or siPLA2g6 cells but not to control cells (Fig. 3A; for comparison see the images in Fig. 9A). In contrast to STIM1-deficient cells, siOrai1 or siPLA2g6 cells exhibited a significant decrease in the number of FAs per cell compared with control cells. Representative images of cells used for this analysis are shown in Fig. 9A. Knockdown of STIM1 also increased the lifetime of FAs compared with control cells, whereas knockdown of Orai1 or PLA2g6 did not have a significant effect (Fig. 3B). These data suggest that STIM1, but not Orai1 or PLA2g6, may play some role in FA disassembly.
FIGURE 3.

Differential effects of Orai1, STIM1, or PLA2g6 knockdown on number and lifetime of FAs. A, summary data (average ±S. E.) show the mean number of FAs per cell in control, siOrai1, siSTIM1, or siPLA2g6 cells fixed and stained 96 h after transfection with corresponding scrambled RNA or siRNAs. The number of fixed cells analyzed for each condition is shown below each bar. Representative images of cells used for this analysis are shown in Fig. 9A. B, shown is the mean lifetime of FAs in control, siOrai1, siSTIM1, or siPLA2g6 cells 72 h after transfection. The number of FAs in live cells analyzed per each condition is shown below each bar. Analysis was done in live cells. Summary data (A and B) are from two independent experiments for each condition. p values are <0.001 (***), <0.01 (**), and <0.05 (*).
FIGURE 9.

Analysis of Vinculin phosphorylation in siOrai1, siSTIM1, or siPLA2g6 cells. A, shown are representative images of Vinculin (red, upper row) and phosphorylated Vinculin (green, middle row) staining with the corresponding images (lower row) of the ratio of phosphorylated Vinculin (pVin) to total Vinculin (Vin) in HEK293 cells 96 h after transfection with scrambled RNA (control) or siRNA against Orai1 (siOrai1), STIM1 (siSTIM1), or PLA2g6 (siPLA2g6). Cell borders are marked with a white line. B, summary data (average ±S.E.) present the mean ratio (pVin/Vin) in control, siOrai1, siSTIM1, or siPLA2g6 cells. p values < 0.001 (***). Vin and pVin images were processed and enhanced in contrast and brightness for a better visualization. Analysis in B was done on original, unprocessed images.
Accumulation of STIM1 in the Areas of Focal Adhesion Disassembly during Migration
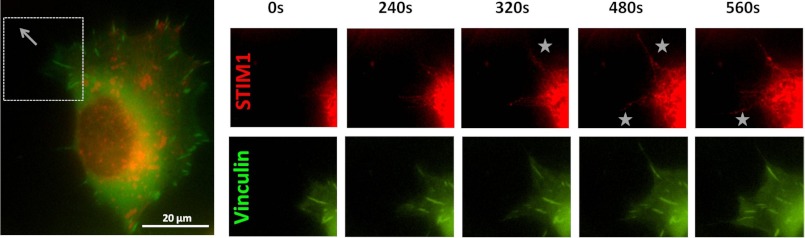
Our new findings of the distinctive role of STIM1 in tail retraction (Fig. 2B), FA number (Fig. 3A), and their lifetime (Fig. 3B) posed a question about STIM1 localization in migrating cell. To assess the relation of STIM1 localization and FA dynamics, we performed live imaging of cells co-transfected with GFPVinculin and STIM1mCherry. Fig. 4 represents supplemental Movie 1 that shows coordinated changes in STIM1 and FA distribution near the bottom plane of the migrating cell, and one can see significant accumulation of STIM1 in lamellae region and in retracting (side or rear) parts of the polarized cell (Fig. 4A). Importantly, even in resting (non-stimulated) conditions, overexpressed STIM1 forms clusters at the bottom of the cell in close proximity to plasma membrane that could be detected in the same focal plane as GFPVinculin-tagged FAs. Fig. 4B demonstrates that at time 0 (when the cell is moving downward, as seen in supplemental Movie 1), there is no visible accumulation of STIM1 around FAs in the front of the cell (area highlighted by the star). When the cell changes direction, STIM1 accumulates right next to preformed FAs (Fig. 4C, star region) that are now located at the retracting end of the moving cell. This is followed by FAs disassemble (Fig. 4D), which may further suggest an important role of STIM1 in regulation of FA disassembly.
FIGURE 4.

STIM1 clusterization in areas of FA disassembly during cell migration. Representative snapshots from the supplemental Movie 1 show HEK293 cells co-transfected with GFPVinculin and STIM1mCherry imaged during migration. A, a whole cell is shown at time point 0 in the overview image. The gray box indicates the area magnified in the adjacent image sequence (B–D). B–D, STIM1 clusters can be seen and become formed in the areas of FA disassembly in retracting parts of the cell, which are indicated by the white stars.
Co-localization of Orai1 with PLA2g6 at the Leading Edge and STIM1 Protrusions in Lamellipodium
To assess the events leading to FA formation, we took a closer look at SOCE components in the leading edge of polarized cells. Live imaging of the cells expressing GFP-tagged Orai1 revealed its accumulation at the leading edge, as can be seen on the consecutive images in Fig. 5A. The image of a fixed polarized cell (Fig. 5B) shows that PLA2g6 accumulates in the same area, where it co-localizes with Orai1. Although STIM1 seems to mainly accumulate in central lamellae region and retracting ends of the cell (Fig. 4 and supplemental Movie 1), a closer look at the leading edge of the live cells expressing STIM1mCherry and GFP Vinculin revealed formation of thin tubular STIM1 protrusions in lamellipodium (Fig. 6 and supplemental Movie 1), which reach the leading edge of the cell and could be associated with FA formation. Thus, not only Orai1 and PLA2g6, but also STIM1 (all three components of SOCE mechanism), could be found at the leading edge of cells, consistent with SOCE association with new FA formation. Interestingly, although the role of Orai1 and PLA2g6 could be spatially linked only to new FA formation at the leading edge, the role of STIM1 in FA dynamics appeared to be more complicated; its spatial distribution suggests association with both, assembly of new FAs in the leading edge, and disassembly in the retracting parts of the cell.
FIGURE 5.

Orai1 accumulation at the leading edge of a migrating cell and co-localization with PLA2g6. A, HEK293 cell was transfected with Orai1GFP and imaged during migration. The image on the left shows the whole cell at time 0. The arrow points toward the direction of migration. The gray box indicates the area shown in magnified images on the left. Note the Orai1GFP accumulations at the leading edge of the migrating cell highlighted with the stars. B, shown are representative images of a polarized HEK293 cell co-transfected with Orai1GFP and PLA2g6myc after it was fixed and immunostained. Green GFP fluorescence shows localization of Orai1GFP. The box highlights the area of magnified images on the right. These images demonstrate accumulation of Orai1 (GFP fluorescence), PLA2g6 (red staining with antibody against myc), and their co-localization (overlay) at the leading edge of the polarized cell.
FIGURE 6.
STIM1 protrusions associated with FA formation at the front of the moving cell. Shown is an overview image (left) and a series of snap shots from supplemental Movie 2 with a representative HEK293 cell co-transfected with GFPVinculin and STIM1mCherry. Stars indicate STIM1 protrusions associated with FA formation at the leading edge. The box in overview image on the left indicates the area that is magnified and shown in the sequence of images on the right. The gray arrow shows the direction of movement (see supplemental Movie 2).
Differences in Spatial Distribution of Focal Adhesions within the Lamellipodium in Polarized Cells Deficient in Orai1, STIM1, or PLA2g6
To further assess individual roles of endogenous Orai1, PLA2g6, and STIM1 in FA dynamics, we analyzed spatial distribution of FAs within the lamellipodium of cells deficient in each of them. Fig. 7A shows representative images of Vinculin staining in polarized cells transfected with scrambled RNA (control), siRNA against Orai1 (siOrai1), STIM1 (siSTIM1), or PLA2g6 (siPLA2g6). In our analysis we focused on distribution of FAs located in the lamellipodium within a distance of 14 μm from the leading edge (Fig. 7A, marked with a white line). The absolute quantities of FAs analyzed in 3–6 cells per condition as a function of the distance from the leading edge is shown in histograms (Fig. 7B) and separated for three areas of lamellipodium: front (0–2 μm from the edge), middle (2–12 μm), and lamellae region (12–14 μm). One can notice that knockdown of STIM1 led to an increased number of FAs in the lamellae region with small changes in the front of lamellipodium. In comparison with control cells, there was a 6-fold increase in the number of FAs in lamellae region (from 1.1 to 6.3%), with little change in the front (from 37.6 to 43.2%) or middle (61.3 to 50.5%) of lamellipodium. In contrast, down-regulation of Orai1 (Fig. 7B) caused FA accumulation in front (50.5%) and not in lamellae (0%) regions. Even greater accumulation of FAs in the front (65.3%) was observed in siPLA2g6 cells, in which all FAs were localized within 7 μm from the leading edge.
Assembly Rate, Size, and Age of Focal Adhesions in Orai1-, STIM1-, or PLA2g6-deficient Cells
The observed changes in distribution of FAs throughout the lamellipodium suggest substantial alterations of FA dynamics caused by down-regulation of Orai1, STIM1, or PLA2g6 in HEK293 cells. To test this, we further investigated FA assembly rate and the size (μm2) of FAs in the vicinity of the leading edge. The cells were co-transfected with GFPVinculin and siRNA against Orai1, STIM1, PLA2g6, or scrambled RNA and imaged 72 h after transfection. The assembly rate of FAs was defined as the number of newly formed FAs/min. We found that knockdown of either Orai1, STIM1, or PLA2g6 resulted in a significant reduction in the mean FA assembly rates as observed in live cells (Fig. 8A). At the same time, analysis of the size of FAs in fixed cells unmasked a significant increase in the area of FAs located up to 1 μm from the leading edge in siOrai1, siSTIM1, or siPLA2g6 cells (Fig. 8B, compare the images in Fig. 7A). These findings suggested that the maturation state of FAs may be altered in cells lacking either of the SOCE components. Vinculin phosphorylation at position 1065 is an indicator of the maturation state and age of FAs (43, 44). Newly formed FAs are known to exhibit a relatively high level of tyrosine phosphorylation that decreases upon FA maturation (45). It was shown recently that phosphorylation of Vinculin correlates with FA assembly rate at the leading edge of migrating cells (46). To verify that the observed reduction in FA assembly rate correlates with changes in Vinculin phosphorylation at position 1065, cells were transfected with scrambled RNA, siRNA against Orai1, STIM1, or PLA2g6, fixed and stained for total Vinculin (Vin, red) and phosphorylated Vinculin (pVin, green), and pVin to Vin ratio (pVin/Vin) was calculated as a direct indicator for the age of FAs (Fig. 9A). This analysis confirmed that FAs in siOrai1, siSTIM1, or siPLA2g6 cells were less phosphorylated in comparison to control cells (Fig. 9B). Interestingly, STIM1-deficient cells appeared to have the oldest FAs with pVin/Vin significantly lower than in Orai1- or PLA2g6-deficient cells.
FIGURE 8.

Assembly rate and size of FAs in Orai1-, STIM1-, or PLA2g6-deficient cells. A, shown is mean FA assembly rate in cells co-transfected simultaneously with GFPVinculin and either scrambled RNA (control) or siRNA against Orai1 (siOrai1), STIM1 (siSTIM1), or PLA2g6 (siPLA2g6). Live cells (n = 10 for each condition) were analyzed 72 h after transfection. B, shown is a summary (average ± S.E.) of the size of FAs located up to 1 μm from the leading edge in control, siOrai1, siSTIM1, or siPLA2g6 cells. Cells were co-transfected with GFP, fixed, and stained for Vinculin 96 h after transfection. Data in both A and B are from two independent experiments. p values <0.001 (***), <0.01 (**), and <0.05 (*).
Confirmation of Additional Orai1-independent Role of STIM1 in Cell Migration
Although some parameters of cell migration, FA formation, and maturation found in STIM1-deficient cells resemble those found in siOrai1 or siPLA2g6 cells, the changes found in FA distribution and lifetime in siSTIM1 cells clearly stand out and suggest that STIM1 may be also involved in additional Orai1- and PLA2g6-independent pathways. To test this, a double knockdown approach was used, and the effects on migration were compared in cells in which two SOCE components were knocked down at the same time. Quantitative real-time PCR analysis (Fig. 10A) showed that 72 h after transfection with siRNAs against two out of three targets (paired in different combinations) RNA levels were down-regulated by 67–77%. Fig. 10B confirmed that deficiency in each individual component of SOCE caused very similar reduction in the speed of cell migration (similar to that shown in Fig. 1). And yet their combined knockdown showed striking differences. Indeed, simultaneous knockdown of Orai1 and PLA2g6 caused the same effect as each of them individually, consistent with their participation in the same process. However, knockdown of STIM1 together with either Orai1 or PLA2g6 caused a significant additional reduction in migration velocities (Fig. 10B), confirming its additional (Orai1- and PLA2g6-independent) role in cell migration.
FIGURE 10.

Down-regulation of STIM1, but not Orai1 or PLA2g6, produced an additional inhibitory effect on cell migration in double knockdown experiments. A, graphs show normalized mRNA levels of Orai1, STIM1, and PLA2g6 in HEK293 72 h after their double transfection as indicated. All data were normalized to GUSB expression and to control samples (cells transfected with matching amount of scrambled RNA). Data are shown as the average (±S.E.). RQ, relative quantity. B, summary data (average ±S.E.) show velocities of individual migrating cells 72 h after single or double transfections. Numbers of cells analyzed per each condition is given in parentheses. All data are normalized to velocities of control cells. p values <0.001 (***).
DISCUSSION
Summarizing the results of this study, we may conclude that although Orai1, STIM1, and PLA2g6 are all essential for cell overall migration, their individual roles in dynamics of FAs may not be exactly the same. Systematic analysis and side-by-side comparison of the effects of molecular knockdown of each of these molecules (individually or in combination) on a wide range of parameters of migration and FA dynamics revealed not only similarities but also important differences, which bring new light to specific roles of Orai1, STIM1, and PLA2g6 in coordinated processes in the leading and trailing regions of the migrating cell.
We found that molecular knockdown of either Orai1, STIM1, or PLA2g6 caused a similar reduction in velocity and distance in migrating HEK293 cells (Fig. 1), which was consistent with earlier reports in other cell types (24, 27, 47). However, the speed of migration is determined by both accurate formation of new FAs at the front of migrating cells and regulated disassembly of FAs at the back (2, 32, 43). Impairment of either of these totally different processes will inevitably lead to a slower speed of cell migration. Similar effects of Orai1, STIM1, and PLA2g6 deficiency on the speed of cell migration found in this and prior studies cannot tell much about what is really changing within the cell and why the cell lacking any of the SOCE components cannot move as fast as control cell.
One of the parameters of cell motility is spreading area, which is a measure of the ability of a cell to adhere properly. Our studies revealed that although spreading area is reduced in cells deficient in either of SOCE components, the extent of such reduction is significantly different (Fig. 2). Surprisingly, although spreading areas of siOrai1 or siPLA2g6 cells were the same, siSTIM1 cells retained a much better ability to spread. Moreover, polarized STIM1-deficient cells (but not siOrai1 or siPLA2g6 cells) had a much longer tail, which is usually an indicator for deficient FA disassembly at the back of migrating cells. These significant differences suggest that STIM1, but not Orai1 or PLA2g6, may be involved in regulating FA disassembly at the back of a cell.
Close analysis of FAs revealed that only in STIM-deficient cells FA lifetime was increased compared with either control, siOrai1, or siPLA2g6 cells (Fig. 3). In addition, we detected STIM1 clusters forming in areas of the cells where FAs disassemble (Fig. 4 and supplemental Movie 1). In striking contrast to STIM1, knockdown of Orai1 had no effect on the length of the tail or FA lifetime. This unexpected result indicates that FA disassembly and rear detachment may be regulated via interactions of STIM1, not with Orai1, but rather with TRPC1 channels, as was proposed for epithelial cells after wounding (29). Our new findings of FA redistribution and increase in their number in central (lamellae) region in polarized STIM1-deficient cells (Fig. 7) further supports the idea of STIM1 involvement in FA disassembly.
In contrast to siSTIM1 cells, Orai1- or PLA2g6-deficient cells did not show lengthening of the tail (Fig. 2B) or an increase in FA lifetime (Fig. 3B) or enrichment of FAs in lamellae region (Fig. 7). Instead, we found significant reduction in the overall number of FAs (Fig. 3A), and accumulation of FAs very close to the leading edge with a complete loss of FAs in the lamellae region in polarized siOrai1 or siPLA2g6 cells (Fig. 7). These findings together with newly discovered accumulation and co-localization of Orai1 and PLA2g6 at the leading edge of the cell (Fig. 5) strongly suggest that Orai1 and PLA2g6 are equally required for the process of formation of new FAs at the leading edge of the cell. Protrusions of STIM1 at the front edge can provide an important trigger for PLA2g6-dependent Orai1 activation and initiation of FAs formation (Fig. 6, supplemental Movie 2). Finding Orai1, PLA2g6, and STIM1 at the points of formation of new FAs demonstrates their close association and highlights their shared role in FA assembly, which is one of the most important parameters that determine the cell ability to migrate. Interestingly, although the role of Orai1 and PLA2g6 could only be linked to FA formation at the front, the involvement of STIM1 in FA dynamics was more complicated. Multiple locations of STIM1 strongly support its association with both assembly of new FAs in the leading edge and disassembly in the retracting parts of the cell. We found that although the effect of STIM1 down-regulation was less pronounced, the assembly rate of FAs in the front (lamellipodia) area of the cell was reduced in both siOrai1 and siSTIM1 cells (Fig. 8A). To look deeper into the process of FA formation, we analyzed the age of FAs in polarized cells (Fig. 9), which was assessed by the level of tyrosine phosphorylation of Vinculin at position 1065, which is known to be high in newly formed FAs and decreases with their age (46). Consistent with all our other data, cells deficient in Orai1 turned out to have FAs significantly older (with about 32% less Vinculin phosphorylation) than control cells, which further supports the idea of Orai1 involvement in assembly rate and formation of the new FAs. Importantly, FAs in siSTIM1 cells appeared to be even older than in siOrai1 cells (with up to 70% less Vinculin phosphorylation), which is consistent with our findings that siSTIM1 cells had more FAs with a longer lifetime. In agreement with older age of FAs, their size was also increased in either Orai1- or STIM1-deficient cells (Fig. 8B). These results are consistent with STIM1 dynamics observed in live cells (Figs. 4 and 6, supplemental Movies 1 and 2) being involved in two different processes that are coordinated in time and space: disassembly of FA in the back (presumably in cooperation with TRPC1 or other channels) and assembly of FAs in front (in cooperation with Orai1). The additional reduction of migration speed in double knockdown experiments of Orai1 and STIM1 (Fig. 10) further supports this conclusion.
Striking co-localization of Orai1 and PLA2g6 at the leading edge and their very similar role in formation of new FAs was revealed in our studies. Indeed, the assembly rate of FAs was reduced (Fig. 8A), and their age was increased to the similar degree in siOrai1 and siPLA2g6 cells (Fig. 9). Furthermore, simultaneous knockdown of Orai1 and PLA2g6 did not have any additional effects on cell migration (Fig. 10). The only difference we found was the size of FAs, which was bigger in siPLA2g6 cells (Fig. 8B). This may signal for an additional Orai1-independent role of PLA2g6 in yet another process that can determine lamellipodia formation and actin dynamics, like F-actin polymerization, as was suggested in monocytes (24). It is important to emphasize that all prior studies of the role of PLA2g6 on migration were done in cells deficient in both cytosolic (short) and membrane-associated (long) splice variants of PLA2g6 (24, 48). Here, we specifically focused only on the membrane-associated (long) variant of PLA2g6 that we believe is involved in SOCE mechanism (23). All the data presented in our new study were obtained in cells in which a long but not short variant of PLA2g6 variant was knocked down using a new custom-made siRNA (developed against the Pin region that exists only in the long variant). Thus, our study showed for the first time the importance of specific long variant of PLA2g6 in the process of cell migration and its co-localization with Orai1 at the leading edge of the moving cell.
The generation of Ca2+ microdomains is known to be critical for different steps of cell migration (49–51), and a variety of signaling proteins involved in FA formation and disassembly are known to be sensitive to Ca2+. For example, calpain1 and -2 are known to become activated by calcium and in turn cleave FA components to facilitate FA formation or rear retraction (52–55). Ca2+ can also directly activate α-actinin, which cross-links F-actin and, therefore, is essential for FA maturation at the front of migrating cells (32, 56). The assembly of contractile actin fibers is necessary for FA maturation and release, which depends on the activation of myosin light chain kinase (MLCK) that phosphorylates the myosin light chain in a Ca2+-dependent manner (57, 58). Recent studies also showed a correlation between calcium influx and cAMP-dependent protein kinase regulation (6). cAMP-dependent protein kinase is known to be a key regulator during cell migration via recruitment of the active GTPase Rac to the leading edge and therefore promoting FA turnover, lamellipodial formation, and cell polarity (59, 60). There is also some evidence for a correlation between Ca2+ signaling and activation of GTPases like Rac or Rho (8, 27), including the important finding of the recovery of migration deficiency caused by down-regulation of Orai1 or STIM1 by expressing constitutively active Rac (27).
In our study we found that Orai1 is accumulated (and co-localized with PLA2g6) at the leading edge of the cell and is essential for formation of new FAs, which suggests that this specific channel may be responsible for providing Ca2+ needed for one or multiple Ca2+-dependent processes mentioned above. However, its role in each of these individual steps is yet to be determined. The results of our study also highlight new questions about how STIM1 can activate/regulate Orai1-mediated Ca2+ entry at the point of formation of FAs. It remains unclear if there is any depletion of the ER stores at the leading edge of lamellipodia that may trigger STIM1-mediated Orai1 activation and which additional mediators may be needed for that. Our important finding of a close correlation between the effects of molecular knockdown of Orai1 and PLA2g6 further suggests their functional association and involvement in the same process of Ca2+ entry. Further studies are needed to identify the exact mechanism of endogenous Orai1 activation at the leading edge of polarized cells and to determine which specific processes involved in FA formation may require Orai1-mediated Ca2+ entry.
Supplementary Material
Acknowledgment
We thank Benjamin Geiger (Weizmann Institute of Science, Rehovot, Israel) for pGFPVinculin construct.
This work was supported, in whole or in part, by National Institutes of Health Grants RO1 HL71793 and RO1 HL54150. This work was also supported by the Department of Medicine, the Cellular Imaging Core, and the Evans Center for Interdisciplinary Biomedical Research (Affinity Research Collaborative program on Calcium Homeostasis in Health and Disease) at the Boston University School of Medicine.

This article contains supplemental Movies 1 and 2.
- FA
- focal adhesion
- SOCE
- store-operated Ca2+ entry
- STIM1
- stromal interacting molecule 1
- PLA2g6
- long variant of phospholipase A2 group 6 (also called Ca2+-independent phospholipase A2 β)
- ER
- endoplasmic reticulum
- CB
- cytoskeleton buffer
- Vin
- Vinculin
- pVin
- phosphorylated Vinculin.
REFERENCES
- 1. Le Clainche C., Carlier M. F. (2008) Regulation of actin assembly associated with protrusion and adhesion in cell migration. Physiol. Rev. 88, 489–513 [DOI] [PubMed] [Google Scholar]
- 2. Webb D. J., Parsons J. T., Horwitz A. F. (2002) Adhesion assembly, disassembly, and turnover in migrating cells- over and over and over again. Nat. Cell Biol. 4, E97–E100 [DOI] [PubMed] [Google Scholar]
- 3. Small J. V., Vignal E. (2004) Encyclopedia of Biological Chemistry (Lennarz W., Lane M. D., eds), pp. 356–361, Academic, New York [Google Scholar]
- 4. Berridge M. J., Lipp P., Bootman M. D. (2000) The versatility and universality of calcium signalling. Nat. Rev. Mol. Cell Biol. 1, 11–21 [DOI] [PubMed] [Google Scholar]
- 5. Clark K., Middelbeek J., van Leeuwen F. N. (2008) Interplay between TRP channels and the cytoskeleton in health and disease. Eur. J. Cell Biol. 87, 631–640 [DOI] [PubMed] [Google Scholar]
- 6. Howe A. K. (2011) Cross-talk between calcium and protein kinase A in the regulation of cell migration. Curr. Opin. Cell Biol. 23, 554–561 [DOI] [PMC free article] [PubMed] [Google Scholar]
- 7. Chen J. P., Luan Y., You C. X., Chen X. H., Luo R. C., Li R. (2010) TRPM7 regulates the migration of human nasopharyngeal carcinoma cell by mediating Ca2+ influx. Cell Calcium 47, 425–432 [DOI] [PubMed] [Google Scholar]
- 8. Tian D., Jacobo S. M., Billing D., Rozkalne A., Gage S. D., Anagnostou T., Pavenstädt H., Pavenstaedt H., Hsu H. H., Schlondorff J., Ramos A., Greka A. (2010) Antagonistic regulation of actin dynamics and cell motility by TRPC5 and TRPC6 channels. Sci. Signal. 3, ra77. [DOI] [PMC free article] [PubMed] [Google Scholar]
- 9. Fabian A., Fortmann T., Dieterich P., Riethmüller C., Schön P., Mally S., Nilius B., Schwab A. (2008) TRPC1 channels regulate directionality of migrating cells. Pflugers Arch. 457, 475–484 [DOI] [PubMed] [Google Scholar]
- 10. Lee J., Ishihara A., Oxford G., Johnson B., Jacobson K. (1999) Regulation of cell movement is mediated by stretch-activated calcium channels. Nature 400, 382–386 [DOI] [PubMed] [Google Scholar]
- 11. Wei C., Wang X., Chen M., Ouyang K., Song L. S., Cheng H. (2009) Calcium flickers steer cell migration. Nature 457, 901–905 [DOI] [PMC free article] [PubMed] [Google Scholar]
- 12. Lewis R. S. (2011) Store-operated calcium channels. New perspectives on mechanism and function. Cold Spring Harb. Perspect. Biol. 3, a003970. [DOI] [PMC free article] [PubMed] [Google Scholar]
- 13. Putney J. W. (2009) Capacitative calcium entry. From concept to molecules. Immunol. Rev. 231, 10–22 [DOI] [PubMed] [Google Scholar]
- 14. Parekh A. B. (2010) Store-operated CRAC channels. Function in health and disease. Nat. Rev. Drug Discov. 9, 399–410 [DOI] [PubMed] [Google Scholar]
- 15. Fahrner M., Muik M., Derler I., Schindl R., Fritsch R., Frischauf I., Romanin C. (2009) Mechanistic view on domains mediating STIM1-Orai coupling. Immunol. Rev. 231, 99–112 [DOI] [PubMed] [Google Scholar]
- 16. Hogan P. G., Lewis R. S., Rao A. (2010) Molecular basis of calcium signaling in lymphocytes. STIM and ORAI. Annu. Rev. Immunol. 28, 491–533 [DOI] [PMC free article] [PubMed] [Google Scholar]
- 17. Feske S. (2009) ORAI1 and STIM1 deficiency in human and mice. Roles of store-operated Ca2+ entry in the immune system and beyond. Immunol. Rev. 231, 189–209 [DOI] [PMC free article] [PubMed] [Google Scholar]
- 18. Clapham D. E. (2009) A STIMulus Package puts orai calcium channels to work. Cell 136, 814–816 [DOI] [PubMed] [Google Scholar]
- 19. Lewis R. S. (2007) The molecular choreography of a store-operated calcium channel. Nature 446, 284–287 [DOI] [PubMed] [Google Scholar]
- 20. Bolotina V. M. (2008) Orai, STIM1 and iPLA2β. A view from a different perspective. J. Physiol. 586, 3035–3042 [DOI] [PMC free article] [PubMed] [Google Scholar]
- 21. Bolotina V. M. (2012) in Store-operated Calcium Entry (SOCE) Pathways (Groschner K., ed), pp. 115–130, Springer-Verlag/Wien, Germany [Google Scholar]
- 22. Smani T., Zakharov S. I., Leno E., Csutora P., Trepakova E. S., Bolotina V. M. (2003) Ca2+-independent phospholipase A2 is a novel determinant of store-operated Ca2+ entry. J. Biol. Chem. 278, 11909–11915 [DOI] [PubMed] [Google Scholar]
- 23. Smani T., Zakharov S. I., Csutora P., Leno E., Trepakova E. S., Bolotina V. M. (2004) A novel mechanism for the store-operated calcium influx pathway. Nat. Cell Biol. 6, 113–120 [DOI] [PubMed] [Google Scholar]
- 24. Mishra R. S., Carnevale K. A., Cathcart M. K. (2008) iPLA2β. Front and center in human monocyte chemotaxis to MCP-1. J. Exp. Med. 205, 347–359 [DOI] [PMC free article] [PubMed] [Google Scholar]
- 25. Schaff U. Y., Dixit N., Procyk E., Yamayoshi I., Tse T., Simon S. I. (2010) Orai1 regulates intracellular calcium, arrest, and shape polarization during neutrophil recruitment in shear flow. Blood 115, 657–666 [DOI] [PMC free article] [PubMed] [Google Scholar]
- 26. Li J., Cubbon R. M., Wilson L. A., Amer M. S., McKeown L., Hou B., Majeed Y., Tumova S., Seymour V. A., Taylor H., Stacey M., O'Regan D., Foster R., Porter K. E., Kearney M. T., Beech D. J. (2011) Orai1 and CRAC channel dependence of VEGF-activated Ca2+ entry and endothelial tube formation. Circ. Res. 108, 1190–1198 [DOI] [PMC free article] [PubMed] [Google Scholar]
- 27. Yang S., Zhang J. J., Huang X. Y. (2009) Orai1 and STIM1 are critical for breast tumor cell migration and metastasis. Cancer Cell 15, 124–134 [DOI] [PubMed] [Google Scholar]
- 28. Bisaillon J. M., Motiani R. K., Gonzalez-Cobos J. C., Potier M., Halligan K. E., Alzawahra W. F., Barroso M., Singer H. A., Jourd'heuil D., Trebak M. (2010) Essential role for STIM1/Orai1-mediated calcium influx in PDGF-induced smooth muscle migration. Am. J. Physiol. Cell Physiol. 298, C993–C1005 [DOI] [PMC free article] [PubMed] [Google Scholar]
- 29. Rao J. N., Rathor N., Zou T., Liu L., Xiao L., Yu T. X., Cui Y. H., Wang J. Y. (2010) STIM1 translocation to the plasma membrane enhances intestinal epithelial restitution by inducing TRPC1-mediated Ca2+ signaling after wounding. Am. J. Physiol. Cell Physiol. 299, C579–C588 [DOI] [PMC free article] [PubMed] [Google Scholar]
- 30. Vicente-Manzanares M., Webb D. J., Horwitz A. R. (2005) Cell migration at a glance. J. Cell Sci. 118, 4917–4919 [DOI] [PubMed] [Google Scholar]
- 31. Schäfer C., Borm B., Born S., Möhl C., Eibl E. M., Hoffmann B. (2009) One step ahead. Role of filopodia in adhesion formation during cell migration of keratinocytes. Exp. Cell Res. 315, 1212–1224 [DOI] [PubMed] [Google Scholar]
- 32. Schäfer C., Born S., Möhl C., Houben S., Kirchgessner N., Merkel R., Hoffmann B. (2010) The key feature for early migratory processes. Dependence of adhesion, actin bundles, force generation, and transmission on filopodia. Cell Adh. Migr. 4, 215–225 [DOI] [PMC free article] [PubMed] [Google Scholar]
- 33. Small J. V. (2010) Dicing with dogma. De-branching the lamellipodium. Trends Cell Biol. 20, 628–633 [DOI] [PMC free article] [PubMed] [Google Scholar]
- 34. Urban E., Jacob S., Nemethova M., Resch G. P., Small J. V. (2010) Electron tomography reveals unbranched networks of actin filaments in lamellipodia. Nat. Cell Biol. 12, 429–435 [DOI] [PubMed] [Google Scholar]
- 35. Galbraith C. G., Yamada K. M., Sheetz M. P. (2002) The relationship between force and focal complex development. J. Cell Biol. 159, 695–705 [DOI] [PMC free article] [PubMed] [Google Scholar]
- 36. Balaban N. Q., Schwarz U. S., Riveline D., Goichberg P., Tzur G., Sabanay I., Mahalu D., Safran S., Bershadsky A., Addadi L., Geiger B. (2001) Force and focal adhesion assembly. A close relationship studied using elastic micropatterned substrates. Nat. Cell Biol. 3, 466–472 [DOI] [PubMed] [Google Scholar]
- 37. Gardel M. L., Sabass B., Ji L., Danuser G., Schwarz U. S., Waterman C. M. (2008) Traction stress in focal adhesions correlates biphasically with actin retrograde flow speed. J. Cell Biol. 183, 999–1005 [DOI] [PMC free article] [PubMed] [Google Scholar]
- 38. Gupton S. L., Waterman-Storer C. M. (2006) Spatiotemporal feedback between actomyosin and focal-adhesion systems optimizes rapid cell migration. Cell 125, 1361–1374 [DOI] [PubMed] [Google Scholar]
- 39. Broussard J. A., Webb D. J., Kaverina I. (2008) Asymmetric focal adhesion disassembly in motile cells. Curr. Opin. Cell Biol. 20, 85–90 [DOI] [PubMed] [Google Scholar]
- 40. Gwozdz T., Dutko-Gwozdz J., Zarayskiy V., Peter K., Bolotina V. M. (2008) How strict is the correlation between STIM1 and Orai1 expression, puncta formation, and ICRAC activation? Am. J. Physiol. Cell Physiol. 295, C1133–C1140 [DOI] [PMC free article] [PubMed] [Google Scholar]
- 41. Small J. V. (1981) Organization of actin in the leading edge of cultured cells. Influence of osmium tetroxide and dehydration on the ultrastructure of actin meshworks. J. Cell Biol. 91, 695–705 [DOI] [PMC free article] [PubMed] [Google Scholar]
- 42.Deleted in proof
- 43. Möhl C., Kirchgessner N., Schäfer C., Küpper K., Born S., Diez G., Goldmann W. H., Merkel R., Hoffmann B. (2009) Becoming stable and strong. The interplay between Vinculin exchange dynamics and adhesion strength during adhesion site maturation. Cell Motil. Cytoskeleton 66, 350–364 [DOI] [PubMed] [Google Scholar]
- 44. Zaidel-Bar R., Cohen M., Addadi L., Geiger B. (2004) Hierarchical assembly of cell-matrix adhesion complexes. Biochem. Soc. Trans. 32, 416–420 [DOI] [PubMed] [Google Scholar]
- 45. Zamir E., Katz B. Z., Aota S., Yamada K. M., Geiger B., Kam Z. (1999) Molecular diversity of cell-matrix adhesions. J. Cell Sci. 112, 1655–1669 [DOI] [PubMed] [Google Scholar]
- 46. Möhl C., Kirchgessner N., Schäfer C., Hoffmann B., Merkel R. (2012) Quantitative mapping of averaged focal adhesion dynamics in migrating cells by shape normalization. J. Cell Sci. 125, 155–165 [DOI] [PubMed] [Google Scholar]
- 47. Potier M., Gonzalez J. C., Motiani R. K., Abdullaev I. F., Bisaillon J. M., Singer H. A., Trebak M. (2009) Evidence for STIM1- and Orai1-dependent store-operated calcium influx through ICRAC in vascular smooth muscle cells. Role in proliferation and migration. FASEB J. 23, 2425–2437 [DOI] [PMC free article] [PubMed] [Google Scholar]
- 48. Carnevale K. A., Cathcart M. K. (2001) Calcium-independent phospholipase A(2) is required for human monocyte chemotaxis to monocyte chemoattractant protein 1. J. Immunol. 167, 3414–3421 [DOI] [PubMed] [Google Scholar]
- 49. Clapham D. E. (2007) Calcium signaling. Cell 131, 1047–1058 [DOI] [PubMed] [Google Scholar]
- 50. Collins S. R., Meyer T. (2009) Calcium flickers lighting the way in chemotaxis? Dev. Cell 16, 160–161 [DOI] [PMC free article] [PubMed] [Google Scholar]
- 51. Wei C., Wang X., Chen M., Ouyang K., Zheng M., Cheng H. (2010) Flickering calcium microdomains signal turning of migrating cells. Can. J. Physiol. Pharmacol. 88, 105–110 [DOI] [PubMed] [Google Scholar]
- 52. Chan K. T., Bennin D. A., Huttenlocher A. (2010) Regulation of adhesion dynamics by calpain-mediated proteolysis of focal adhesion kinase (FAK). J. Biol. Chem. 285, 11418–11426 [DOI] [PMC free article] [PubMed] [Google Scholar]
- 53. Dourdin N., Bhatt A. K., Dutt P., Greer P. A., Arthur J. S., Elce J. S., Huttenlocher A. (2001) Reduced cell migration and disruption of the actin cytoskeleton in calpain-deficient embryonic fibroblasts. J. Biol. Chem. 276, 48382–48388 [DOI] [PubMed] [Google Scholar]
- 54. Goll D. E., Thompson V. F., Li H., Wei W., Cong J. (2003) The calpain system. Physiol. Rev. 83, 731–801 [DOI] [PubMed] [Google Scholar]
- 55. Bhatt A., Kaverina I., Otey C., Huttenlocher A. (2002) Regulation of focal complex composition and disassembly by the calcium-dependent protease calpain. J. Cell Sci. 115, 3415–3425 [DOI] [PubMed] [Google Scholar]
- 56. Noegel A., Witke W., Schleicher M. (1987) Calcium-sensitive non-muscle α-actinin contains EF-hand structures and highly conserved regions. FEBS Lett. 221, 391–396 [DOI] [PubMed] [Google Scholar]
- 57. Somlyo A. P., Somlyo A. V. (2003) Ca2+ sensitivity of smooth muscle and nonmuscle myosin II. Modulated by G proteins, kinases, and myosin phosphatase. Physiol. Rev. 83, 1325–1358 [DOI] [PubMed] [Google Scholar]
- 58. Webb D. J., Donais K., Whitmore L. A., Thomas S. M., Turner C. E., Parsons J. T., Horwitz A. F. (2004) FAK-Src signalling through paxillin, ERK, and MLCK regulates adhesion disassembly. Nat. Cell Biol. 6, 154–161 [DOI] [PubMed] [Google Scholar]
- 59. Howe A. K., Baldor L. C., Hogan B. P. (2005) Spatial regulation of the cAMP-dependent protein kinase during chemotactic cell migration. Proc. Natl. Acad. Sci. U.S.A. 102, 14320–14325 [DOI] [PMC free article] [PubMed] [Google Scholar]
- 60. Logue J. S., Whiting J. L., Tunquist B., Langeberg L. K., Scott J. D. (2011) Anchored protein kinase A recruitment of active Rac GTPase. J. Biol. Chem. 286, 22113–22121 [DOI] [PMC free article] [PubMed] [Google Scholar]
Associated Data
This section collects any data citations, data availability statements, or supplementary materials included in this article.