

Background: Indirect evidence suggests that connexin hemichannels are permeable to Ca2+, but direct demonstration is lacking.
Results: Calcium moves into liposomes containing purified Cx26 in response to a concentration gradient.
Conclusion: Cx26 hemichannels are permeable to Ca2+.
Significance: Cx26 hemichannels may play a role in Ca2+ influx into cells under conditions that lead to hemichannel activation, such as ischemic damage.
Keywords: ATP, Calcium, Connexin, Fluorescence, Gap Junctions, Membrane Proteins, Permeability, Reconstitution of Membrane Transporters, Transport
Abstract
Gap junction channels communicate the cytoplasms of two cells and are formed by head to head association of two hemichannels, one from each of the cells. Gap junction channels and hemichannels are permeable to ions and hydrophilic molecules of up to Mr 1,000, including second messengers and metabolites. Intercellular Ca2+ signaling can occur by movement of a number of second messengers, including Ca2+, through gap junction channels, or by a paracrine pathway that involves activation of purinergic receptors in neighboring cells following ATP release through hemichannels. Understanding Ca2+ permeation through Cx26 hemichannels is important to assess the role of gap junction channels and hemichannels in health and disease. In this context, it is possible that increased Ca2+ influx through hemichannels under ischemic conditions contributes to cell damage. Previous studies suggest Ca2+ permeation through hemichannels, based on indirect arguments. Here, we demonstrate for the first time hemichannel permeability to Ca2+ by measuring Ca2+ transport through purified Cx26 hemichannels reconstituted in liposomes. We trapped the low affinity Ca2+-sensitive fluorescent probe Fluo-5N into the liposomes and followed the increases in intraliposomal [Ca2+] in response to an imposed [Ca2+] gradient. We show that Ca2+ does move through Cx26 hemichannels and that the permeability of the hemichannels to Ca2+ is high, similar to that for Na+. We suggest that hemichannels can be a significant pathway for Ca2+ influx into cells under conditions such as ischemia.
Introduction
Gap junction channels (GJCs)2 are aqueous channels that communicate the cytoplasms of adjacent cells (1–3). They are formed by head to head association of hemichannels (HCs, connexin hexamers, connexons), one from each of the neighboring cells, that are permeable to ions and hydrophilic molecules of up to Mr 1,000 (1–3).
In addition to their known permeability to inorganic monovalent ions, it is well established that the GJC and HC pores are sufficiently large to allow permeation of many larger compounds including cAMP, cGMP, IP3, ATP, and glucose, as well as Ca2+ (4–8). GJCs and HCs display significant selectivity for molecules of very similar properties (e.g., cAMP versus cGMP, IP3 isomers) because of major interactions of the permeants with the pore, which prevents simple extrapolation from apparent pore size to permeabilities of specific molecules (1, 9–11).
Connexin-mediated intercellular Ca2+ signaling can occur by movement of second messengers such as IP3 and/or Ca2+ through GJCs (1, 12–20) or by a process that involves release of ATP through HCs (paracrine pathway) (1, 4, 8, 17, 21). In the latter, ATP release through HCs increases Ca2+ influx and intracellular [Ca2+] in response to activation of purinergic receptors in neighboring cells. There are studies that support roles of IP3 and/or Ca2+ permeation through GJCs (12–20), as well as a major role of HCs in the paracrine pathway (4, 8, 17, 21). However, unambiguous identification of the pathways and mediators associated with an effect in cells is possible but often difficult.
Physiological levels of extracellular [Ca2+] decrease HC activity (22–24). However, HCs can be activated in the presence of millimolar extracellular [Ca2+] under a number of conditions, including ischemia, inflammation, connexin dephosphorylation, and extracellular alkalinization (25–28). Understanding Ca2+ permeation through Cx26 HCs is also important because increased Ca2+ permeability may constitute the bases for the association of the G45E mutant with the keratitis ichthyosis deafness syndrome (29).
Previous studies suggested Ca2+ permeation through GJCs or HCs (1, 13, 14, 18, 20, 30), but those studies are indirect, and therefore Ca2+ permeation through open HCs was considered likely but remained unproven. Here, we show that Ca2+ actually permeates purified and reconstituted Cx26 HCs and that HC Ca2+ permeability is high, similar to that for Na+.
EXPERIMENTAL PROCEDURES
Protein Expression and Purification
We expressed and purified wild-type human Cx26 followed by a poly-His tag (six His) at the C-terminal end (Cx26). Human Cx26 was amplified by PCR using pOcyt-Cx26 as template (23), with the addition of the poly-His tag and EcoRI and XbaI flanking sequences for cloning into the baculovirus transfer vector pFastBac (Invitrogen). Recombinant baculoviruses were generated using the Bac-to-Bac system (Invitrogen) following the manufacturer's instructions. The viruses were produced in Sf9 insect cells grown at 26 °C in Grace's medium supplemented with 10% fetal calf serum and 0.05 mg/ml gentamycin.
Proteins were expressed in Sf9 cells in suspension, grown in 2-liter baffled flasks containing 700 ml of HyClone CCM3 medium supplemented with 10 μg/ml of gentamycin. The cells grown at 26 °C, shaken at 200 rpm, were infected at a concentration of ∼2 × 10⁶ cells/ml, using a multiplicity of infection of 2. When cell viability, determined by Trypan blue staining, was ∼40%, ∼48 h post-infection, the cells were harvested by centrifugation at 1,000 × g for 10 min. This and all subsequent steps were performed at 4 °C unless indicated otherwise. Purification started by resuspending fresh pellets or pellets stored at −80 °C in a 1 mm bicarbonate solution containing 1 mm PMSF, and the cells were lysed with a Dounce homogenizer. The membranes were alkali-extracted by addition of NaOH to 60 mm, followed by incubation on ice for 30 min. Alkali-extracted samples were centrifuged at 26,000 × g for 30 min, and the membrane pellet was solubilized with 2.5% n-dodecyl-β-d-maltoside (DDM), in 2 m NaCl, 2 mm EGTA, 2 mm DTT, 10% glycerol, 1 mm PMSF, and 10 mm glycine/NaOH, pH 8, at a protein concentration of <2 mg/ml. The suspension was sonicated with a probe sonicator and then incubated for 2 h with gentle rotation. After ultracentrifugation at 100,000 × g for 30 min, the solubilized material was diluted with 2.5 volumes of 5 mm imidazole, 10% glycerol, 1 mm PMSF, 0.03% DDM, and 50 mm HEPES/NaOH, pH 8.0. The diluted samples were then loaded onto a Talon Co2+ column (Talon Superflow, Clontech) pre-equilibrated with the dilution buffer, at a rate of 0.5 ml/min. After washing with 10 column volumes of 10 mm KCl, 10% glycerol, 20 mm imidazole, 0.03% DDM, and 10 mm HEPES/KOH, pH 7.4, elution proceeded with the same buffer but increasing imidazole to 250 mm.
Analysis of the Oligomeric State of Purified Cx26
The oligomerization of solubilized Cx26 was determined by gel filtration on a Superdex 200HR 10/300 GL column (GE Healthcare) using an ÄKTA FPLC system (GE Healthcare). For these experiments, Cx26 (500 μl at ∼0.5 mg/ml) in 0.03% DDM, 150 mm NaCl, 10% glycerol, and 10 mm HEPES/NaOH, pH 7.4, was injected into the column equilibrated with the same buffer and run at a flow rate of 0.5 ml/min. Apparent molecular mass was calculated from the linear relationship between partition coefficient Kav and the log of the molecular mass, using the following standards, run under the same conditions: 440 kDa (ferritin), 158 kDa (aldolase), 43 kDa (ovalbumin), and 13.7 kDa (ribonuclease A); blue dextran 2000 (∼2,000 kDa) was used to determine the void volume. Highly purified Cx26 (peak collected from the gel filtration run) was also analyzed by dynamic light scattering measured at 90 degrees using a Brookhaven Instruments BI-200SM with an avalanche photodetector (Brookhaven, CT).
Reconstitution of Cx26 HCs
Reconstitution was performed in a mixture of phosphatidylcholine (PC) and phosphatidylserine (PS) at a 2:1 ratio (w/w), as described for Cx43 HCs (31), with some modifications. Lipids from chloroform stocks, mixed at the indicated ratio, were lyophilized overnight under argon. The dry lipids film was rehydrated in 75 μl of buffer/mg of lipid, and the suspension was warmed to 37 °C until it became transparent. For all experiments, except the sucrose transport assay (see below), the buffer contained 100 mm KCl, 0.1 mm EGTA, 2.3% n-octyl-β-d-glucopyranoside, and 25 mm HEPES, pH 7.6. Solubilized Cx26 was added to the lipid-detergent mixture and dialyzed through a Spectra/Pro 6,000–8,000 molecular mass cutoff membrane (Spectrum Laboratories, Rancho Dominguez, CA) for 36 h at room temperature against 2 liters of detergent-free buffer containing 10 ml of a 50% (w/v) suspension of Biobeads SM-2 (Bio-Rad). Unilamellar liposomes and proteoliposomes were produced by extrusion (Mini-Extruder; Avanti Polar Lipids, Alabaster, AL). The proportion of HCs with the extracellular domains facing out was estimated from thrombin digestion experiments. For these studies, we engineered a human Cx26 with the addition of a thrombin cleavage site between the end of the Cx26 sequence and the poly-His tag (Cx26T). The thrombin site was introduced by exchange of the 742-bp BamHI/XbaI fragment of Cx26 with an identical PCR fragment, except for the addition of the sequence for the thrombin cleavage site LVPRGS. Cx26T reconstituted in liposomes (typically 20 μg of protein) was incubated with 0.1 units of restriction grade thrombin (EMD Biosciences) at room temperature, for 16 h, and the reactions were stopped by adding SDS gel sample buffer. The percentage of HCs with the extracellular domains facing out was estimated from densitometry analysis of the signal from immunoblots probed with an anti-His tag antibody (anti-Penta-His; Qiagen).
Secondary Structure Determination by Infrared Spectroscopy
The secondary structure of purified Cx26 was determined at 20 °C by Fourier transform infrared spectroscopy using a Tensor 37 infrared spectrometer equipped with a liquid N2-cooled photovoltaic MCT detector with a BaF2 window (Bruker, Billerica, MA). Purified Cx26 in DDM was studied on a 7-μm path length transmission cell (AquaSpec; Bruker) at a concentration of 1–5 mg/ml in the gel filtration buffer described above, whereas reconstituted Cx26 (200 μg at 1:50 protein:lipid, w/w) was analyzed on an attenuated total reflectance cell (BioATR II; Bruker). The spectra collected between wave numbers of 3,100 and 1,000 cm−1, with a resolution of 4 cm−1, were used to calculate secondary structures from the difference spectra (solubilized Cx26 minus buffer or proteoliposomes minus liposomes), using the Bruker protein library.
Sucrose Transport
Sucrose permeability of liposomes containing purified Cx26 was determined by the transport-specific fractionation technique (31–33). For these experiments, Cx26 was reconstituted in liposomes containing traces of phosphatidylethanolamine labeled with lissamine rhodamine B (PE-R; PC:PS:PE-R ratio of 2:1:0.05, w/w/w), using a buffer that contained 10 mm KCl, 0.1 mm EGTA, 459 mm urea, and 10 mm HEPES, pH 7.6. Basically, liposomes containing PE-R were layered onto a linear iso-osmolar sucrose gradient (0–400 mm sucrose with a reverse urea gradient), and the gradient was centrifuged on a swinging bucket rotor (Beckman SW32Ti) at 125,000 × g for 5 h at 4 °C. The location of the liposomes was determined from direct visualization and from the fluorescence of fractions collected from the top to the bottom of the gradient. Rhodamine B fluorescence was measured at 590 nm, with excitation at 560 nm (spectrofluorometer F-7000; Hitachi).
Transport of Fluorescent Dyes
Liposomes and proteoliposomes were loaded with either Alexa Fluor 350 (AF350, 250 μm) or AF 647 (AF647, 125 μm) in 100 mm KCl, 0.1 mm EGTA, 25 mm HEPES/KOH, pH 7.6. Loading was accomplished by four freeze-thaw cycles, each by placing the samples 1 min in liquid N2 followed by 5 min in a bath at 27 °C. Loading by extrusion was less efficient, but the functional data were similar, indicating that the HCs were not affected by the freeze-thaw procedure. After removal of most extraliposomal dyes by gel filtration on PD10 columns (GE Healthcare), the samples were run at 21–22 °C on a 3-ml Superdex HR200 5/150 GL gel filtration column (GE Healthcare), on a LabAlliance APLC system equipped with absorbance and multiwavelength fluorescence detectors (LabAlliance, State College, PA). The position of the liposomes was determined by the absorbance at 280 nm or the fluorescence from PE-R. Retention of dye trapped in liposomes was detected at excitation and emission wavelengths of 345 and 445 nm for AF350 and 650 and 670 nm for AF647.
ATP Transport
Experiments were performed as described in the previous section, but the liposomes and proteoliposomes were loaded with 1 mm ATP. After removal of most extraliposomal ATP by gel filtration on PD10 columns (GE Healthcare), 250 μl of the samples were combined with 5 μl of a mix containing luciferase (QuantiLum Photinus pyralis recombinant luciferase; Promega, Madison, WI), luciferin (GoldBio, St. Louis, MO), EDTA, and MgSO4, to yield final reaction concentrations of 18 nm, 610 μm, 0.5 mm, and 5 mm, respectively. Luminescence was measured on a Turner 20/20n luminometer (Sunnyvale, CA), and ATP retained in the liposomes was determined as the difference in luminescence between total ATP (after addition of Triton X-100 to 0.4%) and extraliposomal ATP (accessible to luciferase in the absence of Triton X-100).
Transport of Ca2+, Na+, and H+ Equivalents
For the Ca2+ transport experiments, the low affinity Ca2+-sensitive probe Fluo-5N (pentapotassium salt, 25 μm; Invitrogen) was loaded into the liposomes, as described for the fluorescent dyes above. Free [Ca2+] was increased from <10 nm to 500 μm free [Ca2+] by manual addition of CaCl2 to the cuvette in a fluorometer (excitation, 490 nm; emission, 520 nm) or by rapid mixing on a SX20 stop flow device with a 20-μl chamber and a dead time of <0.5 ms (Applied Photophysics, Surrey, UK), with excitation at 470 nm and emission collected through a 500-nm long pass filter. Na+ transport experiments were essentially similar, but the liposomes were loaded with the Na+-sensitive probe 1,3-benzenedicarboxylic acid, 4,4′-[1,4,10-trioxa-7,13-diazacyclopentadecane-7,13-diylbis(5-methoxy-6,2-benzofurandiyl)]bis (SBFI, tetraammonium salt, 25 μm; Invitrogen) in a buffer devoid of Na+ (replaced with N-methyl-d-glucamonium, NMDG): 70 mm KCl, 0.1 mm EGTA, 30 mm NMDG, and 25 mm HEPES/KOH, pH 7.6. Extraliposomal [Na+] was increased to 15 mm by replacing the NMDG in the solution above with Na+. Excitation was at 340 nm, and emission was measured through a 400-nm-long pass filter. The assay for H+ transport was based on the pH sensitivity of fluorescein emission; we used liposomes containing traces of the fluorescein-labeled phospholipid N-(fluorescein-5-thiocarbamoyl)-1,2-dihexadecanoyl-sn-glycero-3-phosphoetha-nolamine (DHPE-Fl, head group-labeled; Invitrogen). Purified Cx26 was reconstituted in a mix of lipids containing PC, PS, and DHPE-Fl at a PC:PS:DHPE-Fl ratio of 2:1:0.005 (w/w/w). For the experiments, starting with 100 mm KCl, 0.1 mm EGTA, 25 mm HEPES/KOH, pH 7.6, the pH was reduced by HCl addition until the one to one mixture of the final solution had a pH of 6.4. The detection conditions were as described for Fluo-5N. All of the experiments were performed at 20 °C.
Analysis of the Changes in Fluorescence
Multiexponential functions were used to fit the changes in fluorescence of the stop flow experiments. The need for multiexponential fits was not surprising for a number of reasons, depending on the probe, including the effects of Ca2+, and potentially pH, on HC activity, the “mixed” orientation of the HCs, and the nonlinear dependence of Fluo-5N and SBFI emission on [Ca2+] and [Na+], respectively. Half of the HCs are in the extracellular domains-out orientation (see “Results”), and therefore a potential inhibition at 500 μm Ca2+, and any effect of decreasing pH, may occur first in the HCs with the extracellular domains facing out and only later in HCs with the extracellular domains facing in; for example, exposure of the extracellular side of the HCs to 500 μm Ca2+ will occur in <0.5 ms for HCs in the extracellular domains-out orientation, but it will take seconds for Ca2+ to reach inhibitory concentrations inside the liposomes. In addition, the apparent Kd of Fluo-5N for Ca2+ under our experimental conditions was 132 ± 10 μm (n = 3), and therefore Fluo-5N emission changes linearly with [Ca2+] only to ∼40 μm [Ca2+], ∼25% of the fluorescence at 500 μm [Ca2+]. A similar nonlinear dependence of SBFI emission on [Na+] exists because its apparent Kd for Na+ under the conditions of our experiments is ∼15 mm. In contrast, the decrease in the fluorescence from the fluorescein-labeled phospholipids is linear with lowering pH from 7.6 to 6.4. The initial rates of change in concentrations were calculated for the 0–10-ms period using the faster exponential rate, expressed over a 1-s period. We argue that this simplified calculation of initial transport rates is justified for the purpose of our studies, despite a minor underestimation. The faster rates were 2.55 ± 0.43, 2.42 ± 0.49, and 13.91 ± 0.97 s−1 for Ca2+, Na+, and H+, respectively, and the components with these rates accounted for 85–95% of the fluorescence change in the 0–10-ms period. The ratio of the faster to the second faster rates were 13 ± 1 (n = 20), 16 ± 2 (n = 6), and 14 ± 1 (n = 6), for Ca2+, Na+, and H+, respectively. Fits to three-exponential functions were performed with the Applied Photophysics Pro-Data Viewer analysis software, and the goodness of fit was determined from the random residual distribution, which showed no structure and chi-squared values near unity.
Other Techniques
Protein concentrations were determined with the BCA protein assay reagent (Bio-Rad), using bovine serum albumin as standard. For Western blots, we used anti-Cx26 antibodies directed against the intracellular loop and N-terminal region (Zymed Laboratories Inc., South San Francisco, CA) or His tag (anti-Penta-His; Qiagen). Detection was by imaging (Odyssey infrared imager; Li-Cor Biosciences, Lincoln, NE) of goat anti-rabbit IRDye 800 (Li-Cor Biosciences) for the anti-Cx26 antibodies or goat anti-mouse Alexa Fluor 680 (Invitrogen) for the anti-His antibody.
Statistics
The data shown are the means ± S.E. Statistically significant differences were assessed by Student's t test for unpaired data or one-way analysis of variance, as appropriate.
RESULTS
Biochemical Characterization of the Purified Cx26
Cx26 purified by a combination of immobilized metal affinity chromatography (based on the C-terminal His tag) and size exclusion chromatography shows a high degree of purity, as evaluated in gel filtration chromatograms (Fig. 1A) and Coomassie Blue-stained gels of detergent-solubilized Cx26 (Fig. 1B). The latter and Western blots probed with anti-Cx26 antibodies (see Fig. 1C for an example of reconstituted Cx26) show monomers and some oligomers stable in SDS, which run faster than expected. Only one absorbance peak was observed in size exclusion chromatograms, corresponding to an apparent molecular mass of 235 ± 12 kDa (n = 18). This is compatible with an Cx26 hexamer with ∼30% (w/w) associated detergent. The hydrodynamic radius from dynamic light scattering determinations was 5.4 ± 0.2 nm (n = 6). From the difference between this value and the hydrodynamic radius of 4.4 nm, calculated for the Cx26 HC structure (34), we estimated that the protein-detergent complex contains 40–45% (w/w) of detergent. The apparent size of the protein-detergent complex indicates that Cx26 solubilized in DDM is present as hexamers (HCs), as opposed to dodecameric GJCs.
FIGURE 1.

Biochemical properties of purified Cx26. A, size exclusion chromatogram of purified Cx26. Approximately 250 μg of purified Cx26 solubilized in DDM were injected into the column. A280, absorbance at 280 nm. B, Coomassie Blue-stained gel of purified Cx26. Approximately 10 μg of protein were run. The positions of molecular mass markers are indicated on the left. The arrows point to monomers and oligomers of Cx26 whose identity was confirmed by Western blots with anti-Cx26 and anti-His antibodies. C, Western blot of purified Cx26 (∼4 μg) reconstituted into liposomes, probed with an antibody against the Cx26 N-terminal region. See B for details. D, infrared spectrum of purified Cx26 (2 mg/ml) solubilized in DDM. E, assessment of Cx26 HC orientation in liposomes. A thrombin site was introduced in the C-terminal region of Cx26, preceding the poly-His tag (Cx26T), and His tag accessibility was assessed by comparing samples in the absence of thrombin (−) and after treatment with the enzyme (+). HCs were studied solubilized in detergent (det) or reconstituted in liposomes (lipo). Top panel, immunoblots using an anti-His tag antibody. Bottom panel, Coomassie Blue-stained bands showing similar levels of protein. The data are representative of five similar experiments.
The purified Cx26 was highly structured, as determined from its infrared spectrum (Fig. 1D). The calculated α-helix content averaged 59 ± 1% for DDM-solubilized Cx26 (n = 20), in reasonable agreement with the recent crystal structure of Cx26 (54% α helix) (35). The calculated percentage of α-helix of reconstituted Cx26 was large but smaller than that of detergent-solubilized Cx26 (43 ± 2%, n = 3, p < 0.05). This difference could indicate that the structure of detergent-solubilized Cx26 is different from that of the protein in a lipid bilayer. However, we are not certain about the significance of this result because there are no libraries of protein standards acquired on an ATR cell, and therefore we had to analyze the ATR-FTIR spectra using a library of spectra acquired on the transmission cell.
To assess the proportion of HCs in the extracellular domains-out orientation, we used a Cx26 with a thrombin cleavage site between the end of the Cx26 sequence and the poly-His tag (Cx26T). Densitometry analysis was employed to determine the change in the signal arising from the His tag, from immunoblots probed with an anti-His tag antibody. Fig. 1E shows that essentially all the His tag signal disappeared when Cx26T solubilized in 0.03% DDM (det) was subjected to thrombin digestion (90 ± 3%, n = 4), whereas from the reconstituted Cx26T HC data (lipo), we estimated that 51 ± 2% of the HCs were in the extracellular domains-out orientation (n = 4).
Permeability of Cx26 Hemichannels to Large Solutes
In the previous section, we showed that the hydrodynamic properties of Cx26 purified from insect cells are consistent with the presence of HCs. Here, we performed functional studies to determine whether the reconstituted Cx26 has permeability properties that resemble those of Cx26 HCs. First, we determined whether reconstituted Cx26 HCs were permeable to sucrose using the transport-specific fractionation technique developed by Harris and co-workers (32, 33) to separate sucrose-permeable from sucrose-impermeable liposomes (31). The method is based on the migration of liposomes upon centrifugation in a linear iso-osmolar sucrose gradient, with [sucrose] increasing from top to bottom, and a reversed urea gradient to maintain the osmolarity constant. The liposomes remain in the upper part of the tube, because the denser lipid is buoyed up by the entrapped urea solution of lower density. The heavier, sucrose-loaded liposomes containing sucrose-permeable HCs migrate as a narrow band to a lower position in the tube. Only liposomes containing Cx26 migrated down the gradient, and the fraction of sucrose-permeable liposomes was proportional to the protein to lipid reconstitution ratio (Fig. 2A). Measurement of rhodamine B fluorescence in the gradient fractions allows for quantitation of the proportion of sucrose-permeable and -impermeable liposomes (Fig. 2B). A summary of the sucrose permeability data is shown in Fig. 2C. For a 1/50 (w/w) protein/lipid reconstitution, we estimated the fraction of impermeable liposomes at 23 ± 4% (n = 6), which can be explained by an average of 1.5 functional HCs per liposome, as calculated from the Poisson distribution. All of the transport assays described below were performed using a 1/100 (w/w) protein/lipid reconstitution, where <5% of the liposomes are expected to contain more than one functional HC.
FIGURE 2.

Permeability of purified and reconstituted Cx26 HCs to sucrose and fluorescent dyes. A, typical migration of liposomes and proteoliposomes containing Cx26 HCs on an iso-osmolar sucrose density gradient. Picture of tubes after centrifugation showing liposomes without HCs (upper bands, upper arrow) and proteoliposomes with functional HCs (lower band, lower arrow). The fractions denote lipid:protein ratios (w/w) used for reconstitution. The color of the liposomes is due to traces of phosphatidylethanolamine labeled with lissamine rhodamine B. B, fluorescence from rhodamine B-labeled lipids measured in equal volume fractions collected from the top to the bottom of the liposomes (No Cx26) and proteoliposomes (Cx26, 1:50 reconstitution) gradients in A. Rhodamine B fluorescence was normalized to the total fluorescence. C, summary of the sucrose permeability data. The calculations are from results like those in B. The fluorescence from the fraction with the proteoliposome (Cx26) peak was divided by that of the fraction with the liposome (No Cx26) peak, and the data are presented as the means ± S.E. (n = 5). The asterisk denotes p < 0.01 compared with No Cx26. D, permeability to Alexa Fluor probes. Absorbance at 280 nm (A280) from a typical size exclusion chromatogram used to evaluate dye retention inside liposomes. The liposomes were loaded with AF350 or AF647 and were run on the size exclusion column to separate free extraliposomal dyes from dyes retained inside the liposomes. Inset, AF350 and AF647 fluorescence associated with liposomes. The data were normalized to the peak emission of parallel experiments with liposomes without Cx26. E, summary of the dye permeability data. We normalized the dye fluorescence to the amount of liposomes (using A280 or rhodamine B fluorescence) and expressed the data as the means ± S.E. relative to the liposome values (n = 5 for AF350; n = 3 for AF647). The asterisk denotes p < 0.001 compared with the liposome values.
Second, we evaluated the permeability of Cx26 HCs to other molecules. Based on available information in cells (1), we expect purified and reconstituted Cx26 HCs to be permeable to AF350 (349 Da molecular mass) but not to AF647 (1,300 Da molecular mass, respectively). To determine which dyes were permeable through Cx26 HCs, we loaded the probes into the liposomes, and their association with the liposomes was determined after separation by size exclusion chromatography. The typical size exclusion chromatogram in Fig. 2D shows that the liposomes can be easily separated from the extraliposomal free dyes (A280 trace). This allows for quantitation of liposome-associated dyes with minimal background from extraliposomal dyes. AF350 and AF647 were retained by the liposomes without HCs, whereas only AF647 was fully retained inside the proteoliposomes containing Cx26 HCs (Fig. 2, D and E). In similar experiments, we loaded the liposomes with ATP and determined the nucleotide retained inside the liposomes after size exclusion chromatography in an ATP-free buffer to remove extraliposomal ATP. The results in Fig. 3 show that ATP also permeates through purified Cx26 HCs.
FIGURE 3.
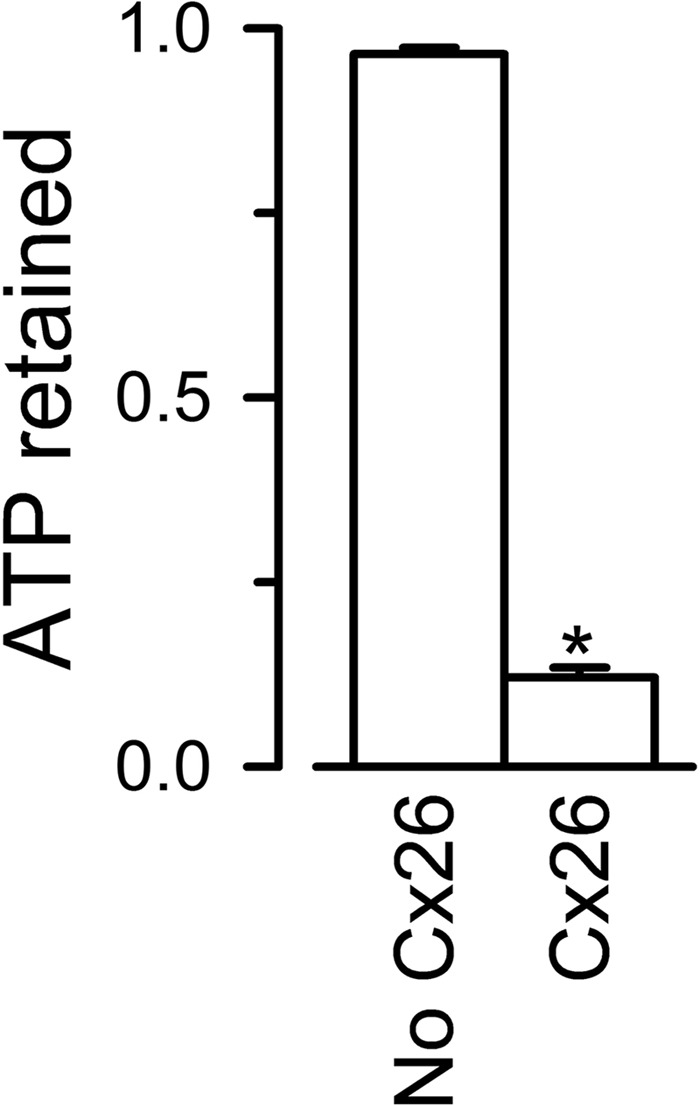
Permeability of purified Cx26 HCs to ATP. Liposomes and Cx26 proteoliposomes loaded with 1 mm ATP were run on the size exclusion column to separate free extraliposomal ATP from ATP retained inside. ATP retained was measured by luminescence using a luciferin/luciferase assay, as the difference between total ATP (inside plus outside, measured after the addition of Triton X-100 to 0.4%) and extraliposomal ATP (before Triton X-100). The data are expressed as the means ± S.E. (n = 3, two different purifications) of the ATP retained/total counts. The asterisk denotes p < 0.001 compared with the liposome values.
Permeability of Cx26 Hemichannels to Ca2+
As mentioned in the introduction, there is indirect evidence for Ca2+ permeability through HCs (1, 13, 14, 18, 20, 30). To directly demonstrate Ca2+ permeation through Cx26 HCs, we determined Ca2+ influx into liposomes containing purified and reconstituted HCs. For these assays, we loaded the liposomes with the low affinity Ca2+-sensitive fluorescent probe Fluo-5N and then removed most of the extraliposomal probe by gel filtration. As expected from its molecular mass (958 Da), Fluo-5N was retained inside the liposomes independently of the presence or absence of Cx26 HCs. Fig. 4A shows the changes in Fluo-5N fluorescence in response to increasing [Ca2+] in a cuvette containing a liposome suspension. An increase in fluorescence was clearly apparent in the liposomes containing Cx26 HCs (red trace) but not into those without HCs (black trace). The addition of Ca2+ produced a fast (mixing-limited) increase in fluorescence that is likely due to binding of Ca2+ to traces of extraliposomal Fluo-5N remaining after the gel filtration. We ascribe the subsequent slower increase in fluorescence, observed only in the proteoliposomes (red trace), to influx of Ca2+ through Cx26 HCs. Near the end of the experiments, the addition of the Ca2+ ionophore ionomycin (1 μm) increased intraliposomal [Ca2+] to similar values in liposomes and proteoliposomes. The increase in Fluo-5N fluorescence elicited by Ca2+ was reversed by the addition of EGTA (Fig. 4B). This is likely the result of the combination of Ca2+ efflux from the liposomes and EGTA influx into the liposomes. A summary of the data is presented in Fig. 4C.
FIGURE 4.

Permeability of purified Cx26 HCs to Ca2+. A, Ca2+ influx into liposomes containing purified Cx26 HCs. The red trace (Cx26) corresponds to proteoliposomes with Fluo-5N trapped inside, where intra- and extraliposomal Ca2+ proceeded to near equilibration upon increasing outside free [Ca2+] from <10 nm to 500 μm (Ca2+ arrow). The black trace corresponds to liposomes without Cx26 (No Cx26). The Ca2+ ionophore ionomycin (1 μm) was added at the labeled arrow to increase intraliposomal [Ca2+] to similar values in liposomes and proteoliposomes. The data were normalized to the fluorescence after addition of ionomycin. B, reversible changes in Fluo-5N fluorescence elicited by sequential additions of Ca2+ and EGTA to Cx26 proteoliposomes. First arrow, addition of 600 μm CaCl2; second arrow, addition of 500 μm EGTA; third arrow, addition of 1 mm CaCl2. C, summary of near steady-state Ca2+ influx data. The values were normalized to the fluorescence in the presence of ionomycin. D, rate of Ca2+ influx into liposomes containing purified Cx26 HCs. Red trace (Cx26, 500 μm [Ca2+]), proteoliposomes exposed to a 500 μm [Ca2+] gradient; blue trace (No Cx26, 500 μm [Ca2+]), liposomes exposed to a 500 μm [Ca2+] gradient. Records from Cx26 proteoliposomes or liposomes in the absence of [Ca2+] gradient were indistinguishable and did not show a change in fluorescence (similar to the blue trace). The black line is a multiexponential fit to the data.
The rate of increase in Fluo-5N emission from experiments like those in Fig. 4A is not accurate because mixing was done manually. This problem was addressed by performing similar experiments on a stop-flow rapid mixing device. In these experiments, complete mixing occurs in <0.5 ms, and changes in fluorescence after mixing can be followed accurately. Because the rapid changes caused by binding of Ca2+ to extraliposomal Fluo-5N (Fig. 4A, black trace) occur in <0.5 ms, they become part of the base line, and only subsequent slower changes are detected. Typical records of fast mixing experiments are shown in Fig. 4D, where an increase in Fluo-5N emission was observed upon increasing free [Ca2+] from <10 nm to 500 μm only in the proteoliposomes (red trace). Increasing [Ca2+] in liposomes did not elicit net Ca2+ influx (blue trace). A multiexponential function was necessary to fit the increase in Fluo-5N emission in proteoliposomes (red trace), and we used the faster rate constant to calculate the rate of increase in intraliposomal [Ca2+] (Table 1).
TABLE 1.
Relative H+, Na+, and Ca2+ permeabilities of liposomes containing Cx26 HCs
The data are presented as the means ± S.E., and n is the number of measurements. ΔCx/s is the initial rate of increase in intraliposomal concentration of ion x (first 10 ms). Normalized ΔCx/s is the rate of change in ion x concentration normalized for a 1 mm concentration gradient. The relative permeabilities were calculated from the normalized rates.
| H+ equivalents | Na+ | Ca2+ | |
|---|---|---|---|
| ΔCx/s (in mm s−1) | 222 ± 15 | 35 ± 7 | 1.9 ± 0.3 |
| Normalized ΔCx/s (in s−1) | 19 ± 1a | 2.4 ± 0.5 | 3.8 ± 0.6b |
| Relative permeability | 7.9 | 1 | 1.7 |
| n | 17 from 6 experiments | 39 from 6 experiments | 68 from 20 experiments |
a p < 0.001 compared with the Na+ value.
b Not statistically different compared with the Na+ value.
To assess Ca2+ permeability relative to other ions, we determined the rates of increase in [Na+] and [protonated HEPES] (transport of H+ equivalents) in response to Na+ and pH gradients across the liposome bilayer. The basic principle of the Na+ transport experiments was the same as that of the Ca2+ transport experiments described earlier, using the Na+-sensitive probe SBFI instead of Fluo-5N. The liposomes loaded with SBFI (∼907 Da) were made in a nominally Na+-free buffer (NMDG). Typical records in response to a rapid increase in extraliposomal [Na+] from zero to 15 mm are shown in Fig. 5A. Consistent with the Ca2+ data, an increase in SBFI fluorescence was observed only in the proteoliposomes exposed to a [Na+] gradient (red trace). The rate of increase in intraliposomal [Na+] was computed essentially as described for the Ca2+ experiments (see “Experimental Procedures”).
FIGURE 5.
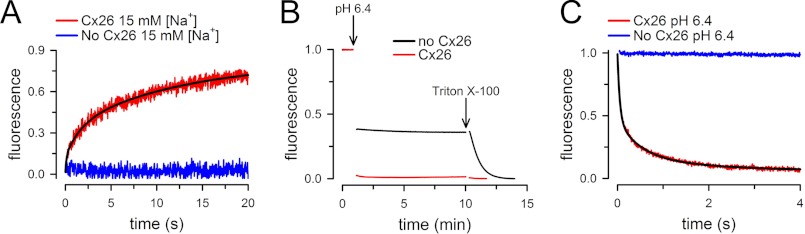
Permeability of purified Cx26 HCs to Na+ and H+. A, Na+ influx into liposomes assessed with the sodium-sensitive fluorescent probe SBFI trapped inside. Red trace (Cx26, 15 mm [Na+]), proteoliposomes exposed to 15 mm external [Na+]; blue trace (No Cx26, 15 mm [Na+]), liposomes exposed to 15 mm external [Na+]. Records from Cx26 proteoliposomes or liposomes in the absence of external Na+ did not show a change in fluorescence (similar to the blue trace). B, pH changes in liposomes containing the pH-sensitive probe fluorescein attached to a phospholipid head group. Red trace, Cx26 proteoliposomes; blue trace (No Cx26), liposomes. At the arrow labeled pH 6.4, extraliposomal pH was reduced from 7.6 to 6.4 by addition of HCl. At the arrow labeled Triton X-100, the detergent was added to a concentration of 0.1%. C, rate of pH change in Cx26 proteoliposomes. Red trace (Cx26, pH 6.4), proteoliposomes exposed to a pH decrease from 7.6 to 6.4; black trace (No Cx26, pH 6.4), liposomes exposed to a pH decrease from 7.6 to 6.4. Records from Cx26 proteoliposomes or liposomes in the absence of pH gradient did not show a change in fluorescence (similar to the blue trace). The black lines are multiexponential fits to the data.
H+ transport was evaluated in liposomes containing traces of a phospholipid labeled with fluorescein at the head group. In pilot experiments in a fluorometer (Fig. 5B), lowering pH produced a rapid decrease (mixing limited) in fluorescence in both liposomes (black trace) and proteoliposomes containing Cx26 HCs (red trace); the decrease in fluorescence was approximately twice in the proteoliposomes but reached similar levels after liposome permeabilization with Triton X-100. We interpret these results as being due to quenching of fluorescence from fluorescein bound to the outer leaflet, similar in liposomes and proteoliposomes (∼50% of the total), and inner leaflet, only in the proteoliposomes following H+ permeation through the HCs. To assess the H+ transport more quantitatively, we performed rapid mixing experiments in a stop-flow cell. Fig. 5C shows that lowering pH from 7.6 to 6.4 produced a rapid decrease in fluorescein emission, only in the proteoliposomes exposed to the pH gradient (red trace). The fluorescence decreased linearly with pH in the range of our experiments, and from the fluorescence time courses, we calculated a decrease in intraliposomal pH from 7.60 to 7.45 ± 0.01 in 10 ms (n = 17 from six independent experiments). We then calculated the protonated [HEPES] from the Henderson-Hasselbalch equation, using a pKa of 7.55, and calculated the rates in Table 1 from the differences in protonated [HEPES].
Millimolar extraliposomal [Ca2+] at the time of decreasing pH to 6.4 prevented pH equilibration. When [Ca2+] was increased to 5 or 10 mm, intraliposomal pH never reached the final pH of 6.4 during the 20 s of the experiment. The pH remained at 6.91 ± 0.05 (n = 15 from three independent experiments) and 7.19 ± 0.09 (n = 4 in 1 experiment) for 5 and 10 mm [Ca2+], respectively. These results were expected from the known inhibitory effect of millimolar [Ca2+] on HCs. A summary of the calculated rates of change in intraliposomal concentrations and relative permeabilities is presented in Table 1.
DISCUSSION
Recombinant Cx26 HCs expressed in Sf9 insect cells has been used for structural studies without parallel functional analysis (37–39), with exception of a recent publication focused on single-HC recordings (40). Previous electron microscopy results clearly point to Cx26 purified as HCs (hexamers), as opposed to GJCs (dodecamers) (37–39, 41), and our measurements of hydrodynamic radius by dynamic light scattering and apparent molecular mass by size exclusion chromatography fully agree with that notion.
The purified Cx26 HCs reconstituted in liposomes displayed permeability to Alexa Fluor 350 (349 Da, net charge −1) and sucrose (342 Da, uncharged) but were impermeable to Alexa Fluor 647 (∼1,300 Da, −2 net charge), SBFI (907 Da, −4 net charge), and Fluo-5N (958 Da, −5 net charge). As expected, the purified HCs were also permeable to Na+ and H+ (H+ equivalents). This permeability pattern is as predicted from dye permeability studies in cells (1) and suggests that our purified Cx26 is properly folded in the bilayer, yielding the expected permeability properties: it shows size-selective solute permeability.
The most important findings of the present studies were the direct demonstrations of ATP and Ca2+ permeation through the purified Cx26 HCs. ATP (507 Da; net charge of was approximately −3.75) was permeable through purified Cx26 HCs. This result agrees with previous indirect evidence for ATP permeation through Cx26 HCs in cells (4, 8) and supports the suggested role of HC-mediated ATP secretion by the supporting cells in the control of hearing sensitivity (36). As mentioned in the introduction, a number of indirect studies in cells suggested significant Ca2+ movement through GJCs or HCs (1, 13, 14, 18, 20, 30), but direct demonstration was missing. For this, it is essential to use a purified and reconstituted preparation of HCs where there is no possibility of Ca2+ transport through parallel unidentified pathways. Our results support previous interpretations that suggested a role of Ca2+ fluxes through GJCs and HCs in physiological and pathophysiological conditions (17, 21, 25–28).
Ca2+ permeability is relatively high, similar to that for Na+. In a previous study, the relative K+/cAMP and K+/Lucifer yellow permeability ratios were estimated at ∼40 and 230, respectively (7), which is not surprising because cAMP and Lucifer yellow are larger than atomic ions. In this context, it is likely that permeability of Cx26 HCs to HEPES is lower than that to Na+, and therefore the high permeability to H+ equivalents is likely to reflect a high H+/Na+ permeability ratio.
Even though the Ca2+ permeability is high, cell to cell Ca2+ fluxes may not be physiologically important because cytosolic [Ca2+] and the cell-to-cell concentration gradients are low. Therefore, significant cell-to-cell Ca2+ fluxes via GJCs depend critically on the number of open permeable channels.
Although most cells have fewer HCs than GJCs at the plasma membrane, the much higher extracellular [Ca2+] suggests that HCs can have a significant role in Ca2+ influx, at least under certain circumstances (17, 21, 25–28) or in disease-causing mutants that display higher Ca2+ permeability (G45E mutant associated with keratitis ichthyosis deafness syndrome) (29). In summary, our results showed that Cx26 HCs are permeable to Ca2+ and suggest that HCs can be a pathway for Ca2+ influx into cells under conditions such as ischemia.
Acknowledgment
We thank Seung Hee for technical assistance.
This work was supported, in whole or in part, by National Institutes of Health Grants R01GM79629 and 3R01GM079629–03S1. This work was also supported by a grant from the Center of Membrane Protein Research, and Programa MECE 2 Educación Superior, Projecto UVA 0603, and Consejo Nacional de Investigación Cientifíca y Tecnológica grants 21090112 and ACT71.
- GJC
- gap junctional channel
- AF350
- Alexa Fluor 350
- AF647
- Alexa Fluor 647
- DDM
- n-dodecyl-β-d-maltoside
- Cx26
- connexin 26 or Cx26 with a C-terminal poly-His tag
- Cx26T
- Cx26 with a thrombin cleavage site between the connexin sequence and the His tag
- DHPE-Fl
- N-(fluorescein-5-thiocarbamoyl)-1,2-dihexadecanoyl-sn-glycero-3-phosphoethanolamine
- HC
- hemichannel
- IP3
- inositol 1,4,5-trisphosphate
- NMDG
- N-methyl-d-glucamonium
- PC
- phosphatidylcholine
- PE-R
- lissamine rhodamine B-labeled phosphatidylethanolamine
- PS
- phosphatidylserine
- SBFI
- 1,3-benzenedicarboxylic acid, 4,4′-[1,4,10-trioxa-7,13-diazacyclopentadecane-7,13-diylbis(5-methoxy-6,2-benzofurandiyl)]bis.
REFERENCES
- 1. Harris A. L., Locke D. (2009) Permeability of connexin channels, in Connexins: A Guide (Harris A. L., Locke D., eds.) pp. 165–206, Humana Press, New York [Google Scholar]
- 2. Martínez A. D., Acuña R., Figueroa V., Maripillan J., Nicholson B. (2009) Gap-junction channels dysfunction in deafness and hearing loss. Antioxid. Redox. Signal. 11, 309–322 [DOI] [PMC free article] [PubMed] [Google Scholar]
- 3. Meşe G., Richard G., White T. W. (2007) Gap junctions. Basic structure and function. J. Invest. Dermatol. 127, 2516–2524 [DOI] [PubMed] [Google Scholar]
- 4. Anselmi F., Hernandez V. H., Crispino G., Seydel A., Ortolano S., Roper S. D., Kessaris N., Richardson W., Rickheit G., Filippov M. A., Monyer H., Mammano F. (2008) ATP release through connexin hemichannels and gap junction transfer of second messengers propagate Ca2+ signals across the inner ear. Proc. Natl. Acad. Sci. U.S.A. 105, 18770–18775 [DOI] [PMC free article] [PubMed] [Google Scholar]
- 5. Beltramello M., Piazza V., Bukauskas F. F., Pozzan T., Mammano F. (2005) Impaired permeability to Ins(1,4,5)P3 in a mutant connexin underlies recessive hereditary deafness. Nat. Cell Biol. 7, 63–69 [DOI] [PubMed] [Google Scholar]
- 6. Gossman D. G., Zhao H. B. (2008) Hemichannel-mediated inositol 1,4,5-trisphosphate (IP3) release in the cochlea. A novel mechanism of IP3 intercellular signaling. Cell Commun. Adhes. 15, 305–315 [DOI] [PMC free article] [PubMed] [Google Scholar]
- 7. Kanaporis G., Mese G., Valiuniene L., White T. W., Brink P. R., Valiunas V. (2008) Gap junction channels exhibit connexin-specific permeability to cyclic nucleotides. J. Gen. Physiol. 131, 293–305 [DOI] [PMC free article] [PubMed] [Google Scholar]
- 8. Majumder P., Crispino G., Rodriguez L., Ciubotaru C. D., Anselmi F., Piazza V., Bortolozzi M., Mammano F. (2010) ATP-mediated cell-cell signaling in the organ of Corti. The role of connexin channels. Purinergic. Signal 6, 167–187 [DOI] [PMC free article] [PubMed] [Google Scholar]
- 9. Ayad W. A., Locke D., Koreen I. V., Harris A. L. (2006) Heteromeric, but not homomeric, connexin channels are selectively permeable to inositol phosphates. J. Biol. Chem. 281, 16727–16739 [DOI] [PubMed] [Google Scholar]
- 10. Bevans C. G., Kordel M., Rhee S. K., Harris A. L. (1998) Isoform composition of connexin channels determines selectivity among second messengers and uncharged molecules. J. Biol. Chem. 273, 2808–2816 [DOI] [PubMed] [Google Scholar]
- 11. Weber P. A., Chang H. C., Spaeth K. E., Nitsche J. M., Nicholson B. J. (2004) The permeability of gap junction channels to probes of different size is dependent on connexin composition and permeant-pore affinities. Biophys. J. 87, 958–973 [DOI] [PMC free article] [PubMed] [Google Scholar]
- 12. Boitano S., Dirksen E. R., Sanderson M. J. (1992) Intercellular propagation of calcium waves mediated by inositol trisphosphate. Science 258, 292–295 [DOI] [PubMed] [Google Scholar]
- 13. Christ G. J., Moreno A. P., Melman A., Spray D. C. (1992) Gap junction-mediated intercellular diffusion of Ca2+ in cultured human corporal smooth muscle cells. Am. J. Physiol. 263, C373–C383 [DOI] [PubMed] [Google Scholar]
- 14. Finkbeiner S. (1992) Calcium waves in astrocytes-filling in the gaps. Neuron 8, 1101–1108 [DOI] [PubMed] [Google Scholar]
- 15. Isakson B. E., Ramos S. I., Duling B. R. (2007) Ca2+ and inositol 1,4,5-trisphosphate-mediated signaling across the myoendothelial junction. Circ. Res. 100, 246–254 [DOI] [PubMed] [Google Scholar]
- 16. Leybaert L., Paemeleire K., Strahonja A., Sanderson M. J. (1998) Inositol-trisphosphate-dependent intercellular calcium signaling in and between astrocytes and endothelial cells. Glia 24, 398–407 [PubMed] [Google Scholar]
- 17. Orellana J. A., Sánchez H. A., Schalper K. A., Figueroa V., Sáez J. C. (2012) Regulation of intercellular calcium signaling through calcium interactions with connexin-based channels. Adv. Exp. Med. Biol. 740, 777–794 [DOI] [PubMed] [Google Scholar]
- 18. Sáez J. C., Connor J. A., Spray D. C., Bennett M. V. (1989) Hepatocyte gap junctions are permeable to the second messenger, inositol 1,4,5-trisphosphate, and to calcium ions. Proc. Natl. Acad. Sci. U.S.A. 86, 2708–2712 [DOI] [PMC free article] [PubMed] [Google Scholar]
- 19. Sun J., Ahmad S., Chen S., Tang W., Zhang Y., Chen P., Lin X. (2005) Cochlear gap junctions coassembled from Cx26 and 30 show faster intercellular Ca2+ signaling than homomeric counterparts. Am. J. Physiol. Cell Physiol. 288, C613–C623 [DOI] [PubMed] [Google Scholar]
- 20. Venance L., Stella N., Glowinski J., Giaume C. (1997) Mechanism involved in initiation and propagation of receptor-induced intercellular calcium signaling in cultured rat astrocytes. J. Neurosci. 17, 1981–1992 [DOI] [PMC free article] [PubMed] [Google Scholar]
- 21. Bargiotas P., Monyer H., Schwaninger M. (2009) Hemichannels in cerebral ischemia. Curr. Mol. Med. 9, 186–194 [DOI] [PubMed] [Google Scholar]
- 22. Gómez-Hernández J. M., de Miguel M., Larrosa B., González D., Barrio L. C. (2003) Molecular basis of calcium regulation in connexin-32 hemichannels. Proc. Natl. Acad. Sci. U.S.A. 100, 16030–16035 [DOI] [PMC free article] [PubMed] [Google Scholar]
- 23. Chen Y., Deng Y., Bao X., Reuss L., Altenberg G. A. (2005) Mechanism of the defect in gap-junctional communication by expression of a connexin 26 mutant associated with dominant deafness. FASEB J. 19, 1516–1518 [DOI] [PubMed] [Google Scholar]
- 24. Müller D. J., Hand G. M., Engel A., Sosinsky G. E. (2002) Conformational changes in surface structures of isolated connexin 26 gap junctions. EMBO J. 21, 3598–35607 [DOI] [PMC free article] [PubMed] [Google Scholar]
- 25. Bao X., Altenberg G. A., Reuss L. (2004) Mechanism of regulation of the gap junction protein connexin 43 by protein kinase C-mediated phosphorylation. Am. J. Physiol. Cell Physiol. 286, C647–C654 [DOI] [PubMed] [Google Scholar]
- 26. Orellana J. A., von Bernhardi R., Giaume C., Sáez J. C. (2012) Glial hemichannels and their involvement in aging and neurodegenerative diseases. Rev. Neurosci. 23, 163–177 [DOI] [PubMed] [Google Scholar]
- 27. Schalper K. A., Sánchez H. A., Lee S. C., Altenberg G. A., Nathanson M. H., Sáez J. C. (2010) Connexin 43 hemichannels mediate the Ca2+ influx induced by extracellular alkalinization. Am. J. Physiol. Cell Physiol. 299, C1504–C1515 [DOI] [PMC free article] [PubMed] [Google Scholar]
- 28. Scheckenbach KE, Crespin S, Kwak BR, Chanson M. (2011) Connexin channel-dependent signaling pathways in inflammation. J. Vasc. Res. 48, 91–103 [DOI] [PubMed] [Google Scholar]
- 29. Sánchez H. A., Mese G., Srinivas M., White T. W., Verselis V. K. (2010) Differentially altered Ca2+ regulation and Ca2+ permeability in Cx26 hemichannels formed by the A40V and G45E mutations that cause keratitis ichthyosis deafness syndrome. J. Gen. Physiol. 136, 47–62 [DOI] [PMC free article] [PubMed] [Google Scholar]
- 30. Sánchez H. A., Orellana J. A., Verselis V. K., Sáez J. C. (2009) Metabolic inhibition increases activity of connexin-32 hemichannels permeable to Ca2+ in transfected HeLa cells. Am. J. Physiol. Cell Physiol. 297, C665–C678 [DOI] [PMC free article] [PubMed] [Google Scholar]
- 31. Bao X., Reuss L., Altenberg G. A. (2004) Regulation of purified and reconstituted connexin 43 hemichannels by protein kinase C-mediated phosphorylation of serine 368. J. Biol. Chem. 279, 20058–20066 [DOI] [PubMed] [Google Scholar]
- 32. Harris A. L., Bevans C. G. (2001) in Methods in Molecular Biology: Connexin Methods and Protocols (Bruzzone R., Giaume C., eds) pp. 357–377, Humana Press, Totowa, NJ [Google Scholar]
- 33. Tao L., Harris A. L. (2004) Biochemical requirements for inhibition of Connexin26-containing channels by natural and synthetic taurine analogs. J. Biol. Chem. 279, 38544–38554 [DOI] [PubMed] [Google Scholar]
- 34. Ortega A., Amorós D., García de la Torre J. (2011) Prediction of hydrodynamic and other solution properties of rigid proteins from atomic- and residue-level models. Biophys. J. 101, 892–898 [DOI] [PMC free article] [PubMed] [Google Scholar]
- 35. Maeda S., Nakagawa S., Suga M., Yamashita E., Oshima A., Fujiyoshi Y., Tsukihara T. (2009) Structure of the connexin 26 gap junction channel at 3.5 Å resolution. Nature 458, 597–602 [DOI] [PubMed] [Google Scholar]
- 36. Zhao H. B., Yu N., Fleming C. R. (2005) Gap junctional hemichannel-mediated ATP release and hearing controls in the inner ear. Proc. Natl. Acad. Sci. U.S.A. 102, 18724–18729 [DOI] [PMC free article] [PubMed] [Google Scholar]
- 37. Ambrosi C., Boassa D., Pranskevich J., Smock A., Oshima A., Xu J., Nicholson B. J., Sosinsky G. E. (2010) Analysis of four connexin26 mutant gap junctions and hemichannels reveals variations in hexamer stability. Biophys. J. 98, 1809–1819 [DOI] [PMC free article] [PubMed] [Google Scholar]
- 38. Oshima A., Doi T., Mitsuoka K., Maeda S., Fujiyoshi Y. (2003) Roles of Met-34, Cys-64, and Arg-75 in the assembly of human connexin 26. Implication for key amino acid residues for channel formation and function. J. Biol. Chem. 278, 1807–1816 [DOI] [PubMed] [Google Scholar]
- 39. Stauffer K. A., Kumar N. M., Gilula N. B., Unwin N. (1991) Isolation and purification of gap junction channels. J. Cell Biol. 115, 141–150 [DOI] [PMC free article] [PubMed] [Google Scholar]
- 40. Gassmann O., Kreir M., Ambrosi C., Pranskevich J., Oshima A., Röling C., Sosinsky G., Fertig N., Steinem C. (2009) The M34A mutant of Connexin26 reveals active conductance states in pore-suspending membranes. J. Struct. Biol. 168, 168–176 [DOI] [PMC free article] [PubMed] [Google Scholar]
- 41. Stauffer K. A. (1995) The gap junction proteins β1-connexin (connexin-32) and beta 2-connexin (connexin-26) can form heteromeric hemichannels. J. Biol. Chem. 270, 6768–6772 [PubMed] [Google Scholar]