

Abstract
BACKGROUND AND PURPOSE
MELAS (mitochondrial encephalomyopathy, lactic acidosis and stroke-like episodes) is a mitochondrial disease most usually caused by point mutations in tRNA genes encoded by mitochondrial DNA (mtDNA). Approximately 80% of cases of MELAS syndrome are associated with a m.3243A > G mutation in the MT-TL1 gene, which encodes the mitochondrial tRNALeu (UUR). Currently, no effective treatments are available for this chronic progressive disorder. Treatment strategies in MELAS and other mitochondrial diseases consist of several drugs that diminish the deleterious effects of the abnormal respiratory chain function, reduce the presence of toxic agents or correct deficiencies in essential cofactors.
EXPERIMENTAL APPROACH
We evaluated the effectiveness of some common pharmacological agents that have been utilized in the treatment of MELAS, in yeast, fibroblast and cybrid models of the disease. The yeast model harbouring the A14G mutation in the mitochondrial tRNALeu(UUR) gene, which is equivalent to the A3243G mutation in humans, was used in the initial screening. Next, the most effective drugs that were able to rescue the respiratory deficiency in MELAS yeast mutants were tested in fibroblasts and cybrid models of MELAS disease.
KEY RESULTS
According to our results, supplementation with riboflavin or coenzyme Q10 effectively reversed the respiratory defect in MELAS yeast and improved the pathologic alterations in MELAS fibroblast and cybrid cell models.
CONCLUSIONS AND IMPLICATIONS
Our results indicate that cell models have great potential for screening and validating the effects of novel drug candidates for MELAS treatment and presumably also for other diseases with mitochondrial impairment.
Keywords: coenzyme Q10, riboflavin, mitochondrial disease, MELAS, mitophagy
Introduction
Mitochondrial diseases include a wide spectrum of single or multi-organ, chronic and progressive disorders, with variable clinical manifestations and severity, which result from perturbed mitochondrial oxidative metabolism (Zeviani and Carelli, 2007). Mitochondrial encephalo-myopathy, lactic acidosis and stroke-like episodes (MELAS) syndrome, is one such mitochondrial disorder the physiopathology of which is not fully known yet and for which there is no specific treatment (Sproule and Kaufmann, 2008). MELAS is a polygenetic disorder that has been associated with at least 29 specific point mutations in the mtDNA, but it is most often associated with point mutations in mtDNA genes that encode tRNAs, the most common of which is an A to G transition at nucleotide m.3243 in the mitochondrially encoded tRNA leucine 1 (UUA/G) (MT-TL1) gene, which encodes tRNALeu (UUR) (Goto et al., 1990; Kobayashi et al., 1990; Finsterer, 2007; Sproule and Kaufmann, 2008). The mutation is heteroplasmic in that mutant and wild-type (Wt) mtDNA species coexist in the same cell. While MELAS can be caused by a number of different mutations in the mtDNA, the m.3243A > G mutation can give rise to a variety of different clinical phenotypes as well as MELAS, including isolated sensorineural hearing loss, migraine and diabetes mellitus. The mutation prevents modification of the wobble U base, impairing translation at UUA and UUG codons, resulting in amino acid misincorporation in the mitochondrial translation products (Kirino et al., 2004). In this disease, there is often a general deficiency in mitochondrial protein synthesis, a decrease in mitochondrial respiratory chain (MRC) enzyme activities and severe respiratory chain defects (Chomyn et al., 1992; James et al., 1996).
At least 42% of patients with MELAS syndrome show a decrease in the activity of complex I, followed by 29% reduced complex III activity and 23% with decreased complex IV activity (Santa, 2010). The cause of defective protein synthesis in MELAS cells is unclear; however, several factors may contribute, including: defective mRNA processing, an incorrectly processed transcript slowing protein synthesis by binding unproductively to ribosomes, altered kinetics of tRNALeu(UUR) aminoacylation or incorrect conjugation of amino acids to tRNALeu(UUR) (King et al., 1992; Schon et al., 1992; Levinger et al., 2004; Finsterer, 2007). In the presence of a dysfunctional respiratory chain, the mitochondria are not able to produce sufficient quantities of ATP, which leads to a chronic energy deficient state due to an imbalance between the energy requirements of the cell and the energy available to fuel its normal processes. Ultimately, the energy imbalance causes cellular injury and tissue damage (Hilton, 1995).
Although the m.3243A > G mutation is associated with a variety of phenotypes, some of which are relatively mild, high levels of the mutation in a particular tissue can cause an increased rate of glycolysis, increased lactate production, reduced glucose and pyruvate oxidation, reduced ΔΨm, markedly reduced ATP production, an inbalance in cellular calcium handling with an increased cytosolic calcium load, increased amount of reactive oxygen species (ROS), reduced insulin secretion, premature aging, and dysregulation of genes involved in the metabolism of amino groups and urea synthesis (Crimi et al., 2005; Jahangir Tafrechi et al., 2005; de Andrade et al., 2006). However, it is not completely understood how mtDNA mutations cause cell damage, nor have the compensatory mechanisms activated by the cells to survive been fully elucidated. In a previous study, we reported on how this mutation affects mitochondrial function in primary fibroblast cultures established from two patients harbouring the m.3243A > G mutation (Cotan et al., 2011). Both MRC enzyme activities and coenzyme Q10 (CoQ) levels were significantly reduced in these fibroblasts, and the mitochondrial membrane potential was decreased. Mitochondrial dysfunction was associated with increased oxidative stress, and the activation of mitochondrial permeability transition, which triggered the degradation of impaired mitochondria by mitophagy.
Current drug therapy approaches in mitochondrial diseases such as MELAS mainly include (DiMauro et al., 2006): (i) removal of noxious metabolites or provision of substances to overcome secondary deficiencies (thiamine, carnitine, bicarbonate, uridine, creatine); (ii) bypassing of blocks in the respiratory chain [riboflavin, CoQ, menadione, vitamin C (ascorbic acid), succinate, thiamine, dichloroacetate]; (iii) administration of metabolites and cofactors to improve ATP synthesis (carnitine, pyruvate, vitamin E, CoQ); (iv) prevention of oxidative stress (vitamin E, ascorbate, retinol, menadione, CoQ, MitoQ, glutathione, lipoic acid, carnitine); (v) increasing mitochondrial biogenesis (resveratrol); (vi) increasing autophagy activity (lithium), and (vii) in the case of MELAS, prevention of stroke-like episodes by the provision of L-arginine, a nitric oxide provider (Koga et al., 2010).
In this study, we initially used a strain of Saccharomyces cerevisiae harbouring the A14G mutation equivalent to the human m.3243A > G mutation as a cell model in the search for effective drugs for the treatment of the disease (Feuermann et al., 2003; Montanari et al., 2008).
The A14G mutation in yeast produces severe respiratory deficiencies, which can be determined by the presence of petites colonies. Yeast carriers of this mutation are unable to grow in respiratory medium with glycerol as a carbon source, so that the effect of drugs on the cultures can easily be evaluated by simply measuring the optical density. Subsequently, the drugs most efficient at restoring the respiratory defect in the mutant yeast were tested in patient-derived fibroblast and cybrid models of MELAS to confirm the effectiveness of the treatment for improving cellular pathophysiological alterations.
Methods
Reagents
We purchased the following antibodies and chemicals: emetine, chloramphenicol, carbonyl cyanide 4-(trifluoromethoxy) phenyl hydrazone (FCCP), CoQ, vitamin C, menadione, riboflavin, thiamine, creatine, uridine, carnitine, vitamin E, lipoic acid, lithium and resveratrol, and anti-porin antibodies were purchased from Sigma-Aldrich (St. Louis, MO, USA). Monoclonal anti-actin antibody and trypsin-EDTA solution from Sigma-Aldrich; monoclonal antibodies specific for oxidative phosphorylation proteins, Mitosox™, 10-N-nonyl acridine orange, MitoTracker, LysoTracker, 4′,6-diamidino-2-phenylindole (DAPI), Hoechst 3342 from Invitrogen/Molecular Probes (Eugene, OR, USA); anti-cytochrome c antiobodies from BD Biosciences Pharmingen (San Jose, CA, USA). Anti- glyceraldehyde-3-phosphate dehydrogenase monoclonal antibody, clone 6C5 from Calbiochem-Merck Chemicals Ltd. (Nottingham, UK); anti-hATG12 and anti-hATG5 from Biosensis (South Australia, Australia); anti-MAP LC3 (N-20) from Santa Cruz Biotechnology (Santa Cruz, CA, USA); a cocktail of protease inhibitors from Boehringer Mannheim (Indianapolis, IN, USA); and Immun Star HRP substrate kit from Bio-Rad Laboratories Inc. (Hercules, CA, USA). All other chemicals were purchased from Sigma-Aldrich.
Yeast cultures and treatments
Two strains of S. cerevisiae were utilized: the Wt strain MCC123 (Mat α, ade2-1, ura3–52, kar1-1) used as a control and the isogenic mutant harbouring the A14G mutation equivalent to the A3243G mutation in the mitochondrial tRNALeu(UUR) gene responsible for MELAS in humans. The A14G mutation was introduced by a biolistic protocol as described in Feuermann et al. (2003) and subsequentially transferred by cytoductant crosses in the MCC123 (rho°) strain (Montanari et al., 2008). Both strains harbour the ade2 mutation that confers adenine auxotrophy and enabled us to distinguish colonies with functional mitochondria (which accumulate an intermediate red pigment of the adenine biosynthesis pathway) from colonies with dysfunctional mitochondria, which appeared white and of small size (Kim et al., 2002). Mutant is indicated by their mutation type and position, according to the standard tRNA numbering referring to yeast cytoplasmic tRNAPhe (Sprinzl et al., 1998). The location of the yeast mitochondrial tRNAleu(UUR) gene is between the tRNAHis and the tRNAGln at about 3000bp (standard numbering of the yeast mitochondrial genome beginning from the 21S rRNA).
Yeasts were grown on complete medium (1% yeast extract and 1% peptone from Difco, BD, Madrid, Spain) containing 2% glucose [yeast extract peptone dextrose medium (YPD)] or 3% glycerol [yeast extract peptone glycerol medium (YPG)]. Media were solidified with 1.5% agar. The production of rho−/rho° colonies in yeast gives an indication of the severity of the defects of mitochondrial protein synthesis and was monitored as follows: a large colony grown on glucose plate was inoculated in the same liquid medium. After an overnight growth, the culture was diluted and plated on glucose, and large and small colonies were counted. To discriminate between rho− and rho° colonies, DAPI staining was performed. In all of the cases examined, colonies with a small size unable to grow on glycerol were found by DAPI staining to be devoid of mtDNA.
To carry out the treatment assays, cells were collected from fresh large rho+ colonies grown in a YPD plate and transferred to 5 mL of respiratory medium (YPG) in order to obtain 0.5 optical density (OD) using a Varian Cary 50 Bio UV-Visible Spectrophotometer (Agilent Technologies Spain, Madrid, Spain). After 3 h incubation at 28°C in liquid medium we monitored the presence of mtDNA by DAPI staining and we collected respiratory data only when the culture contained at least 70–80% of stained cells.
Then, yeasts cultures were distributed in 96-well plates. Briefly, in the yeast screening study, the MELAS strain of yeast was exposed to four concentrations of common drugs used for the treatment of mitochondrial diseases (Table 1). All the wells of each plate contained a single strain of yeast, and all strains were exposed simultaneously on six separate plates to the same molar concentration. After a 24 h incubation, the OD in each well was measured as an indicator of cell growth. Each plate configuration was replicated four times on YPG. The average of the four replicate responses was normalized to the responses of free media not inoculated with cells. Control wells were located on the same plate. Yeast growth was evaluated by measuring the OD at 660 nm (OD 660) of the culture after 24 h of pharmacological treatment. The OD reading was performed in 96-well plates with the plate reader POLARstar Omega (BMG LABTECH Inc., Cary, USA).
Table 1.
Pharmacological agents and concentrations used in the yeast counterparts of human MELAS mutation
| Drug | Concentration | Drug | Concentration | ||
|---|---|---|---|---|---|
| Creatine | 30 µM | 100 µM | Carnitine | 2.5 µM | 10 µM |
| 60 µM | 120 µM | 7.5 µM | 12.5 µM | ||
| Thiamine | 10 µM | 30 µM | Riboflavin | 0.02 µM | 0.06 µM |
| 20 µM | 40 µM | 0.04 µM | 0.08 µM | ||
| Vitamin E | 10 µM | 30 µM | Resveratrol | 10 µM | 30 µM |
| 20 µM | 40 µM | 20 µM | 40 µM | ||
| Vitamin C (ascorbic acid) | 2.5 mM | 10 mM | Lithium | 0.30 mM | 1 mM |
| 7.5 mM | 12.5 mM | 0.60 mM | 1.20 mM | ||
| Menadione | 1 µM | 3 µM | Uridine | 2.5 µM | 10 µM |
| 2 µM | 4 µM | 7.5 µM | 12.5 µM | ||
| Lipoic Acid | 2.5 µM | 10 µM | Coenzyme Q10 (CoQ) | 30 µM | 100 µM |
| 7.5 µM | 12.5 µM | 50 µM | 500 µM | ||
The drugs chosen are pharmacological agents frequently utilized in the treatment of mitochondrial diseases. The drug concentrations were chosen on the basis of their cytotoxic effects. For each drug, the highest concentration shown in the table did not impair the replication capacity of Wt yeast.
Fibroblast cultures
Cultured fibroblasts were derived from a skin biopsy of a patient harbouring a heteroplasmic m.3243A > G mutation. Clinically, the patient had MELAS, with encephalomyopathy, stroke-like episodes and lactic acidosis, plus short stature, deafness, diabetes mellitus, dementia and ataxia. The heteroplasmy of the m.3243A > G mutation was 43% in MELAS fibroblasts. We verified that the level of heteroplasmy in MELAS fibroblasts did not change significantly during this study. Control fibroblasts were human skin primary fibroblasts from two healthy volunteers. When indicated in the figure legends, data were shown as a mean of two control fibroblast cultures. Samples from patients and controls were obtained according to the Helsinki Declarations of 1964, as revised in 2001. Fibroblasts from the MELAS patient and controls were cultured at 37°C in DMEM containing 4.5 g·L−1 glucose, L-glutamine, and pyruvate supplemented with an antibiotic/antimycotic solution and 20% FBS.
Construction of transmitochondrial cybrid cell lines
The 143B osteosarcoma cybrid clones were prepared by fusing enucleated fibroblasts from patients or controls with 143B osteosarcoma cells which lack mtDNA (rho° cells), using the method described by King and Attardi (1989). These cells thus possess mtDNA from patients or controls in a control nuclear background. One hundred and forty-three osteosarcoma parental and rho° cells, and control osteosarcoma cybrid cells (100% Wt at nucleotide position 3243) and cybrid cells harbouring the m.3243A > G mutation (90% of the total copy number) were cultured in DMEM containing 4.5 g·L−1 glucose, supplemented with 5% FBS, sodium pyruvate (100 µg·mL−1), uridine (50 µg·mL−1), penicillin (100 IU·mL−1) and streptomycin (100 µg·mL−1). We verified that the level of heteroplasmy in MELAS cybrids did not change significantly during the study.
Measurement of mutant heteroplasmy
To reliably quantify the proportion of the mutant mtDNA, we performed a real-time amplification refractory mutation system quantitative PCR (ARMSqPCR) assay as described previously (Bai and Wong, 2004).
MRC enzyme activities
Activities of NADH, cytochrome c reductase (complexes I + III) and citrate synthase (CS) were determined in sonicated permeabilized fibroblasts using previously described spectrophotometric methods (Rustin et al., 1994; Quinzii et al., 2006). Results are expressed as U per CS (mean ± SD). The protein content of fibroblast homogenates was determined using the Lowry procedure (Lowry et al., 1951).
ATP levels
ATP levels were determined by a bioluminescence assay using an ATP determination kit from Invitrogen-Molecular Probes according to the manufacturer's instructions.
Immunofluorescence microscopy
Fibroblasts were grown on 1 mm width (Goldseal no. 1) glass coverslips for 24–48 h in normal growth medium. Cells were rinsed once with PBS, fixed in 3.8% paraformaldehyde for 5 min at room temperature, and permeabilized with 0.1% saponin for 5 min. For immunostaining, glass coverslips were incubated with primary antibodies diluted 1:100 in PBS. The secondary antibody, a FITC-labelled goat anti-mouse antibody (Calbiochem-Merck Chemicals Ltd) or a tetramethyl rhodamine goat anti-rabbit (Calbiochem-Merck Chemicals Ltd), diluted 1:100 in PBS, was added and the coverslip was incubated for 1 h at 37°C. The coverslips were then rinsed with PBS, incubated for 1 min with PBS containing Hoechst 33342 (1 µg·mL−1) and washed with PBS (3 × 5 min). Finally, the coverslips were mounted onto microscope slides using Vectashield Mounting Medium (Vector Laboratories, Burlingame, CA, USA) and analysed using an upright fluorescence microscope (Leica DMRE, Leica Microsystems GmbH, Wetzlar, Germany). Deconvolution studies and 3D projections were performed using a DeltaVision system (Applied Precision; Issaquah, WA, USA) with an Olympus IX-71 microscope. The deconvolved images were derived from optical sections taken at 30 nm intervals using a 60× PLAPON objective with a 1.42 numerical aperture.
Measurement of intracellular generation of ROS
Mitochondrial superoxide generation in fibroblasts was assessed using MitoSOX Red™, a mitochondrial superoxide indicator, which once inside the mitochondria, is oxidized by superoxide and exhibits red fluorescence. Approximately 1 × 10⁶ cells were incubated with 1 µM MitoSox for 30 min at 37°C, washed twice with PBS and resuspended in 500 µL of PBS and analysed by flow cytometry (excitation at 510 nm and fluorescence detection at 580 nm). The specificity of MitoSOX for superoxide has been shown by the manufacturer, and its mitochondrial localization was tested by co-staining with MitoTracker Green (data not shown). ROS levels were expressed relative to the mitochondrial mass [ROS signal/10-N-nonyl acridine orange (NAO) signal].
Mitochondrial mass
Mitochondrial mass was determined by flow cytometry and fluorescence microscopy after staining the cells with 10 µM NAO for 10 min at 37°C in the dark. NAO specifically binds to cardiolipin and it is used to estimate mitochondrial mass. However, cases have been reported in which NAO fluorescence is dependent upon mitochondrial membrane potential (Jacobson et al., 2002). To determine whether NAO mitochondrial binding was dependent on mitochondrial membrane potential, NAO fluorescence was measured in the absence and presence of the uncoupler FCCP (1 µM). No differences in NAO staining were observed between the various mitochondrial membrane potentials.
Immunoblotting
Western blotting was performed using standard methods. After protein transfer, the membrane was incubated with various primary antibodies diluted 1:1000, and then with the corresponding secondary antibody coupled to HRP at a 1:10000 dilution. Specific protein complexes were identified using the Immun Star HRP substrate kit (Bio-Rad Laboratories Inc.).
Loading of LysoTracker Red
LysoTracker (100 nM) was added to cultured fibroblasts. After 30 min, each well was washed twice with fresh DMEM, and fixed with 2% paraformaldehyde in PBS for 10 min at 4°C. The red fluorescence of LysoTracker was quantified by flow cytometry.
Mitochondrial protein synthesis
Mitochondrial protein synthesis in cultured control and MELAS fibroblasts was evaluated essentially as described previously (Bodnar et al., 1995). Confluent 100 mm dishes of control and MELAS fibroblasts were incubated in methionine-free Dulbecco's essential medium containing [35S]- methionine (50 µCi·mL−1, 1217 Ci·mmol−1, PerkinElmer España, Madrid, Spain) for 1 h in the presence of either 100 µg·mL−1 emetine (a cytosolic translation inhibitor) or 100 µg·mL−1 emetine and 200 µg·mL−1 chloramphenicol (a mitochondrial translation inhibitor). The cells were washed with PBS and incubated for 1 h in normal growth medium. Cells were harvested and labelled protein was precipitated by 10% trichloroacetic acid on glass fibre filters, unincorporated [35S]-methionine was removed by extensive washing and incorporation was analysed by liquid scintillation counting. Results are expressed as cpm (cpm in the presence of emetine minus cpm in the presence of emetine plus chloramphenicol) mg-1 protein.
Blue-native PAGE (BN-PAGE) and immunoblotting
Functional pure mitochondria from control and MELAS fibroblast were isolated by a Mitochondria Isolation Kit using magnetic microbeads (Miltenyi Biotec GmbH, Teterow, Germany). Cells were lysed and mitochondria were magnetically labelled with Anti-TOM22 MicroBeads. The monoclonal anti-TOM22 antibody specifically binds to the translocase of outer mitochondrial membrane 22 (TOM22) of human mitochondria. Then, the labelled cell lysate was loaded onto a MACS Column, which was placed in the magnetic field of a MACS Separator. The magnetically-labelled mitochondria are retained within the column. The unlabelled organelles and cell components run through. After removing the column from the magnetic field, the magnetically retained mitochondria can be eluted.
The BN-PAGE system was used for separation of mitochondrial respiratory complexes on 4–16% polyacrylamide-gradient gels; 20 µg of the total solubilized protein were electrophoresed for 90 min at 150 V in NativePAGE™ Running Buffer and NativePAGE™ Cathode Buffer (Invitrogen). Proteins were electrotransferred onto a nitrocellulose membrane for 1 h at 25 V. We used monoclonal antibodies for complex I (39 kDa subunit), complex II (70 kDa subunit), complex III (core 2 subunit), complex IV (COX II subunit) and complex V (αF1F0-ATPase) diluted 1:1000 (Molecular Probes, Invitrogen). An antibody against porin, a housekeeping mitochondrial protein, was used as loading control The secondary antibody was monoclonal anti-mouse IgG horseradish (Amersham Biosciences) diluted 1:1000. Immun Star HRP substrate kit (Bio-Rad Laboratories Inc.) was used to detect the proteins according to the manufacturer's instructions.
Statistical analysis
All results are expressed as mean ± SD of three independent experiments. The measurements were statistically analysed using Student's t-test for comparing two groups and anova for more than two groups. The level of significance was set at P < 0.05.
Results
Effect of pharmacological treatments on the recovery of the respiratory defect in yeast harbouring the MELAS mutation
To test the effects of the selected drugs on respiratory chain activity, we utilized the mutant yeast strain A14G, bearing a mutation equivalent to the homoplasmic human m.3243A > G mutation (Feuermann et al., 2003). While the growth on the respiratory medium YPG was abolished, the mutant yeast were able to proliferate on fermentable medium YPD and produced a high number of rho° or petite colonies (80%; Figure 1A). Figure 1B shows the growth of Wt and the A14G yeast mutant, studied by serial dilutions on glycerol plates at 28°C. Plates were incubated for 3 days and the mutant yeast clearly showed a growth defect.
Figure 1.
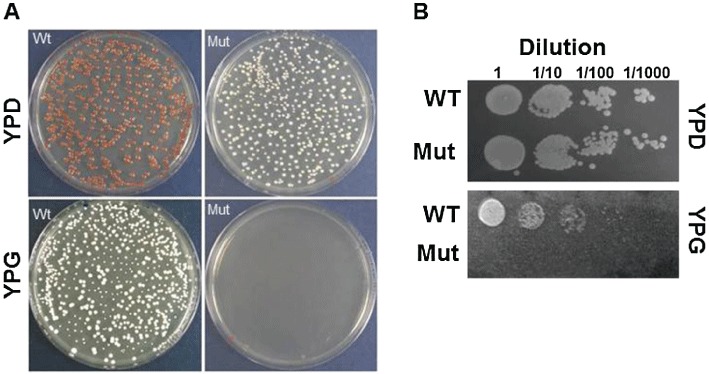
MELAS mutant yeast. (A) The growth of Wt and MELAS mutant yeast (Mut) on YPD and YPG medium. The plates were incubated at 30°C for 2.5 days. (B) The Wt and Mut strains were grown on YPD and YPG at 30°C for 3 days at four dilutions, as indicated.
The yeast mutant was then incubated with the selected reagent (CoQ, vitamin C, menadione, riboflavin, thiamine, creatine, uridine, carnitine, vitamin E, lipoic acid, lithium and resveratrol) at four different concentrations in respiratory medium as detailed in Table 1. After 24 h of incubation, the recovery of the glycerol growth defect was measured by monitoring the optical density of the various cultures. Only CoQ (30–100 µM) and riboflavin (0.06–0.08 µM) were able to significantly rescue the respiratory defect in yeast A14G mutants (Figure 2). CoQ (30–500 µM), riboflavin (0.06–0.8 µM), vitamin E (40 µM) and uridine (2.5–12.5 µM) were also able to increase significantly the growth rate of Wt yeast.
Figure 2.
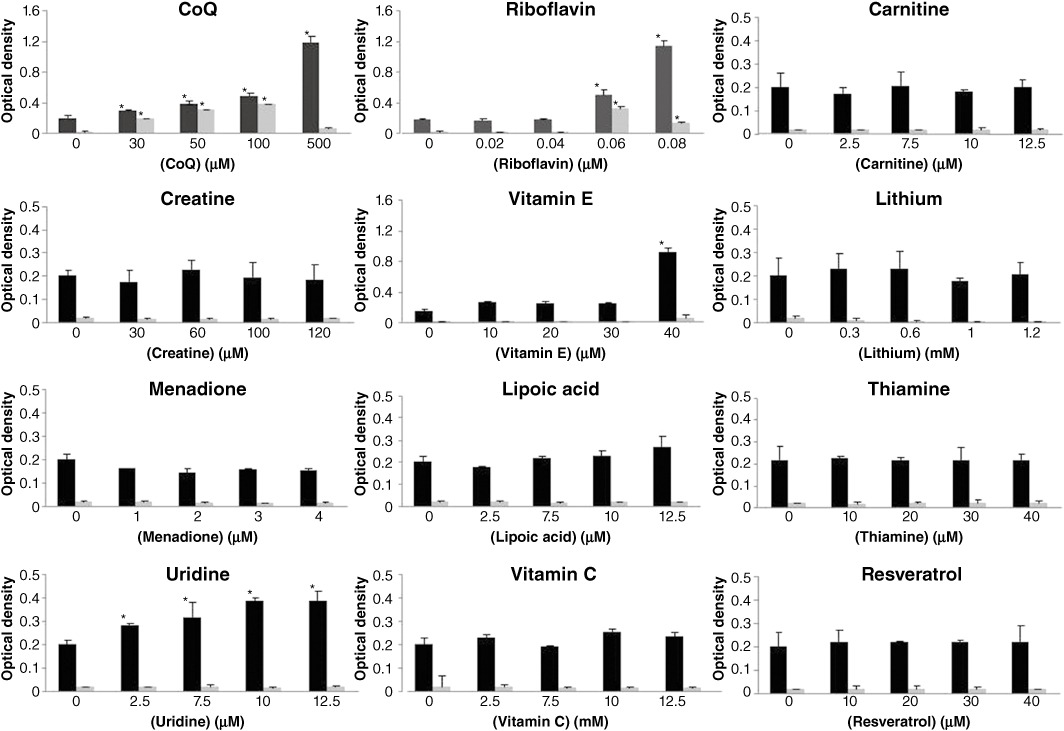
Effect of selected drugs on the growth of MELAS mutant yeast in respiratory medium. Wt (black columns) and MELAS mutant yeasts (grey columns) were transferred to 96-well plates with respiratory medium and treated with CoQ, vitamin C, menadione, riboflavin, thiamine, creatine, uridine, carnitine, vitamin E, lipoic acid, lithium or resveratrol at the indicated concentrations for 24 h, then the plates were read at 660 nm. *P < 0.01 between the presence and absence of treatment.
Effect of CoQ and riboflavin on proliferation of MELAS fibroblasts
Subsequently, we investigated whether both riboflavin and CoQ, the most effective drugs that were able to restore the respiratory defect in mutant yeast, were also able to improve the pathological alterations in fibroblasts derived from a MELAS patient. Control and MELAS fibroblasts were treated with 0.06 µM riboflavin or 100 µM CoQ, the concentrations found to be effective in restoring mutant yeast respiration, for 72 h and the proliferation rate, as an indicator of general cellular well-being, was measured. The proliferation rate of MELAS fibroblasts was reduced compared with the controls, but was significantly increased by the addition of riboflavin or CoQ to the culture medium (Figure 3A). Neither of these agents had a significant effect on the proliferation rate of control fibroblasts (Figure 3A).
Figure 3.
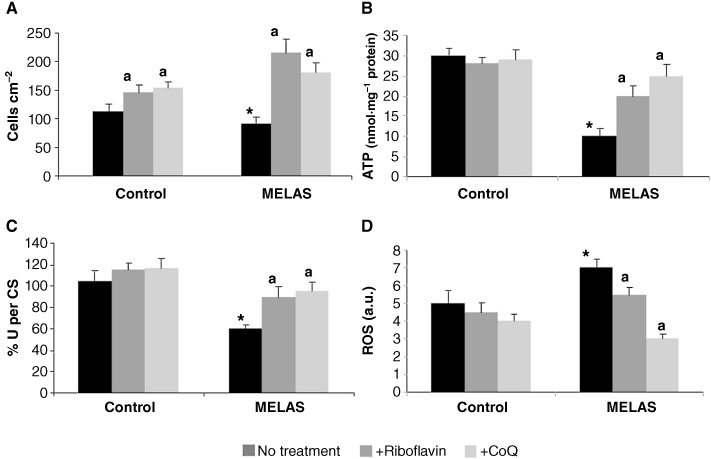
Effect of riboflavin and CoQ on MELAS fibroblasts. (A) Cell proliferation. Control and MELAS fibroblasts were cultured in the absence or presence of riboflavin (0.06 µM) or CoQ (100 µM) for 72 h. Cell counting was performed as described in Methods. (B) ATP levels. ATP levels in control and MELAS fibroblasts grown in the absence or presence of riboflavin or CoQ for 72 h. (C) The combined activity of complexes I + III was determined as described in Methods. Results (mean ± SD) are expressed as U per CS (units per CS). (D) ROS generation in MELAS fibroblasts. Fibroblast cultures from controls and MELAS patients were grown in normal culture medium or in medium supplemented with riboflavin (0.06 µM) or CoQ (100 µM) for 72 h before analysis. ROS levels were then determined by flow cytometry using MitoSox Red, and the mitochondrial mass was estimated using NAO, and the results are expressed as the ratio of MitoSOX signal to NAO signal in arbitrary units (a.u.). For the control cells, the data represent the mean ± SD of three separate experiments on two different cell lines. *P < 0.01 between control and MELAS fibroblasts. aP < 0.01 between the presence and the absence of CoQ.
Bioenergetic status after treatment with riboflavin and CoQ
Mitochondria are the main energy-producing organelles of eukaryotic cells and generate energy in the form of ATP; therefore, it might be expected that cells with defective mtDNA have lower ATP levels. Accordingly, some mutations in the mtDNA have been reported to cause impairment of ATP synthesis (James et al., 1999; Gajewski et al., 2003). To determine whether riboflavin or CoQ had an effect on improving MELAS cellular bioenergetics, we determined their effect on intracellular ATP levels in control and MELAS fibroblasts. Cellular ATP levels were significantly decreased in MELAS fibroblasts (Figure 3B). Treatment with either 0.06 µM riboflavin or 100 µM CoQ caused a significant increase in ATP levels in MELAS fibroblasts (P < 0.001), but was without effect in control fibroblasts (Figure 3B).
MRC activity after CoQ and riboflavin treatment
We measured the combined MRC activity of complexes I + III in control and patient fibroblast cultures; this activity was significantly reduced in the MELAS fibroblasts (Figure 3C). Riboflavin (0.06 µM) or CoQ (100 µM) supplementation restored these values to normal levels in the MELAS fibroblasts culture, but had only a minor effect in the control culture (Figure 3C).
Effect of riboflavin or CoQ on mitochondrial ROS production in MELAS fibroblasts
It is well established that mitochondrial dysfunction is associated with an induction of ROS production in mitochondria. Therefore, we examined superoxide levels in control and MELAS fibroblasts by flow cytometry using MitoSOX™ Red. At the same time, the mitochondrial mass was estimated with NAO, and the ratio of MitoSOX signal to NAO fluorescence was determined. Superoxide production was significantly increased in MELAS fibroblasts (Figure 3D). The inclusion of 0.06 µM riboflavin or 100 µM CoQ in the culture medium had no effect on the levels of superoxide in control cultures, but was associated with a considerable reduction in superoxide levels in MELAS cultures (Figure 3D).
Effect of riboflavin or CoQ supplementation on mitochondrial degradation in MELAS fibroblasts
Recent evidence suggests the possible involvement of ROS in autophagy and in particular, mitophagy (Kim et al., 2007; Scherz-Shouval and Elazar, 2007; 2011). To determine if increased mitochondrial degradation is occurring in MELAS fibroblasts, we first quantified levels of acidic vacuoles by the use of Lysotracker staining coupled with flow cytometry analysis (we assessed that acidic vacuoles were lysosomes by verifying that Lysotracker colocalized with cathepsin D, a lysosomal enzyme: data not shown). There was a significant increase in the amount of acidic vacuoles in MELAS fibroblasts when compared with that in control fibroblasts (Figure 4A). In order to elucidate whether autophagy in MELAS fibroblasts could be attenuated by restoring mitochondrial function via riboflavin or CoQ supplementation, we quantified the amount of acidic vacuoles in patient and control fibroblast cultures following supplementation of the culture medium with 0.06 µM riboflavin or 100 µM CoQ for 72 h. As is shown in Figure 4A, riboflavin or CoQ supplementation was associated with a significant reduction in the intensity of Lysotracker staining in MELAS fibroblasts, indicating that lysosome abundance was reduced following riboflavin or CoQ treatment.
Figure 4.
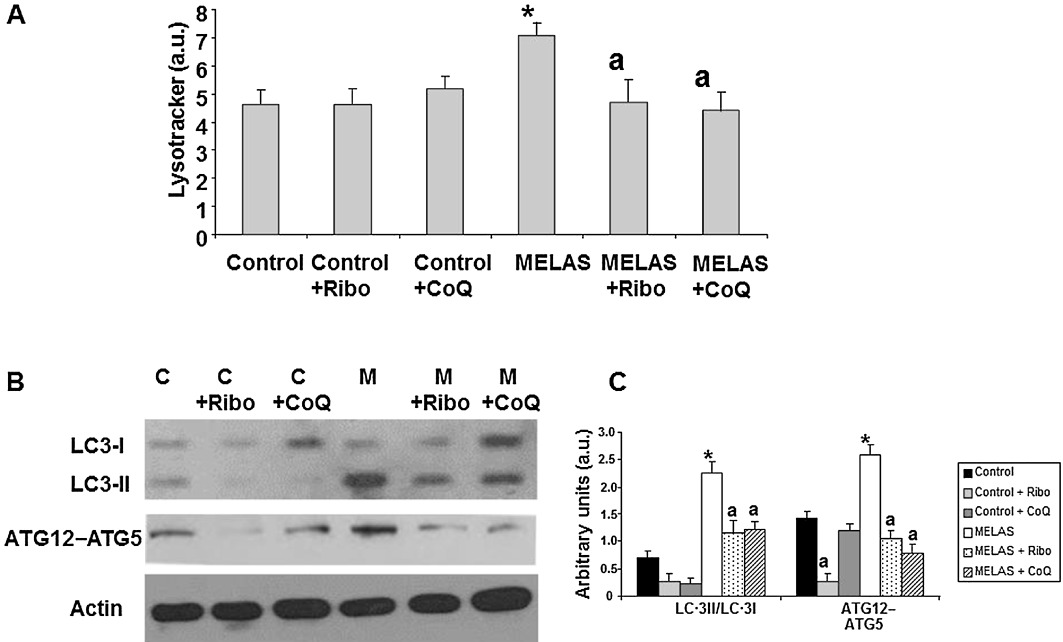
Effect of riboflavin and CoQ on autophagic markers. (A) The quantification of acidic vacuoles in control (C) and MELAS fibroblasts (M) by LysoTracker staining and flow cytometry analysis. Cells were cultured in the presence or absence of 0.06 µM riboflavin (Ribo) or 100 µM CoQ. For the control cells, the data are the mean ± SD of three separate experiments on two different control cell lines. Results are expressed in arbitrary units (a.u). (B) The protein expression levels of LC3-I (upper band) and LC3-II (lower band) and ATG12 determined in control and MELAS fibroblast cultures by Western blotting. The ATG12 band represents the Atg12–Atg5 conjugated form. Control (C) and MELAS fibroblast cultures were grown in normal culture medium or in medium supplemented with 0.06 µM riboflavin (Ribo) or 100 µM CoQ for 72 h. Actin was used as loading control. (C) Densitometry was performed using the ImageJ software. Actin was used as loading control. Data, in arbitrary units (a.u.) represent the mean ± SD of three separate experiments. *P < 0.01 between control and MELAS fibroblasts. aP < 0.01, between the presence and the absence of riboflavin or CoQ.
As a measure of autophagic activity, we also investigated the conversion of LC3-I (microtubule associated light chain 3) to LC3-II, as the amount of the latter is closely correlated with the number of autophagosomes. There was a significant fivefold increase in the amount of LC3-II in the MELAS fibroblast cultures when compared with that in control fibroblasts (Figure 4B and C). This significant increase in LC3-II conversion in MELAS fibroblast cells indicates that autophagosome formation is enhanced in these cells. Supplementation of the culture medium with 0.06 µM riboflavin or 100 µM CoQ resulted in a significant twofold decrease in the levels of LC3-II in these cultures. Additionally, protein levels of ATG12-ATG5 (autophagosome formation involves an ubiquitin-like conjugation system in which Atg12 is covalently bound to Atg5) were also increased in MELAS fibroblasts, but decreased to control levels under riboflavin or CoQ treatment (Figure 4B and C).
To verify the hypothesis that increased mitophagy was occurring in the MELAS fibroblast cultures, we performed double staining immunodetection with antibodies to LC3 and cytochrome c. In the control cultures, tubular mitochondria negative for LC3 staining were observed (Figure 5A and B). In the MELAS fibroblasts, a few normal tubular mitochondria negative for LC3 were identified, along with many small fragmented mitochondria positive for LC3 (colocalization, r= 0.9088) (Figure 5A and B), suggesting autophagosome engulfing of mitochondria. Supplementation of the culture medium for 72 h with 0.06 µM riboflavin or 100 µM CoQ resulted in a drastic reduction of LC3/cytochrome c punctata (Figure 5A and C).
Figure 5.
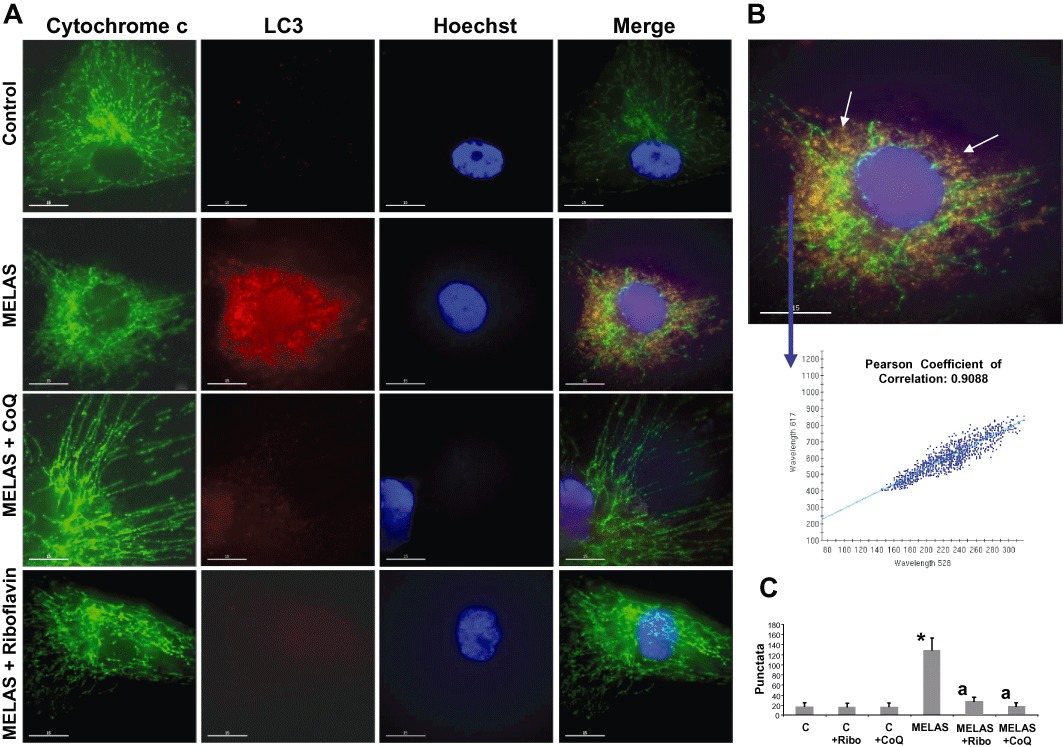
Lysosomal and autophagosome markers in MELAS fibroblasts. (A) Cultured control and MELAS fibroblasts incubated with 0.06 µM riboflavin or 100 µM CoQ were fixed, and immunostained with anti-LC3 (autophagosome marker) and cytochrome c (mitochondrial marker) and examined by fluorescence microscopy. A representative picture of the 100 cells analysed is shown. Colocalization of both markers was assessed by the DeltaVision software. (B) Magnification of a small area of a MELAS fibroblast. Arrows show autophagosomes with LC3 and cytochrome c colocalization. Colocalization of both markers was assessed by DeltaVision software using the Pearson coefficient of correlation. Bar = 5 µm. (C) Quantification of LC3 per cytochrome c puntacta in control and MELAS fibroblasts incubated with 0.06 µM riboflavin or 100 µM CoQ (n= 100 cells). *P < 0.01 between control and MELAS fibroblasts. aP < 0.01, between the presence and the absence of CoQ.
We next investigated the effect of riboflavin and CoQ supplementation on the expression levels of the 30 kDa subunit of complex I (nuclear encoded), the 30 Kda subunit of complex II (nuclear encoded), the core I subunit of complex III (nuclear encoded) and the COX II subunit of complex IV (mtDNA encoded) of the MRC. The expression levels of these proteins, both nuclear and mtDNA encoded, were significantly reduced in MELAS fibroblasts compared with controls, but increased to control or near control levels when MELAS fibroblasts were grown in the presence of 0.06 µM riboflavin or 100 µM CoQ (Figure 6A and B).
Figure 6.
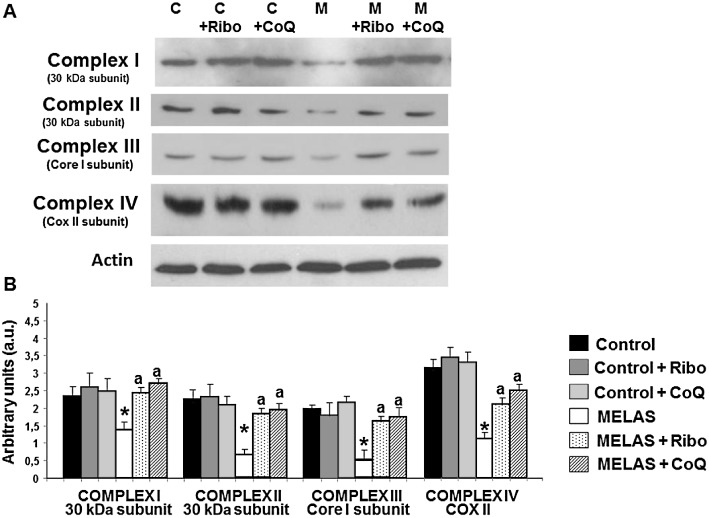
Mitochondrial protein expression levels in MELAS fibroblasts. (A) Western blot analysis of MRC proteins – complex I (30 kDa subunit), complex II (30 kDa subunit), complex III (core 1 subunit), complex IV (COX II subunit) – of control (C) and MELAS (M) fibroblasts incubated with 0.06 µM riboflavin (Ribo) or 100 µM CoQ for 72 h. Fibroblast protein extracts (50 µg) were separated on a 12.5% SDS polyacrylamide gel. Actin was used as loading control. (B) Densitometry of Western blotting was performed using ImageJ software. Data in arbitrary units (a.u.) represent the mean ± SD of three separate experiments. *P < 0.01 between control and MELAS fibroblasts. aP < 0.01, between the presence and the absence of riboflavin or CoQ.
Effect of riboflavin or CoQ supplementation on mitochondrial protein synthesis and respiratory complexes assembly in MELAS fibroblasts
To investigate the specific defect in mitochondrial protein synthesis caused by the A3243G mutation, MELAS fibroblasts were pulse-labelled with a mixture of [35S]-methionine in the presence of emetine, an inhibitor of cytoplasmic translation. The overall rate of protein synthesis in mitochondria of MELAS fibroblasts was 29% of control as measured by the total incorporation of the radioactive label (Figure 7A). Supplementation of the culture medium for 72 h with 0.06 µM riboflavin or 100 µM CoQ resulted in a significant increase in mitochondrial protein synthesis in MELAS fibroblasts that was restored to control or near control fibroblasts values (Figure 7A). Riboflavin or CoQ supplementation also increased slightly mitochondrial protein synthesis in control fibroblasts (Figure 7A).
Figure 7.
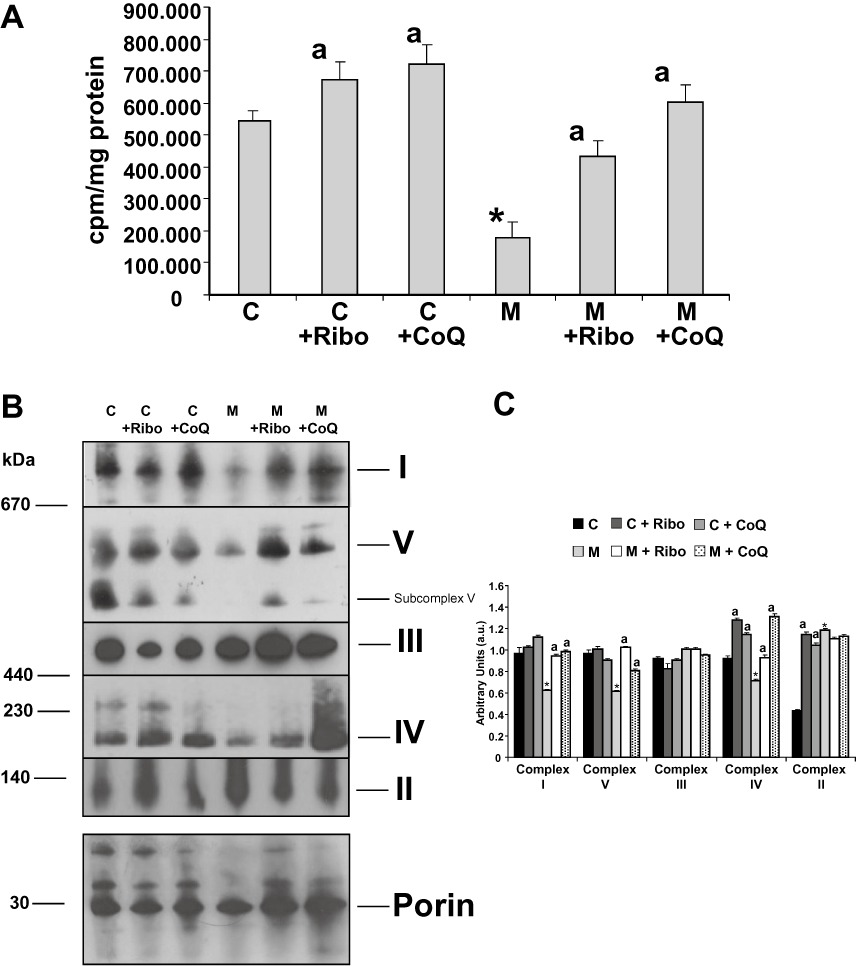
Mitochondrial protein synthesis and assembly of mitochondrial complexes. (A) Incorporation of [35S]-methionine into mitochondrial proteins. Control (C) and MELAS (M) fibroblasts supplemented with or without 0.06 µM riboflavin (Ribo) or 100 µM CoQ for 72 h were incubated with [35S]-methionine for 1 h in the presence of 100 µg mL−1 emetine or emetine plus 200 µg·mL−1 chloramphenicol. [35S]-methionine incorporation into mitochondrial proteins was measured by liquid scintillation counting. Results are expressed as cpm (cpm in the presence of emetine minus cpm in the presence of emetine plus chloramphenicol) mg-1of protein. Data represent the mean ± SD of three separate experiments. *P < 0.01 between control and MELAS fibroblasts. aP < 0.01, between the presence and the absence of riboflavin or CoQ. (B) Suppression of the defect in assembly of oxidative phosphorylation complexes in MELAS fibroblasts under riboflavin or COQ supplementation. Intact mitochondria from control (C) and MELAS (M) fibroblasts with or without 0.06 µM riboflavin (Ribo) or 100 µM CoQ supplementation for 72 h were analysed by BN-PAGE. The blots were incubated with antibodies against specific subunits of each of the five mitochondrial complexes (I–V). An antibody against porin, housekeeping mitochondrial protein, was used as loading control. ‘Subcomplex V’ indicates the presence of partially assembled complexes V in MELAS patients. (C) Densitometry of mitochondrial complexes signal normalized by porin was performed using ImageJ software. Data in arbitrary units (a.u.) represent the mean ± SD of two blots. *P < 0.01 between control and MELAS fibroblasts. aP < 0.01, between the presence and the absence of riboflavin or CoQ.
As in MELAS fibroblasts there are two mitochondrial populations, one of intact mitochondria and the other of mitochondria engulfed by autophagosomes, the evaluation of mitochondrial respiratory complexes assembly in control and MELAS fibroblasts was performed in intact mitochondria isolated by magnetically labelling them with anti-TOM22 (translocase of outer mitochondrial membrane 22) microbeads and magnetic separation. This method isolates intact mitochondria and, contrary to whole cell lysate analysis, avoids the influence of mitophagy on the evaluation of mitochondrial complexes assembly. Mitochondria isolated by this procedure did not show detectable autophagosome markers indicating that the analysis was performed on the fraction of functional intact mitochondria (data not shown).
Analysis of mitochondrial respiratory complexes by BN-PAGE revealed an almost complete absence of fully assembled complex I in MELAS fibroblasts, only trace amounts of fully assembled complexes IV and V, and normal levels of complex III (Figure 7B). As expected, complex II, which has four subunits entirely encoded by nuclear genes, was increased in MELAS intact mitochondria. Supplementation of the culture medium for 72 h with 0.06 µM riboflavin or 100 µM CoQ resulted in a significant increase in fully assembled complexes I, IV and V in MELAS fibroblasts (Figure 7B and C).
Effect of riboflavin or CoQ treatment on proliferation rate, ROS generation, autophagy activation and bioenergetic status in transmitochondrial cybrids harbouring the m.3243A > G mutation
To confirm that riboflavin and CoQ were indeed able to recover MELAS pathophysiology in cell models of the disease, we tested the effects of these drugs on a cybrid clone harbouring the m.3243A > G mutation.
The rate of cellular proliferation was significantly reduced in MELAS cybrids when compared with Wt cybrids (Figure 8A). Both 0.06 µM riboflavin and 100 µM CoQ significantly increased the proliferation rate of MELAS and control cybrids (Figure 8A).
Figure 8.
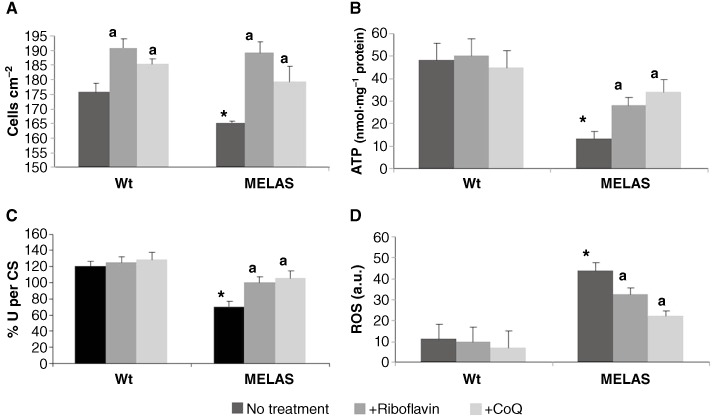
Effect of riboflavin and CoQ on MELAS cybrids. (A) Cell proliferation. Wt and MELAS cybrids were cultured in the absence or presence of riboflavin (0.06 µM) or CoQ (100 µM) for 72 h. Cell counting was performed as described in Methods. (B) ATP levels in Wt and MELAS cybrids in the absence or presence of riboflavin (0.06 µM) or CoQ (100 µM) for 72 h. (C) Activity of complexes I + III combined. Complexes I + III were determined as described in Methods. Results (mean ± SD) are expressed as U per CS (units per CS). (D) ROS generation in MELAS cybrids. Wt and MELAS cybrids cultures were grown in normal culture medium or in medium supplemented with riboflavin (0.06 µM) or CoQ (100 µM) for 72 h before analysis. ROS levels were then determined by flow cytometry using MitoSox red, and the mitochondrial mass was estimated using NAO Results are expressed as the ratio of MitoSOX signal to NAO signal. Data in arbitrary units (a.u.) represent the mean ± SD of three separate experiments. *P < 0.01 between Wt and MELAS cybrids. aP < 0.01 between the presence and the absence of riboflavin or CoQ.
Cellular ATP levels were reduced in the MELAS cybrids compared with the Wt cybrids (Figure 8B). Treatment with 0.06 µM riboflavin or 100 µM CoQ had no effect on ATP levels in control cybrids, but resulted in a significant increase in ATP levels in MELAS cybrid cells (Figure 8B) indicating that both treatments restored partially the bioenergetic status of the MELAS cybrids.
The activity of complexes I + III was significantly reduced in the MELAS cybrid compared with the control clone (Figure 8C). Riboflavin (0.06 µM) or CoQ (100 µM) supplementation restored these values to normal levels in the MELAS cybrid culture, but had only a minor effect in the control cybrid culture (Figure 8C).
We next examined mitochondrial ROS levels in control and MELAS cybrids by using MitoSOX Red and flow cytometry. At the same time, the mitochondrial mass was estimated with NAO, and the ratio of MitoSOX signal to NAO fluorescence was determined. There was an approximately threefold increase in mitochondrial ROS production in MELAS cybrids (Figure 8D). The inclusion of 0.06 µM riboflavin or 100 µM CoQ in the culture medium had no effect on the levels of mitochondrial ROS in control cybrid cultures, but was associated with a considerable reduction in ROS levels in MELAS cybrid cultures, although mitochondrial ROS levels were not restored to control values in these cells (Figure 8D).
Effect of CoQ and riboflavin on autophagy activation in transmitochondrial cybrids harbouring the m.3243A > G mutation
Lysotracker staining intensity was determined in a control cybrid clone and in a cybrid clone harbouring the m.3243A > G mutation. The mean Lysotracker intensity was increased approximately threefold in the MELAS cybrid clone (Figure 9A). Riboflavin (0.06 µM) or CoQ (100 µM) supplementation significantly decreased Lysotracker staining in MELAS cybrid cells, but had no effect in the control cybrid cells (Figure 9A).
Figure 9.
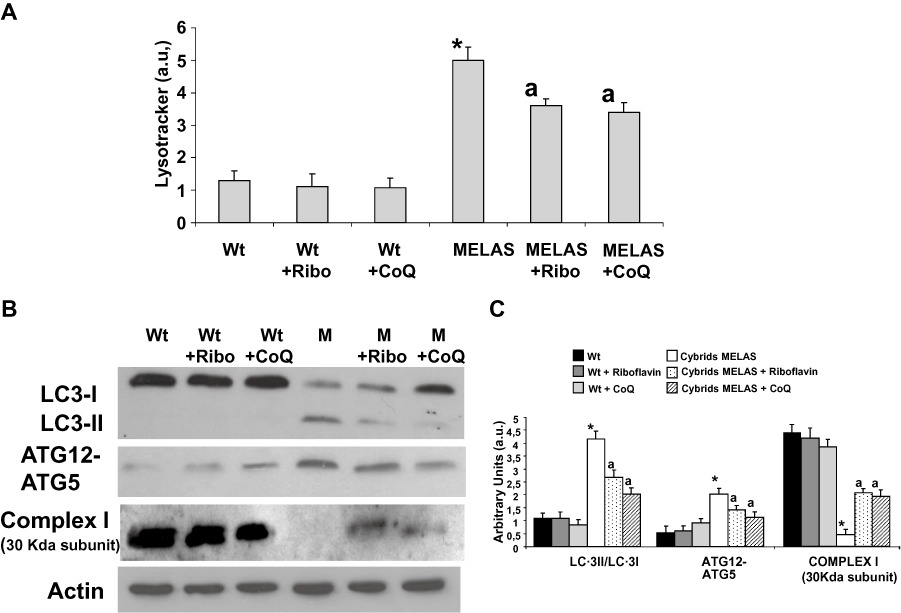
Effect of riboflavin and CoQ on autophagic markers in MELAS cybrids. (A) Quantification of acidic vacuoles in Wt and MELAS cybrids by LysoTracker staining and flow cytometry analysis. Cells were cultured in the presence or absence of riboflavin (Ribo) or CoQ. Results are expressed in arbitrary units (a.u). (B) Protein expression levels of LC3-I (upper band) and LC3-II (lower band), ATG12 and complex I (30 kDa subunit) were determined in Wt and MELAS (M) cybrid cultures by Western blotting. The ATG12 band represents the Atg12–Atg5 conjugated form. Cybrid cultures were grown in normal culture medium or in medium supplemented with 0.06 µM riboflavin (Ribo) or 100 µM CoQ for 72 h. Actin was used as a loading control. (C) Densitometry was performed using ImageJ software. Actin was used as loading control. Data in arbitrary units (a.u.) represent the mean ± SD of three separate experiments. *P < 0.01 between Wt and MELAS cybrids. aP < 0.01, between the presence and the absence of riboflavin or CoQ.
As a measure of autophagic activity, we also investigated the conversion of LC3-I to LC3-II. There was a significant fourfold increase in the ratio of LC3-II to LC3-I in MELAS cybrid cultures when compared with that in control cybrid cultures (Figure 9B and C). Supplementation of the culture medium with 0.06 µM riboflavin or 100 µM CoQ resulted in a significant decrease in the levels of LC3-II in these cultures. Additionally, the amount of ATG12-ATG5 conjugate was also increased threefold in MELAS cybrids and reduced under riboflavin or CoQ treatment (Figure 9B).
The expression of the 30 kDa subunit of complex I of the MRC was also reduced in the MELAS cybrid (Figure 9B and C). Supplementation with 0.06 µM riboflavin or 100 µM CoQ partially restored its expression levels (Figure 9B).
We next examined the expression of LC3 and cytochrome C in the cybrid cultures. In control cybrids, mitochondria, visualized by staining for cytochrome C, did not co-localize with LC3, while in MELAS cybrids, co-localization of cytochrome c and LC3 was observed (Figure 10A, B and C). Supplementation of the growth medium with riboflavin or CoQ resulted in a significant reduction in the co-localization of mitochondria with LC3 in MELAS cybrids (Figure 10A, B and C).
Figure 10.
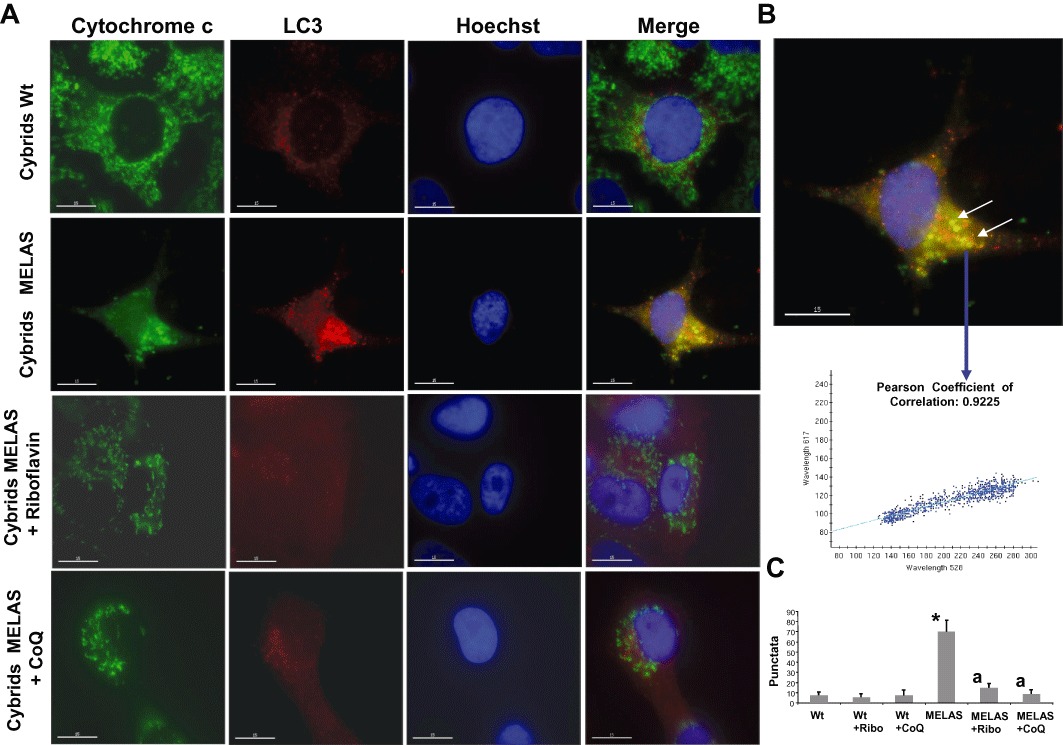
Mitochondrial degradation in MELAS cybrids. (A) Cultured Wt and MELAS cybrids were fixed, and immunostained with anti-LC3 and cytochrome c and examined by fluorescence microscopy. Colocalization of both markers was assessed by DeltaVision software. A representative picture of 100 analysed cells is shown. (B) Magnification of a small area in a MELAS cybrid. Arrows show autophagolysosomes with LC3 and cytochrome c colocalization. Colocalization of both markers was assessed using DeltaVision software calculating the Pearson coefficient of correlation. (C) Quantification of LC3 per cytochrome c puntacta in control and MELAS cybrids incubated with or without 0.06 µM riboflavin or 100 µM CoQ (n= 100 cells). *P < 0.01 between Wt and MELAS cybrids. aP < 0.01 between the presence and the absence of riboflavin or CoQ.
Discussion and conclusions
Treatment for MELAS syndrome includes pharmacological options, as well as lifestyle modifications such as diet and exercise programmes (Santa, 2010). However, evaluation of the effectiveness of the various treatment options is complicated by the relative rarity of the disease, the diverse clinical phenotypes associated with the disease and the unpredictable course. The lack of clear evidence in favour of any one therapy or combination of therapies and the progressive nature of the syndrome make it extremely difficult to evaluate the treatment and to search for new therapeutic options. The low frequency of the disease makes clinical trials challenging, leaving case reports as the main source of knowledge and guidance for medical practitioners. Moreover, many of the available clinical trials include patients with multiple types of mitochondrial disorders, making it difficult to extrapolate the results to MELAS patients in particular. Studies that include larger numbers of patients and well-defined outcomes are needed to clarify the potential role of pharmacotherapy for MELAS syndrome (Thambisetty et al., 2002). A variety of pharmacological options, mostly nutritional supplements and vitamins, have been tried with differing levels of success. Most treatment options focus on increasing respiratory chain activity by administering antioxidants, respiratory chain substrates and cofactors that augment the production or utilization of ATP. In our work, we have developed yeast, fibroblast and cybrid cell models of MELAS disease in the search for effective drugs for use in the treatment of this disorder.
S. cerevisiae has played an important role as a model system to understand human diseases (Smith and Snyder, 2006). The genetic tools available have also made S. cerevisiae a powerful system to identify gene–disease relationships.
Yeast offers invaluable guidance for approaching human disease-associated gene functions, particularly concerning mitochondrial ones due to the ability of yeast to survive without a functional MRC if a fermentable carbon source is made available (Barrientos, 2003). When the concentration of glucose is reduced, respiration-deficient yeast mutants grow slowly, forming small (petite) colonies (Rinaldi et al., 2010). Petite, oxidative phosphorylation-deficient, yeast mutants carry mtDNA abnormalities in the form of multiple rearrangements (rho− or as mtDNA-less strains (rho°). S. cerevisiae is also an excellent model system for drug discovery (Ma, 2001) as it is inexpensive to maintain and grow, its entire genome has been sequenced (Goffeau et al., 1996), its ∼6, 200 open reading frames exist in a readily usable form (Hudson et al., 1997), it is well suited to the expression of heterologous proteins, and it contains a multitude of selective markers. Furthermore, while several simple organisms are available to model nuclear-encoded mitochondrial defects, this is not the case for defects encoded by mtDNA, which, in general, is not susceptible to manipulation. The only exception is represented by S. cerevisiae, which allows the introduction of specific point mutations in its mtDNA. Following a biolistic procedure originally proposed by Fox et al. (1991), a protocol for the introduction of several mutations into a mitochondrial tRNA gene has been developed. One of these mutations, the A14G mutation in tRNALeu (UUR), is equivalent to the m.3243A > G mutation in humans and produces severe respiratory deficiencies (Feuermann et al., 2003) with a high production of mutants with mtDNA depletion (rho°). The percentage of rho° colonies is a good indicator of the severity of the respiratory phenotype (Montanari et al., 2008). Yeast harbouring the A14G mutation can grow in fermentable medium (with glucose or galactose as a carbon source), but their mtDNA is rapidly eliminated. In contrast, these yeasts are not able to grow in respiratory medium (with glycerol as carbon source; Feuermann et al., 2003). This property makes the A14G yeast mutant a suitable model for the screening of drugs able to suppress the respiratory defect.
In the present work, using the A14G yeast mutant model for the initial screening of drugs potentially effective in MELAS treatment, we found that only riboflavin and CoQ, among the several drugs tested, were able to suppress the pathological respiratory phenotype. Likewise, riboflavin and CoQ were able to restore all the pathological alterations found in patient-derived fibroblasts (including mitochondrial protein synthesis and respiratory complexes assembly) and cybrid models of the disease, validating the usefulness of the yeast model in screening drug candidates for the treatment of human respiratory chain disorders. Surprisingly, these drugs are among the most common therapeutic options currently used in MELAS syndrome (Santa, 2010).
Molecules that partly rescue the MELAS-deficient electron transfer chain, such as CoQ and riboflavin, can increase mitochondrial membrane potential and, subsequently, the import of nuclear-encoded mitochondrial proteins, and thus help raise the abundance of proteins of the electron transport chain.
It is noteworthy that CoQ and riboflavin at the highest concentration decreased the mutant yeast growth as compared with lower concentrations. Therefore, these compounds can be toxic at high concentrations. Every antioxidant is a redox agent that can protect against ROS in some circumstances and promote ROS production in others (Herbert, 1996). CoQ acts as an important in vivo antioxidant, but is also a primary source of O2−•/H2O2 generation in cells, thus CoQ in excess can become a pro-oxidant in humans (Crestanello et al., 2002). Likewise, B group vitamins have also both antioxidant and pro-oxidant effects on lipid peroxidation under different experimental conditions (Higashi-Okai et al., 2006).
One limitation of the MELAS yeast model is that it can eliminate compounds with putative efficacy in MELAS fibroblasts or cybrids. Nevertheless, as the MELAS yeast assay is based on the recovery of the respiratory phenotype, and as a consequence, the recovery of functional mitochondria, it may be a useful model for searching new drugs for MELAS syndrome and mitochondrial diseases.
On the other hand, biochemical studies of fibroblasts derived from mitochondrial patients and transmitochondrial cybrids have provided a wealth of information for understanding the pathophysiological changes present in these diseases (King and Attardi, 1989; Khan et al., 2007; Saada, 2011). These cellular models are very effective in elucidating the molecular mechanisms of mitochondrial diseases and in the screening of different treatments that suppress or enhance the pathophysiological alterations detected.
Riboflavin (vitamin B2) in MELAS treatment
The B vitamins are often considered first-line agents in the treatment of MELAS syndrome (Santa, 2010). Riboflavin is a precursor of flavin adenine dinucleotide (FAD) and flavin mononucleotide. As prosthetic groups, they are essential for the activity of flavoenzymes including oxidases, reductase and dehydrogenases (Depeint et al., 2006) and function as cofactors in complexes I and II of the MRC (Marriage et al., 2003). One theory is that riboflavin may act by inhibiting the proteolytic breakdown of complex I, with a subsequent increase in enzymatic activity (Vergani et al., 1999; Gold and Cohen, 2001). Riboflavin-deficient rats show abnormalities in both mitochondrial biochemistry and mitochondrial morphology, adding support to this hypothesis (Addison and McCormick, 1978). Riboflavin supplementation has been reported to be effective in a number of MELAS patients with complex I deficiency, the complex most affected in this disorder (Santa, 2010).
In addition to its role in the MRC complexes, riboflavin also acts as an antioxidant and riboflavin deficiency has been associated with increased oxidative stress (Powers, 1999). The antioxidant activity of riboflavin is principally derived from its role as a precursor of FAD and the role of this cofactor in the production of the antioxidant, reduced glutathione (Halliwell, 1996). Reduced glutathione is a cofactor of selenium-containing glutathione peroxidase, a major antioxidant enzyme. Thus, the antioxidant activity of riboflavin could suppress the ROS-induced mitophagy in MELAS cells (Cotan et al., 2011), preventing the degradation of mitochondria.
CoQ in MELAS treatment
CoQ, a fat-soluble quinone, is the most widely used therapeutic agent in patients with mitochondrial disease because of its critical role in energy metabolism. CoQ may provide benefit through multiple mechanisms including reversal of CoQ deficiencies in mitochondrial disorders and enhancement of the activity of the respiratory chain in patients with inadequate complex III activity (Gold and Cohen, 2001). CoQ is an essential electron transporter in the MRC, transferring electrons from complexes I and II to complex III. Moreover, CoQ also helps stabilize the oxidative phosphorylation complexes within the inner mitochondrial membrane by maintaining optimal membrane fluidity (Fato et al., 1984). Furthermore, CoQ acts as an antioxidant that can scavenge ROS (Gold and Cohen, 2001; Scaglia and Northrop, 2006; Kerr, 2010). In this regard, CoQ inhibits lipid peroxidation and can protect mitochondrial inner-membrane proteins and DNA from oxidative damage (Ernster and Dallner, 1995). Hence, the antioxidant activity of CoQ, like riboflavin, could block ROS-induced mitophagy. Overall, reports of CoQ use in mitochondrial disorders have produced mixed results. However, CoQ is considered a first-line therapy for patients with MELAS syndrome and no significant adverse reactions have been reported (Matthews et al., 1993; Scaglia and Northrop, 2006). CoQ treatment is also a first-line option in primary and secondary CoQ deficiencies. Primary CoQ deficiency is due to mutations in the genes controlling CoQ biosynthesis and these patients usually show a dramatic response to CoQ therapy (Quinzii and Hirano, 2010). Secondary CoQ deficiency may be defined as reduced CoQ concentration in muscle without a defect affecting the biosynthetic pathway (Quinzii et al., 2007). In clinical practice, CoQ supplementation is frequently employed in patients with mitochondrial disorders in the absence of a specific therapy. While in primary CoQ deficiency the effect of this therapy is clearly established (Montini et al., 2008), in secondary forms, contradictory results have been reported (Chinnery et al., 2006). However, the high frequency of secondary CoQ deficiency among patients with mitochondrial myopathy (Sacconi et al., 2010) and the relative safety of the treatment, provide a rationale for the future study of the effects of oral CoQ supplementation in patients with mitochondrial disorders, especially if a CoQ deficiency is detected, regardless of the precise genetic aetiology. In this regard, we have previously demonstrated that CoQ supplementation in fibroblasts derived from two MELAS patients restored the pathological alterations found in these cells (Cotan et al., 2011).
Conclusion
Here we report that yeast, MELAS patient-derived fibroblasts and cybrid cell models of MELAS could be suitable for screening and validating new drug candidates for the treatment of MELAS disease. In these assays, we observed that supplementation with riboflavin or CoQ effectively improved the viability and pathophysiology of MELAS cell models. As no difference was detected between the drug responses of the MELAS fibroblasts with 43% of heteroplasmy and MELAS cybrids with 90% of heteroplasmy, these models are suitable for testing the effects of treatments in patient cells with different levels of heteroplasmy.
The results presented in this work support the hypothesis that important progress towards the rational and alternative treatment of human mitochondrial diseases could be achieved through the initial use of new drug screening tests in cell models.
Acknowledgments
This work was supported by FIS PI10/00543 grant, FIS EC08/00076 grant, Ministerio de Sanidad, Spain and Fondo Europeo de Desarrollo Regional (FEDER-Unión Europea), SAS 111242 grant, Servicio Andaluz de Salud-Junta de Andalucía, Proyecto de Investigación de Excelencia de la Junta de Andalucía CTS-5725, and by AEPMI (Asociación de Enfermos de Patología Mitocondrial), FEEL (Fundación Española de Enfermedades Lisosomales) and Federación Andaluza de Fibromialgia y Fatiga Crónica (ALBA Andalucía). MM received a fellowship from Colegio Oficial de Farmacéuticos de Sevilla. We thank to Dr Santos-Ocaña for his help with the yeast cultures. This group was founded by the Centro de Investigación Biomédica en Red de Enfermedades Raras (CIBERER), ISCIII.
Glossary
- BN-PAGE
blue-native PAGE
- CoQ
coenzyme Q10
- CS
citrate synthase
- DAPI
4′,6-diamidino-2-phenylindole
- FCCP
carbonyl cyanide 4-(trifluoromethoxy) phenyl hydrazone
- MELAS
or M, mitochondrial encephalo-myopathy, lactic acidosis and stroke-like episodes
- MRC
mitochondrial respiratory chain
- MT-TL1
mitochondrially encoded tRNA leucine 1 (UUA/G)
- NAO
10-N-nonyl acridine orange
- Ribo
riboflavin
- ROS
reactive oxygen species
- Wt
wild-type
- YPD
yeast extract peptone dextrose medium
- YPG
yeast extract peptone glycerol medium
Conflict of interest
The authors do not have a conflict of interest.
References
- Addison R, McCormick DB. Biogenesis of flavoprotein and cytochrome components in hepatic mitochondria from riboflavin-deficient rats. Biochem Biophys Res Commun. 1978;81:133–138. doi: 10.1016/0006-291x(78)91640-6. [DOI] [PubMed] [Google Scholar]
- de Andrade PB, Rubi B, Frigerio F, van den Ouweland JM, Maassen JA, Maechler P. Diabetes-associated mitochondrial DNA mutation A3243G impairs cellular metabolic pathways necessary for beta cell function. Diabetologia. 2006;49:1816–1826. doi: 10.1007/s00125-006-0301-9. [DOI] [PubMed] [Google Scholar]
- Bai RK, Wong LJ. Detection and quantification of heteroplasmic mutant mitochondrial DNA by real-time amplification refractory mutation system quantitative PCR analysis: a single-step approach. Clin Chem. 2004;50:996–1001. doi: 10.1373/clinchem.2004.031153. [DOI] [PubMed] [Google Scholar]
- Barrientos A. Yeast models of human mitochondrial diseases. IUBMB Life. 2003;55:83–95. doi: 10.1002/tbmb.718540876. [DOI] [PubMed] [Google Scholar]
- Bodnar AG, Cooper JM, Leonard JV, Schapira AH. Respiratory-deficient human fibroblasts exhibiting defective mitochondrial DNA replication. Biochem J. 1995;305((Pt 3)):817–822. doi: 10.1042/bj3050817. [DOI] [PMC free article] [PubMed] [Google Scholar]
- Chinnery P, Majamaa K, Turnbull D, Thorburn D. Treatment for mitochondrial disorders. Cochrane Database Syst Rev. 2006;(1) doi: 10.1002/14651858.CD004426.pub2. CD004426. [DOI] [PubMed] [Google Scholar]
- Chomyn A, Martinuzzi A, Yoneda M, Daga A, Hurko O, Johns D, et al. MELAS mutation in mtDNA binding site for transcription termination factor causes defects in protein synthesis and in respiration but no change in levels of upstream and downstream mature transcripts. Proc Natl Acad Sci U S A. 1992;89:4221–4225. doi: 10.1073/pnas.89.10.4221. [DOI] [PMC free article] [PubMed] [Google Scholar]
- Cotan D, Cordero MD, Garrido-Maraver J, Oropesa-Avila M, Rodriguez-Hernandez A, Gomez Izquierdo L, et al. Secondary coenzyme Q10 deficiency triggers mitochondria degradation by mitophagy in MELAS fibroblasts. FASEB J. 2011;25:2669–2687. doi: 10.1096/fj.10-165340. [DOI] [PubMed] [Google Scholar]
- Crestanello JA, Doliba NM, Doliba NM, Babsky AM, Niborii K, Osbakken MD, et al. Effect of coenzyme Q10 supplementation on mitochondrial function after myocardial ischemia reperfusion. J Surg Res. 2002;102:221–228. doi: 10.1006/jsre.2001.6324. [DOI] [PubMed] [Google Scholar]
- Crimi M, Bordoni A, Menozzi G, Riva L, Fortunato F, Galbiati S, et al. Skeletal muscle gene expression profiling in mitochondrial disorders. FASEB J. 2005;19:866–868. doi: 10.1096/fj.04-3045fje. [DOI] [PubMed] [Google Scholar]
- Depeint F, Bruce WR, Shangari N, Mehta R, O'Brien PJ. Mitochondrial function and toxicity: role of the B vitamin family on mitochondrial energy metabolism. Chem Biol Interact. 2006;163:94–112. doi: 10.1016/j.cbi.2006.04.014. [DOI] [PubMed] [Google Scholar]
- DiMauro S, Hirano M, Schon EA. Approaches to the treatment of mitochondrial diseases. Muscle Nerve. 2006;34:265–283. doi: 10.1002/mus.20598. [DOI] [PubMed] [Google Scholar]
- Ernster L, Dallner G. Biochemical, physiological and medical aspects of ubiquinone function. Biochim Biophys Acta. 1995;1271:195–204. doi: 10.1016/0925-4439(95)00028-3. [DOI] [PubMed] [Google Scholar]
- Fato R, Bertoli E, Parenti Castelli G, Lenaz G. Fluidizing effect of endogenous ubiquinone in bovine heart mitochondrial membranes. FEBS Lett. 1984;172:6–10. doi: 10.1016/0014-5793(84)80861-3. [DOI] [PubMed] [Google Scholar]
- Feuermann M, Francisci S, Rinaldi T, De Luca C, Rohou H, Frontali L, et al. The yeast counterparts of human ‘MELAS’ mutations cause mitochondrial dysfunction that can be rescued by overexpression of the mitochondrial translation factor EF-Tu. EMBO Rep. 2003;4:53–58. doi: 10.1038/sj.embor.embor713. [DOI] [PMC free article] [PubMed] [Google Scholar]
- Finsterer J. Genetic, pathogenetic, and phenotypic implications of the mitochondrial A3243G tRNALeu(UUR) mutation. Acta Neurol Scand. 2007;116:1–14. doi: 10.1111/j.1600-0404.2007.00836.x. [DOI] [PubMed] [Google Scholar]
- Fox TD, Folley LS, Mulero JJ, McMullin TW, Thorsness PE, Hedin LO, et al. Analysis and manipulation of yeast mitochondrial genes. Methods Enzymol. 1991;194:149–165. doi: 10.1016/0076-6879(91)94013-3. [DOI] [PubMed] [Google Scholar]
- Gajewski CD, Yang L, Schon EA, Manfredi G. New insights into the bioenergetics of mitochondrial disorders using intracellular ATP reporters. Mol Biol Cell. 2003;14:3628–3635. doi: 10.1091/mbc.E02-12-0796. [DOI] [PMC free article] [PubMed] [Google Scholar]
- Goffeau A, Barrell BG, Bussey H, Davis RW, Dujon B, Feldmann H, et al. Life with 6000 genes. Science. 1996;274:546. doi: 10.1126/science.274.5287.546. 563–567. [DOI] [PubMed] [Google Scholar]
- Gold DR, Cohen BH. Treatment of mitochondrial cytopathies. Semin Neurol. 2001;21:309–325. doi: 10.1055/s-2001-17948. [DOI] [PubMed] [Google Scholar]
- Goto Y, Nonaka I, Horai S. A mutation in the tRNA(Leu)(UUR) gene associated with the MELAS subgroup of mitochondrial encephalomyopathies. Nature. 1990;348:651–653. doi: 10.1038/348651a0. [DOI] [PubMed] [Google Scholar]
- Halliwell B. Antioxidants in human health and disease. Annu Rev Nutr. 1996;16:33–50. doi: 10.1146/annurev.nu.16.070196.000341. [DOI] [PubMed] [Google Scholar]
- Herbert V. Prooxidant effects of antioxidant vitamins. Introduction. J Nutr. 1996;126(Suppl. 4):1197S–1200S. [PubMed] [Google Scholar]
- Higashi-Okai K, Nagino H, Yamada K, Okai Y. Antioxidant and prooxidant activities of B group vitamins in lipid peroxidation. J UOEH. 2006;28:359–368. doi: 10.7888/juoeh.28.359. [DOI] [PubMed] [Google Scholar]
- Hilton G. MELAS: a mitochondrial encephalomyopathy syndrome. J Neurosci Nurs. 1995;27:278–282. doi: 10.1097/01376517-199510000-00007. [DOI] [PubMed] [Google Scholar]
- Hudson JR, Jr, Dawson EP, Rushing KL, Jackson CH, Lockshon D, Conover D, et al. The complete set of predicted genes from Saccharomyces cerevisiae in a readily usable form. Genome Res. 1997;7:1169–1173. doi: 10.1101/gr.7.12.1169. [DOI] [PMC free article] [PubMed] [Google Scholar]
- Jacobson J, Duchen MR, Heales SJ. Intracellular distribution of the fluorescent dye nonyl acridine orange responds to the mitochondrial membrane potential: implications for assays of cardiolipin and mitochondrial mass. J Neurochem. 2002;82:224–233. doi: 10.1046/j.1471-4159.2002.00945.x. [DOI] [PubMed] [Google Scholar]
- Jahangir Tafrechi RS, Svensson PJ, Janssen GM, Szuhai K, Maassen JA, Raap AK. Distinct nuclear gene expression profiles in cells with mtDNA depletion and homoplasmic A3243G mutation. Mutat Res. 2005;578:43–52. doi: 10.1016/j.mrfmmm.2005.02.002. [DOI] [PubMed] [Google Scholar]
- James AM, Wei YH, Pang CY, Murphy MP. Altered mitochondrial function in fibroblasts containing MELAS or MERRF mitochondrial DNA mutations. Biochem J. 1996;318((Pt 2)):401–407. doi: 10.1042/bj3180401. [DOI] [PMC free article] [PubMed] [Google Scholar]
- James AM, Sheard PW, Wei YH, Murphy MP. Decreased ATP synthesis is phenotypically expressed during increased energy demand in fibroblasts containing mitochondrial tRNA mutations. Eur J Biochem. 1999;259:462–469. doi: 10.1046/j.1432-1327.1999.00066.x. [DOI] [PubMed] [Google Scholar]
- Kerr DS. Treatment of mitochondrial electron transport chain disorders: a review of clinical trials over the past decade. Mol Genet Metab. 2010;99:246–255. doi: 10.1016/j.ymgme.2009.11.005. [DOI] [PubMed] [Google Scholar]
- Khan SM, Smigrodzki RM, Swerdlow RH. Cell and animal models of mtDNA biology: progress and prospects. Am J Physiol Cell Physiol. 2007;292:C658–C669. doi: 10.1152/ajpcell.00224.2006. [DOI] [PubMed] [Google Scholar]
- Kim G, Sikder H, Singh KK. A colony color method identifies the vulnerability of mitochondria to oxidative damage. Mutagenesis. 2002;17:375–381. doi: 10.1093/mutage/17.5.375. [DOI] [PubMed] [Google Scholar]
- Kim I, Rodriguez-Enriquez S, Lemasters JJ. Selective degradation of mitochondria by mitophagy. Arch Biochem Biophys. 2007;462:245–253. doi: 10.1016/j.abb.2007.03.034. [DOI] [PMC free article] [PubMed] [Google Scholar]
- King MP, Attardi G. Human cells lacking mtDNA: repopulation with exogenous mitochondria by complementation. Science. 1989;246:500–503. doi: 10.1126/science.2814477. [DOI] [PubMed] [Google Scholar]
- King MP, Koga Y, Davidson M, Schon EA. Defects in mitochondrial protein synthesis and respiratory chain activity segregate with the tRNA(Leu(UUR)) mutation associated with mitochondrial myopathy, encephalopathy, lactic acidosis, and strokelike episodes. Mol Cell Biol. 1992;12:480–490. doi: 10.1128/mcb.12.2.480. [DOI] [PMC free article] [PubMed] [Google Scholar]
- Kirino Y, Yasukawa T, Ohta S, Akira S, Ishihara K, Watanabe K, et al. Codon-specific translational defect caused by a wobble modification deficiency in mutant tRNA from a human mitochondrial disease. Proc Natl Acad Sci U S A. 2004;101:15070–15075. doi: 10.1073/pnas.0405173101. [DOI] [PMC free article] [PubMed] [Google Scholar]
- Kobayashi Y, Momoi MY, Tominaga K, Momoi T, Nihei K, Yanagisawa M, et al. A point mutation in the mitochondrial tRNA(Leu)(UUR) gene in MELAS (mitochondrial myopathy, encephalopathy, lactic acidosis and stroke-like episodes) Biochem Biophys Res Commun. 1990;173:816–822. doi: 10.1016/s0006-291x(05)80860-5. [DOI] [PubMed] [Google Scholar]
- Koga Y, Povalko N, Nishioka J, Katayama K, Kakimoto N, Matsuishi T. MELAS and L-arginine therapy: pathophysiology of stroke-like episodes. Ann N Y Acad Sci. 2010;1201:104–110. doi: 10.1111/j.1749-6632.2010.05624.x. [DOI] [PubMed] [Google Scholar]
- Levinger L, Morl M, Florentz C. Mitochondrial tRNA 3' end metabolism and human disease. Nucleic Acids Res. 2004;32:5430–5441. doi: 10.1093/nar/gkh884. [DOI] [PMC free article] [PubMed] [Google Scholar]
- Lowry OH, Rosebrough NJ, Farr AL, Randall RJ. Protein measurement with the Folin phenol reagent. J Biol Chem. 1951;193:265–275. [PubMed] [Google Scholar]
- Ma D. Applications of yeast in drug discovery. Prog Drug Res. 2001;57:117–162. doi: 10.1007/978-3-0348-8308-5_3. [DOI] [PubMed] [Google Scholar]
- Marriage B, Clandinin MT, Glerum DM. Nutritional cofactor treatment in mitochondrial disorders. J Am Diet Assoc. 2003;103:1029–1038. doi: 10.1016/s0002-8223(03)00476-0. [DOI] [PubMed] [Google Scholar]
- Matthews PM, Ford B, Dandurand RJ, Eidelman DH, O'Connor D, Sherwin A, et al. Coenzyme Q10 with multiple vitamins is generally ineffective in treatment of mitochondrial disease. Neurology. 1993;43:884–890. doi: 10.1212/wnl.43.5.884. [DOI] [PubMed] [Google Scholar]
- Montanari A, Besagni C, De Luca C, Morea V, Oliva R, Tramontano A, et al. Yeast as a model of human mitochondrial tRNA base substitutions: investigation of the molecular basis of respiratory defects. RNA. 2008;14:275–283. doi: 10.1261/rna.740108. [DOI] [PMC free article] [PubMed] [Google Scholar]
- Montini G, Malaventura C, Salviati L. Early coenzyme Q10 supplementation in primary coenzyme Q10 deficiency. N Engl J Med. 2008;358:2849–2850. doi: 10.1056/NEJMc0800582. [DOI] [PubMed] [Google Scholar]
- Powers HJ. Current knowledge concerning optimum nutritional status of riboflavin, niacin and pyridoxine. Proc Nutr Soc. 1999;58:435–440. doi: 10.1017/s0029665199000579. [DOI] [PubMed] [Google Scholar]
- Quinzii C, Naini A, Salviati L, Trevisson E, Navas P, Dimauro S, et al. A mutation in para-hydroxybenzoate-polyprenyl transferase (COQ2) causes primary coenzyme Q10 deficiency. Am J Hum Genet. 2006;78:345–349. doi: 10.1086/500092. [DOI] [PMC free article] [PubMed] [Google Scholar]
- Quinzii CM, Hirano M. Coenzyme Q and mitochondrial disease. Dev Disabil Res Rev. 2010;16:183–188. doi: 10.1002/ddrr.108. [DOI] [PMC free article] [PubMed] [Google Scholar]
- Quinzii CM, DiMauro S, Hirano M. Human coenzyme Q10 deficiency. Neurochem Res. 2007;32:723–727. doi: 10.1007/s11064-006-9190-z. [DOI] [PMC free article] [PubMed] [Google Scholar]
- Rinaldi T, Dallabona C, Ferrero I, Frontali L, Bolotin-Fukuhara M. Mitochondrial diseases and the role of the yeast models. FEMS Yeast Res. 2010;10:1006–1022. doi: 10.1111/j.1567-1364.2010.00685.x. [DOI] [PubMed] [Google Scholar]
- Rustin P, Chretien D, Bourgeron T, Gerard B, Rotig A, Saudubray JM, et al. Biochemical and molecular investigations in respiratory chain deficiencies. Clin Chim Acta. 1994;228:35–51. doi: 10.1016/0009-8981(94)90055-8. [DOI] [PubMed] [Google Scholar]
- Saada A. The use of individual patient's fibroblasts in the search for personalized treatment of nuclear encoded OXPHOS diseases. Mol Genet Metab. 2011;104:39–47. doi: 10.1016/j.ymgme.2011.07.016. [DOI] [PubMed] [Google Scholar]
- Sacconi S, Trevisson E, Salviati L, Ayme S, Rigal O, Redondo AG, et al. Coenzyme Q10 is frequently reduced in muscle of patients with mitochondrial myopathy. Neuromuscul Disord. 2010;20:44–48. doi: 10.1016/j.nmd.2009.10.014. [DOI] [PubMed] [Google Scholar]
- Santa KM. Treatment options for mitochondrial myopathy, encephalopathy, lactic acidosis, and stroke-like episodes (MELAS) syndrome. Pharmacotherapy. 2010;30:1179–1196. doi: 10.1592/phco.30.11.1179. [DOI] [PubMed] [Google Scholar]
- Scaglia F, Northrop JL. The mitochondrial myopathy encephalopathy, lactic acidosis with stroke-like episodes (MELAS) syndrome: a review of treatment options. CNS Drugs. 2006;20:443–464. doi: 10.2165/00023210-200620060-00002. [DOI] [PubMed] [Google Scholar]
- Scherz-Shouval R, Elazar Z. ROS, mitochondria and the regulation of autophagy. Trends Cell Biol. 2007;17:422–427. doi: 10.1016/j.tcb.2007.07.009. [DOI] [PubMed] [Google Scholar]
- Scherz-Shouval R, Elazar Z. Regulation of autophagy by ROS: physiology and pathology. Trends Biochem Sci. 2011;36:30–38. doi: 10.1016/j.tibs.2010.07.007. [DOI] [PubMed] [Google Scholar]
- Schon EA, Koga Y, Davidson M, Moraes CT, King MP. The mitochondrial tRNA(Leu)(UUR)) mutation in MELAS: a model for pathogenesis. Biochim Biophys Acta. 1992;1101:206–209. [PubMed] [Google Scholar]
- Smith MG, Snyder M. 2006. Yeast as a model for human disease. Current protocols in human genetics/editorial board, Jonathan L. Haines … et al. Chapter 15: Unit 15 16.
- Sprinzl M, Horn C, Brown M, Ioudovitch A, Steinberg S. Compilation of tRNA sequences and sequences of tRNA genes. Nucleic Acids Res. 1998;26:148–153. doi: 10.1093/nar/26.1.148. [DOI] [PMC free article] [PubMed] [Google Scholar]
- Sproule DM, Kaufmann P. Mitochondrial encephalopathy, lactic acidosis, and strokelike episodes: basic concepts, clinical phenotype, and therapeutic management of MELAS syndrome. Ann N Y Acad Sci. 2008;1142:133–158. doi: 10.1196/annals.1444.011. [DOI] [PubMed] [Google Scholar]
- Thambisetty M, Newman NJ, Glass JD, Frankel MR. A practical approach to the diagnosis and management of MELAS: case report and review. Neurologist. 2002;8:302–312. doi: 10.1097/00127893-200209000-00003. [DOI] [PubMed] [Google Scholar]
- Vergani L, Barile M, Angelini C, Burlina AB, Nijtmans L, Freda MP, et al. Riboflavin therapy. Biochemical heterogeneity in two adult lipid storage myopathies. Brain. 1999;122((Pt 12)):2401–2411. doi: 10.1093/brain/122.12.2401. [DOI] [PubMed] [Google Scholar]
- Zeviani M, Carelli V. Mitochondrial disorders. Curr Opin Neurol. 2007;20:564–571. doi: 10.1097/WCO.0b013e3282ef58cd. [DOI] [PubMed] [Google Scholar]