

Abstract
The thalamic reticular nucleus (RE) provides inhibition to the dorsal thalamus, and forms a crucial interface between thalamocortical and corticothalamic signals. Whereas there has been significant interest in the role of the RE in organizing thalamocortical signaling, information on the activity of the RE in the awake animal is scant. Here we investigated the activity of neurons within the “motor” compartment of the RE in the awake, unrestrained cat during simple locomotion on a flat surface and complex locomotion along a horizontal ladder that required visual control of stepping. The activity of 88% of neurons in this region was modulated during locomotion. Neurons with receptive fields on the shoulder were located dorsally in the nucleus and had regular discharges; during locomotion they had relatively low activity and modest magnitudes of stride-related modulation, and their group activity was distributed over the stride. In contrast, neurons with receptive fields on the wrist/paw were located more ventrally, often discharged sleep-type bursts during locomotion, were very active and profoundly modulated, and their group activity was concentrated in the swing and end of stance. Seventy-five percent of RE neurons had different activity during the two locomotion tasks. We conclude that during locomotion the RE differentially gates thalamocortical signals transmitted during different phases of the stride, in relation to different parts of the limb, and the type of locomotion task.
Introduction
The reticular nucleus of thalamus (RE) consists of GABA-ergic neurons that receive inputs from axonal collaterals of both thalamic neurons projecting to the cortex, and of neurons of cortical layer VI projecting to the thalamus (for review, see Jones, 2007). RE neurons project back to the dorsal thalamic nuclei inhibiting them. Thus, the RE provides feedback inhibition of ascending thalamocortical signals and feedforward inhibition of descending corticothalamic signals. Whereas a wealth of information is available on the properties of RE neurons in brain slices, in anesthetized animals and during sleep, especially regarding the visual and somatosensory domains (Steriade at al., 1990; McCormick and Bal, 1997; Funke and Eysel, 1998; McCormick and Contreras, 2001; Hartings et al., 2003; Lam and Sherman, 2005, 2007, 2011; Cotillon-Williams et al., 2008; Sillito and Jones, 2008), the involvement of the RE in production of movement has not been documented. It remains unknown how the RE reflects thalamocortical signal transmission during an actual movement, and whether its influence differs for different segments of the limb, different phases of the movement, or different types of movements.
Here, we report the activity of RE neurons during natural behavior in the awake, unrestrained cat. We used single neuron extracellular recordings in cats performing simple locomotion on a flat surface as well as complex visually guided stepping along a horizontal ladder. We found that the activity of neurons in the motor compartment of the RE was profoundly modulated in the rhythm of strides, strongly differed between cells with receptive fields on different segments of the limb, and varied depending on the complexity of the locomotion task. We discuss relative contributions of the ventrolateral thalamus (VL) and motor cortex (MC) to the activity of RE neurons and the effect that this activity may have on the transmission of signals from the VL to the MC during locomotion.
A brief account of a part of this study was published in abstract form (Marlinski et al., 2010).
Materials and Methods
Extracellular recordings from single RE neurons were obtained during chronic experiments in two adult cats, a female (cat 1) and male (cat 2). The methods of surgical preparation and recording technique have been previously described in detail (Beloozerova and Sirota, 1993a; Prilutsky et al., 2005; Sirota et al., 2005; Zelenin et al., 2010) and will be briefly reported here. The experimental protocol was in compliance with National Institutes of Health guidelines for the care and use of animals in research, and was approved by the Barrow Neurological Institute Animal Care and Use Committee.
Locomotion tasks.
Two locomotion tasks were used: simple locomotion on a flat surface, and complex locomotion on crosspieces of a horizontal ladder (Fig. 1B). Simple locomotion does not require vision, whereas complex locomotion does (Sherk and Fowler, 2001; Beloozerova and Sirota, 2003; Marigold and Patla, 2008). During ladder locomotion, cats step on the support surface with substantially less spatial variability as compared with simple locomotion (Beloozerova et al., 2010).
Figure 1.

Experimental paradigm. A, A schematic drawing of a parasagittal section of the brain showing the position of chronically implanted guide tubes for recording electrodes above the RE and stimulating electrodes in the VL and MC. B, Locomotion tasks: walking in a chamber on a flat surface and along a horizontal ladder. The trace Gates shows when the cat has passed the beginning and end of each of the chamber's corridors. The trace Steps indicates the swing and stance phases of the right forelimb recorded with an electromechanic sensor. The trace Neuron shows discharge of a neuron from the RE.
Cats were habituated to the experimental environment and trained to walk in an experimental chamber over a period of 1 month (Skinner, 1938; Pryor, 1975). The walking chamber was a rectangular enclosure with two connected parallel corridors (2.5 × 0.3 m each): one had a flat walking surface, while the other contained a horizontal ladder (Beloozerova and Sirota, 1993a; Beloozerova et al., 2010). The centers of the ladder crosspieces were spaced 25 cm apart, equal to one half of a cat's average stride length during locomotion in the chamber with the flat floor. The crosspieces had flat tops, and were 5 cm wide, which was slightly greater than the 3 cm diameter support area of the cat paw. The ladder was elevated above the chamber's floor by 6 cm. While walking in the chamber, cats passed through the two corridors sequentially, occasionally changing direction from clockwise to counterclockwise. After each round, food was dispensed into a feeding dish in one of the corners. Upon arrival, cats were trained to stand in front of the feeding dish for 3–5 s. During data analyses, one second in the middle of this period was considered as “standing.”
Cats were accustomed to wear a cotton jacket, a light backpack with connectors, and a sock with a small metal plate on the sole of the foot for recording foot contact with the floor. The floor in the chamber and the crosspieces of the ladder were covered with an electrically conductive rubberized material. During locomotion, the duration of the swing and stance phases of the forelimb contralateral to the side of recording in the RE was monitored by measuring the electrical resistance between the plate and the floor (Fig. 1B, Steps trace) (Beloozerova and Sirota, 1993a; Beloozerova et al., 2010). The cat's passage through the beginning and the end of each corridor was recorded using infrared photodiodes (Fig. 1B, Gates trace).
Surgical procedures.
Surgery was performed under Isoflurane anesthesia in aseptic conditions. The skin and fascia were retracted from the dorsal surface of the skull. At 10 points around the circumference of the skull, stainless steel screws were implanted. The screw heads were then embedded into a plastic cast that formed a circular base. Later this base was used for the fixation of connectors, electrode microdrive, preamplifier, and to rigidly hold the cat's head while searching for neurons. An arrangement of 8 (cat 1) or 19 (cat 2) 28 gauge hypodermic guide tubes was implanted vertically above the rostrolateral part of the left RE (Fig. 1A). The tip of the arrangement was lowered to the vertical Horsley–Clarke coordinate V +7.0. Here and further, the vertical coordinate given corresponds to the coordinate of the atlas of Reinoso-Suarez (1961) minus 10 mm that aligns it with coordinates of other commonly used atlases of the cat brain. In addition, two similar guide tubes were implanted vertically above the left VL with tips approximately at the Horsley–Clarke coordinates [anterior (A) 9.0, lateral (L), 4.0] and the depth of V +7.0. They were used for insertion of stimulating electrodes into the VL. Figure 3C shows a reference electrolytic lesion in the left VL that was made with a stimulating electrode.
Figure 3.

Identifying motor-related compartment of the RE by responses of neurons to electrical stimulation of the MC and VL, and by their responses to somatosensory stimulation. A, Position of stimulation electrodes in the cortex. Electrodes entry points into the cortex are combined from both cats and shown by circles on the photograph of cat 2 cortex. MCdist, MC representation of the distal forelimb (wrist/paw); MCprox, MC representation of the proximal forelimb (shoulder/elbow); MChind, MC representation of the hindlimb; Cru, cruciate sulcus; AnsL, lateral ansate sulcus; AnsM, medial ansate sulcus. Vertical dashed lines and arrows (A–C) indicate approximate positions of parasagittal sections shown in Figure 5A–C. B, A typical response of an RE neuron to stimulation of the MC. A short latency burst is followed by a period of silence and then by another burst. C, Reference electrolytic lesion in the left VL of cat 1. In this cat stimulating electrodes were positioned in the caudal part of the VL at the level of the most rostral aspect of the lateral geniculate body that is visible laterally in this section, approximately at the Horsley–Clarke rostrocaudal coordinate of P8.5. Gliosis surrounding the electrode track and the reference lesion mark are indicated by arrows. CL, nucleus centralis lateralis; LG, lateral geniculate nucleus; LP, nucleus lateralis posterior; PC, pedunculus cerebri; RE, nucleus reticularis thalami; VL, nucleus ventralis lateralis; VM, nucleus medialis; VPL, nucleus ventralis posterior lateralis; VPM, nucleus ventralis posterior medialis. Frontal 50-μm-thick section, cresyl violet stain. D, A typical response of the same RE neuron as shown in B to stimulation of the VL. A short latency burst is followed by a period of silence and then by another burst. E, Responses of the neuron to passive extension of the elbow.
On the left side of the head, the dorsal surface of the rostral and lateral sigmoid gyri and the rostral part of the posterior sigmoid gyrus were exposed by removal of ∼1 cm2 of bone and dura mater. The region of the motor and somatosensory sensory cortex was visually identified based on surface features and photographed (Fig. 3A). The exposure was covered with a 1 mm thick acrylic plate. The plate was pre-perforated with holes of 0.36 mm in diameter spaced by 0.5 mm. The holes were filled with bone wax. The plate allowed for later implantation of stimulating electrodes in the cortex that were used to evoke responses in the RE.
Single-unit recording.
Several days after the surgery the cat was placed on a table equipped with a comforting pad and encouraged to take a “sphinx” posture. After the cat rested in this posture for several minutes, the base attached to the skull during surgery was fastened to an external frame so that the resting position of the head was approximated. After a few training sessions, all cats sat quietly with their head restrained. They did not seem to be disturbed by the restraint and frequently fell asleep.
The MC was mapped using multiple-unit recording and microstimulation techniques. A detailed description of the identification of the MC was given previously (Beloozerova et al., 2005). Stimulating electrodes were implanted into the MC representation of the distal (MCdist) and proximal (MCprox) forelimb areas at approximate coordinates A 26–27, L 8–9, and L 6–7, respectively, as well as in the hindlimb-related area in the fold of the postcruciate cortex (MChind) (Fig. 3A). Stimulating electrodes were also implanted in the premotor area 6 at approximate coordinates A 27, L 4–5, and in the forelimb-related part of somatosensory area 1–2 at approximate coordinates A 20, L 9–10. All stimulating electrodes were made of Teflon-insulated platinum–iridium wire with outer diameter 140 μm (A-M Systems). The 0.4 mm tip of the wire was freed from isolation and tapered. Wires were inserted into the cortex 1 mm apart through perforations in the acrylic plate implanted above it, and fixed. These wires were also used for recording the electroencephalogram (EEG).
Extracellular recordings from the RE were obtained using tungsten varnish-insulated microelectrodes (120 μm OD; FHC) or platinum–tungsten quartz insulated microelectrodes (40 μm OD) pulled to a fine tip and mechanically sharpened using a diamond grinding wheel (Reitboeck, 1983). The impedance of both types of electrodes was 1–3 MΩ at 1000 Hz. Custom-made, lightweight (2.5 g) manual single-axis micromanipulator, chronically mounted on the cat's head, was used to advance the microelectrode. Signals from the micro-electrode were pre-amplified with a miniature, custom-made preamplifier positioned on the cat's head, and then further amplified and filtered (0.3–10 kHz bandpass) with the CyberAmp 380 (Axon Instruments). After amplification, signals were digitized with a sampling frequency of 30 kHz and recorded using a computerized data acquisition package (Power-1401/Spike-2 System; Cambridge Electronic Design). An example of recording from an RE neuron during locomotion is shown in Figure 1B.
Identification of neurons.
The characteristic feature of RE neuron activity is bursts of spikes occurring during sleep, within which the frequency of spikes first rises and then declines (Domich et al., 1986; Contreras et al., 1993; Steriade et al., 1993). Such bursts are typically separated by ∼100 ms periods of inactivity, and consist of a dozen or more spikes with interspike intervals as short as 2–6 ms. They have been documented to reflect activation of the low-threshold Ca2+ current (Huguenard and Prince, 1992; Bal and McCormick, 1993).
These “RE-type” bursts during sleep were our main criterion for identification of RE neurons. An example of RE-type bursting is shown in Figure 2. When cats were sitting with their heads restrained, they quickly fell asleep. Within 10–15 min, periods of slow-wave sleep characterized by 6–15 Hz oscillations or “spindle waves” in EEG could be typically observed, followed by periods of rapid eye movement (REM) sleep characterized by rapid eye movements, movements of limbs and tail, and desynchronized activity in the EEG. In Figure 2B, an arrow points to the beginning of “spindle waves” in EEG (i.e., beginning of sleep). Shortly thereafter, dense, first ramping up and then winding down in discharge frequency, bursts of spikes appeared in the activity of the neuron (Fig. 2C).
Figure 2.

Identifying RE neurons by characteristic profile of their bursts during sleep. A, Cat sleeping with its head restrained. B, An example of activity of an RE neuron while the cat is awake and asleep. At the beginning of the record desynchronized activity in the EEG indicates that the cat was awake, and the neuron was discharging fairly regularly. The arrow points to the beginning of “spindle waves” in the EEG, which are a sign of the beginning of slow-wave sleep. Shortly thereafter very high frequency irregular bursts separated by long periods of inactivity replaced the regular discharge of the neuron. C, Close-up on a burst. The first interspike interval in this burst was longer than the second one, and the second interval was longer than the third. Several following interspike intervals were of an approximately similar duration, while the last ones were progressively longer. The lower trace shows change of discharge frequency within the burst. Such a burst with ramping up and then winding down firing rate identifies this neuron as belonging to the RE.
Neurons in the motor section of the RE receive monosynaptic inputs from both the MC and VL (for review, see Jones, 2007). Thus, to determine whether recordings were obtained from the motor-related section of the RE we tested responses of neurons to electrical stimulation of MC areas (MCdist, MCprox, and MChind) and the motor thalamus (VL). Rectangular 0.2 ms long pulses of 0.1–1.0 mA (cortex) or 0.1–0.5 mA (VL) intensity were used. In addition, responses to a similar stimulation of the premotor area 6, and the forelimb representation in somatosensory areas 1–2 were recorded (Fig. 3A). To differentiate between antidromically and orthodromically evoked spikes the collision test was used (Bishop et al., 1962; Fuller and Schlag, 1976; Marlinski et al., 2012).
We considered neurons to be of the RE motor section and included them in the database if they discharged RE-type bursts during sleep, responded to stimulation of the VL and/or at least one site in the MC, and did not respond antidromically to stimulation of any site in the cortex. Neurons that were not tested during sleep but were located within 0.1 mm from a RE-bursting neuron and satisfied other criteria were also included.
The somatic receptive fields of RE neurons were examined in animals resting with their head restrained. Somatosensory stimulation was produced by stroking fur and palpation of the muscle bellies and tendons, as well as by passive joint movements. Movements in the joints were recorded using Visualeyez System (3D Real Time Motion Capture and Analysis System, Phoenix Technologies), which detects 3D positions of light-emitting photodiodes and calculates various kinematical parameters. The photodiodes were attached to the skin projections of the main forelimb joints, and sampling frequency was 250 Hz. An example of an RE neuron response to passive elbow flexion is shown in Figure 3E.
Waveform analysis was used to discriminate and identify spikes of individual neurons using the Power-1401/Spike-2 system waveform-matching algorithm.
Processing of neuronal activity.
From each run down a corridor, two or three strides made in the middle of the walkway were selected for the analysis. Strides in the middle of the corridor are typically made at a nearly constant speed, and their average length during flat surface and ladder locomotion is identical (Beloozerova et al., 2010). To compare the activity of neurons during the two locomotion tasks we selected only strides whose average duration in the two tasks differed by <10%. The onset of swing phase was taken as the beginning of the step cycle. The duration of each step cycle was divided into 20 equal bins, and a phase histogram of spike occurrences in the cycle was generated and averaged over all selected cycles. The discharge frequency in a bin was derived according to the method of Udo et al. (1982), which averages the instantaneous frequency of interspike intervals that fall within the bin and also accounts for those intervals that overlap with the bin's beginning and end. The phase histograms were smoothed by recalculating the value of each bin as follows: F′n = 0.25Fn−1 + 0.5Fn + 0.25Fn+1, where Fn is the original value of a bin. The first bin was considered to follow the last one; the last bin was considered to precede the first one.
The coefficient of stride-related frequency modulation of neuronal activity, the “depth” of modulation (dM) was calculated using the histogram. It was defined as dM = (Nmax − Nmin)/N × 100%, where Nmax and Nmin are the number of spikes in the maximal and the minimal histogram bin, respectively, and N is the total number of spikes in the histogram. Neurons with M > 4% were judged to be stride related. This criterion, which is based on an analysis of fluctuation in the activity of neurons in the resting animal, was adopted from our previous studies in the VL (Marlinski et al., 2012). In addition to dM, the difference between the minimal and maximally active bins was calculated to characterize the modulation in spikes per second.
In stride-related neurons, the portion of the cycle, in which the discharge rate exceeded the minimum plus 25% of the difference between the maximal and minimal rates in the histogram, was defined as a “period of elevated firing” (PEF; see Fig. 6B) (Sirota et al., 2005). PEFs were smoothed by renouncing all one-bin peaks and troughs (a total of 1% of bins were altered throughout the database). In neurons with a single PEF, the “preferred phase” of discharge was calculated using circular statistics (Batshelet, 1981; Drew and Doucet, 1991; Fischer,1993; Beloozerova et al., 2003; Sirota et al., 2005).
Figure 6.

Activity of one-PEF neurons during locomotion. A, B, G, H, Example of activity of a typical neuron during walking on the flat surface (A, B) and along the horizontal ladder (G, H). The activity is presented as a raster of 45 step cycles (A, G) and a histogram (B, H). In the rasters, spike occurrences are indicated with dots, the duration of strides is normalized to 100%, and the steps are rank ordered according to the duration of the swing phase. The end of swing and the beginning of the stance in each cycle is indicated by an open triangle. In histograms, the horizontal interrupted line indicates the average discharge frequency during standing. The horizontal black bar shows the PEF, and the circle indicates the preferred phase. C, I, Distribution of preferred phases of activity of all one-PEF neurons during simple (C) and ladder (I) locomotion. D, J, Proportion of active neurons (neurons in their PEF) in different phases of the step cycle during simple (D) and ladder (J) locomotion. E, K, The mean discharge rate of neurons during simple (E) and ladder (K) locomotion. Thin lines show SEM. F, L, Phase distribution of PEFs during simple (F) and ladder (L) locomotion. Each horizontal bar represents the location of PEF of one neuron (shown in black in one cycle only) relative to the step cycle. Neurons are rank ordered so that those active earlier in the cycle are plotted on the top of the graph. Vertical solid lines highlight one cycle. Vertical interrupted lines denote end of swing and beginning of stance phase.
“Bursts” of spikes, which were assumed to reflect activation of the low-threshold Ca2+ current (Huguenard and Prince, 1992; Bal and McCormick, 1993), were identified according to criteria of Steriade et al. (Domich et al., 1986). Each burst included 5–25 spikes with preburst interval >100 ms, and the sum of the first five interspike intervals in the burst <100 ms. Within the burst, the second interspike interval had to be shorter than the first one. For every neuron exhibiting bursts, a phase histogram of burst occurrences in the step cycle was generated and averaged over all selected cycles.
For comparisons of mean firing rates of individual neurons in different tasks and between groups of neurons, a two-tailed t test was used (a priori). For comparisons of dM, preferred phase, and duration of PEF during different tasks, differences ≥20%, 15%, and 15%, respectively, were considered significant. These criteria were established using a bootstrapping statistical resampling technique (Efron and Tibshirani, 1993; Marlinski et al., 2012). The nonparametric χ2 test was used for an a priori comparison of categorical data. For all the tests, the significance level was set at p = 0.05. Unless indicated otherwise, for all mean values the SD is given.
Histological procedures.
At the termination of experiments, cats were deeply anesthetized with pentobarbital sodium, and reference electrolytic lesions were made in the areas of recording and stimulation. Cats were perfused with isotonic saline followed by a 3% paraformaldehyde solution. The brains were blocked, and frozen brain sections of 50 μm thickness were cut in the regions of recording and stimulating electrodes. Every fourth section was mounted on slides and stained for Nissl substance with cresyl violet. Positions of electrode tracks were estimated using the reference lesions. In cat 2, seven weeks before the animal's was killed, 0.5 μl of 10% aqueous suspension of red fluorescent microspheres (Lumafluor) were injected into the most rostrolateral part of the explored area in the RE. In this cat, adjacent sections were mounted on slides and cleared with acetone and xylene for observation of cells retrogradely labeled with red fluorescent beads. Microscopy was done with Neurolucida 8, Zeiss Axioscope, and AxioCamMR3 (Carl Zeiss) using a rhodamine filter. Locations of retrogradely labeled neurons were marked on digital images of brain sections using a computerized plotting system (Image Tracer; Translational Technology).
Results
Location of neurons
The activity of 112 RE neurons was recorded in two cats walking on the flat surface and along the horizontal ladder. In both cats, cells were collected from the rostrolateral compartment of RE at approximate coordinates: A 11.75–12.5, L 5.5–7.0, and V 1.0–4.0. In Figure 4 the recording sites, combined from two cats, are shown on frontal sections of the thalamus of cat 2. In section A12.5, an arrowhead points to a reference electrolytic lesion and an arrow indicates the site of injection of red fluorescent beads that was made in one of the most rostrolateral recording tracks.
Figure 4.

Location of neurons recorded during locomotion. Estimated locations of neurons are combined from both cats and are shown by various symbols on frontal sections of the thalamus of the cat 2 (50 μm sections, cresyl violet stain). Different shaped symbols represent neurons with different receptive fields: ■, purple squares show neurons with somatosensory receptive fields on the shoulder (responding to passive movements in the shoulder joint and/or palpation of muscles on the back or neck); ♦, yellow diamonds show cells that were activated by movements in the elbow; ▴, red upfacing triangles represent neurons with receptive fields on the wrist or paw; ▾, green downfacing triangles show neurons whose receptive field encompassed the entire forelimb; ○, white circles denote neurons without somatosensory receptive fields;  , gray circles show neurons whose receptive fields were not tested; ★, stars indicate neurons with physiologically identified projection to the MC. In section A12.5, an arrowhead is pointing to a reference electrolytic lesion and an arrow indicates the site of injection of red fluorescent beads. A close-up to the injection site is shown in the insert. AM, nucleus anterior medialis; AV, nucleus anterior ventralis thalami; CI, capsula interna; DH, dorsal hypothalamus; EPN, nucleus entopeduncularis; MV, nucleus medial ventralis; NC, nucleus caudatus; RE, nucleus reticularis thalami; VA, nucleus ventralis anterior.
Somatosensory receptive fields
The somatosensory receptive fields of 82 neurons were tested. Nearly two-thirds of neurons (72%, 59/82) had a receptive field, all of which were located on the contralateral (right) forelimb and were excitatory. An example of a response of a neuron to passive extension of the elbow is shown in Figure 3E. Approximately a quarter of neurons (23%, 19/82) were activated by passive movements of the shoulder and/or palpation of muscles on the upper back. Nearly all of these cells had directional preference to shoulder movement, and either responded better to flexion or adduction (13/19) or to extension or abduction of the joint (6/19). Many other neurons had receptive fields on the paw or wrist or responded to passive movements of the wrist, typically in only one direction (22%, 18/82). The number of neurons responding to passive movement of the elbow was small (11%, 9/82), but each response was to extension rather than flexion. In addition, 15% (12/82) of neurons responded to stimulation of most of the forelimb. In Figure 4 cells with different receptive fields are depicted with different shapes. There was a coarse dorsoventral topography. Caudally, cells with receptive fields involving the shoulder were located dorsal to neurons whose receptive fields involved the wrist/paw (Fig. 4, sections A12.0 and 11.75). Rostrally, although there was intermingling, analysis of the mean dorsoventral positions of these cell groups indicated the topography continued with shoulder-related cells dorsal to wrist/paw-related cells (p < 0.05, t test). Neurons that did not respond to somatosensory stimuli were located predominantly in the most rostral aspect of the sampled area (Fig. 4, sections A12.0 and A11.75).
Afferent connections with cortex and thalamus
The overwhelming majority of cells tested for synaptic responses to electrical stimulation of the cortex or VL (92 and 90%, respectively) responded vigorously (Fig. 3B,D). The response was nearly always complex. A single shock applied to the cortex or VL elicited a sequence of several spikes with interspike intervals of 2–6 ms. Within neurons, latencies to the first spike in response to stimulation of the cortex and VL were similar and were in a range of 1–8 ms (5.1 ± 1.4 ms in cat 1 and 3.0 ± 0.9 ms in cat 2). This short latency response was followed by a 120–150 ms period of silence, after which another barrage of high-frequency discharge occurred. Cells differed in the combinations of cortical areas that were effective. One-third of neurons (30/95 or 32%) responded to stimulation of all sites within the MC (MCdist, MCprox, and MChind) and also responded to stimulation of area 6. Almost a quarter of cells (21/95, 22%) responded to stimulation of all of the MC, but not to area 6. More than one-third of cells (35/95, 36%) did not respond to stimulation of MCdist, but responded only to MCprox, occasionally in combination with MChind or area 6. Only 40% of neurons tested responded to stimulation of somatosensory cortex, and all but one in combination with a response to the MC.
Extensive afferent connections of the area of recordings with both the cortex and thalamus were also demonstrated by results of fluorescent tracings in cat 2. Red fluorescent beads injected into the most rostrolateral part of the explored area occupied a zone ∼0.5 mm in diameter (Fig. 4, insert in section A 12.5). Retrogradely labeled cells were found in deep layer VI over a very large extent of the frontal and parietal cortex (Fig. 5A–C). Most numerous, but somewhat spaced apart from each other, were cells in the MChind area within the fold of the postcruciate cortex and throughout the entire caudal cruciate gyrus and the caudal part of the lateral cruciate gyrus in areas 3a, 3b, 1, and 2, from the midline to approximately L12. In the fundus of the cruciate sulcus, as well as in the MCprox and MCdist areas in the precruciate cortex, labeled cells were spaced still further apart, as they also were in area 5a and rostral area 5b of the parietal cortex.
Figure 5.

Cortical and thalamic projections to the area of recording in the RE. A–C, Neurons in the motor and somatosensory cortex in cat 2, retrogradely labeled with red fluorescent beads. On photomicrographs of parasagittal sections of the left cortex ipsilateral to the injection site the layer of most densely labeled neurons is highlighted with a bold red line, whereas positions of more sparsely labeled cells are shown with interrupted lines. Approximate positions of these sections are indicated by (A–C) arrows in Figure 3A. Arrowheads in A and B point to reference lesions made with stimulation electrodes in the MC. An arrow in A points to a zone that is shown in the insert. Cru, cruciate sulcus; Ans, ansate sulcus; Sig.p., sigmoid gyrus posterior. D–F, Neurons in the VL and VPL in cat 2, retrogradely labeled with red fluorescent beads. Neurons are shown on photomicrographs of frontal sections of the left thalamus ipsilateral to the injection site. Each circle represents one labeled neuron. CL, nucleus centralis lateralis; LA, nucleus lateralis anterior; LG, lateral geniculate nucleus; LP, nucleus lateralis posterior; OT, optic tract; PC, pedunculus cerebri; VL, nucleus ventralis lateralis; VM, nucleus medialis; VPL, nucleus ventralis posterior lateralis; VPM, nucleus ventralis posterior medialis; others are the same as in Figure 4.
In the thalamus, posterior to the injection site, labeled cells extended through VL from A11 to A9 (rostral border of lateral geniculate nucleus), mediolaterally from 3.5 to 5.5 and vertically from 0.5 to 3.0 (Fig. 5D–F). In addition, labeled cells were observed in a part of the ventral posterolateral nucleus (VPL) that is adjacent to the VL. Finally, a group of labeled neurons was found in the ipsilateral dorsal hypothalamus at coordinates of A 11.0–11.5, and a couple of labeled cells were seen in the ipsilateral entopeduncular nucleus.
Characteristics of locomotion
During recording from each neuron, cats walked between 10 and 50 (21 ± 8) times down each of the corridors. From these trials, 15–80 strides (35 ± 14) of each locomotion task (on the flat surface and along the ladder) were selected for the analysis according to criteria outlined (see Materials and Methods). For different neurons, the average duration of selected strides was between 650–850 ms, which corresponded to a walking speed of 0.6–0.8 m/s. The ratio of stance duration to the duration of the cycle (the stride duty factor) was 0.50–0.66. The gait that cats used during walking both on flat surface and along the ladder was a walk with the support formula 2-3-2-3-2-3-2-3, which indicates the number of limbs in support during different phases of the step cycle (Hildebrand, 1965). Details of biomechanics and muscle activities in cats during walking on the flat surface and along the horizontal ladder in a similar experimental setup were recently reported (Beloozerova et al., 2010). In short, ladder locomotion is similar to simple locomotion in nearly all kinematic and electromyographic (EMG) parameters; the few forelimb-related differences include a somewhat more bent-forward posture, a lower wrist flexion moment during stance, an increased flexion in the metacarpophalangeal joint, and slightly enhanced activity of selected distal muscles during ladder locomotion.
Activity during locomotion on the flat surface
While the cat was standing, all RE neurons were active. The mean discharge rate varied from 0.5 to 50 spikes/s (17.6 ± 11.5). Neurons with and without somatosensory receptive fields had similar average activity. Upon transition from standing to walking, the discharge rate of many neurons changed. For 52% of neurons, the rate increased (by 50–500%), and for 15% the rate decreased (by 20–80%). This yielded an average activity increase in the population to 23.6 ± 13.6 spikes/s (p = 0.0004, t test), with the largest among neurons whose receptive field included the wrist or paw (p < 0.05, t test). Somatosensory unresponsive neurons changed the activity similarly to neurons with shoulder-related receptive fields (p > 0.05, t test).
During locomotion, the discharge of 88% (99/112) of neurons was modulated with respect to the stride: it was greater in one phase of the stride and smaller in another phase. Relative to neurons without receptive fields, the activity of neurons with somatosensory receptive fields were more likely to be modulated to strides (χ2 test, p = 0.0015). As defined above, the period of increased activity during the stride was denoted as a PEF. Most neurons (68%, 67/99) had one PEF per step cycle, 30% (30/99) had two, and two neurons had three PEFs. The most rostral portion of the sampled area shown in Figure 4, section A12.5 was occupied almost exclusively by one-PEF neurons, which was different from the rest of the area where one- and two-PEF neurons were intermingled (χ2 test, p < 0.046). Between groups of cells with different somatosensory receptive fields proportions of neurons with one and two PEFs were similar.
Activity of a representative neuron with one PEF during simple locomotion is shown in Figure 6A,B. This neuron responded to passive flexion and extension of the shoulder. During locomotion, it was highly active during the end of swing and beginning of stance phase and less active at the end of stance phase and beginning of swing. This pattern of activity was consistent across many strides, as seen in the raster of spikes during 45 strides (Fig. 6A). The maximum discharge rate of the neuron was 102 spikes/s (Fig. 6B). The PEF of the neuron is indicated in Figure 6B by a solid black horizontal line, and the preferred phase of the activity is depicted with a circle.
Figure 6F shows phase positions within the step cycle of PEFs and preferred phases of all one-PEF neurons. PEFs of different neurons were widely distributed over the cycle with more cells active during the swing phase. Distribution of preferred phases is summarized in Figure 6C. Duration of PEFs varied between neurons in the range of 20–90% (62 ± 16%) of the cycle. Due to a relatively long duration, the PEFs of different neurons overlapped, and 30–80% of neurons were simultaneously active at any time within the cycle (Fig. 6D). However, more neurons had a PEF during the end of stance and beginning of swing phase than during beginning of stance (χ2 test, p = 0.0007). As a result, the average discharge rate of the population was markedly greater during end of stance and beginning of swing as compared with the first half of stance (t test, p = 0.0001; Fig. 6E). The magnitude of the stride-related modulation of the discharge rate also varied between neurons. Whereas ∼10% of cells was completely silent for a part of the step cycle, the majority were active throughout the cycle with a modulated discharge rate. The average difference between the minimal and maximal discharge rates during the cycle was 41 ± 30 spikes/s, and the dM was 9.2 ± 4.3%.
The activity of a typical neuron with two PEFs per stride is shown in Figure 7A,B. This neuron responded to passive extension of the shoulder and elbow and dorsal flexion of the wrist. The neuron was highly active during the end of stance and in addition had a smaller peak in activity during the transition phase between swing and stance. The maximum discharge rate of the neuron was 50 spikes/s (Fig. 7B). Figure 7E shows phase positions within the step cycle of PEFs and preferred phases of all two-PEF neurons. By the phase and duration of their PEFs, these neurons could be loosely subdivided into three groups. The first group included cells that had their longest PEF during swing—the “swing” neurons. PEFs of these neurons are concentrated in the upper third of the graph. The second group consisted of cells that had their longest PEF during stance and the shortest PEF at the end of swing—the “stance” neurons. PEFs of these neurons are concentrated in the lower part of the graph. In both swing and stance neurons, the longer PEF was typically also the stronger one, as the discharge rate in it exceeded that in the shorter PEF by 10 ± 3 spikes/s. The third group included neurons whose two PEFs were of approximately similar duration. In these “transition” neurons, the first PEF typically started in mid-swing and lasted into stance, while the second PEF started in the mid-stance and continued into swing. In Figure 7E, PEFs of transition neurons are in the middle of the graph. Within the population of two PEF neurons, substantially more neurons were active during transition from stance to swing and from swing to stance than neurons active in mid-swing and mid-stance (χ2 test, p < 0.05). As a result, the averaged discharge rate of this population was greater during swing–stance and stance–swing transition phases as compared with mid-swing and mid-stance periods (t test, p = 0.0014; Fig. 7D).
Figure 7.

Activity of two-PEF neurons during locomotion. A, B, F, G, Example activity of a typical neuron during walking on the flat surface (A, B) and along the horizontal ladder (F, G). The activity is presented as a raster of 25 step cycles (A, F) and as a histogram (B, G). In rasters, spike occurrences are indicated with dots, whereas the end of swing and the beginning of the stance phase in each cycle is indicated by an open triangle. In histograms, the horizontal interrupted line indicates the average discharge frequency during standing; the horizontal black bar shows PEFs. C, H, Proportion of active neurons (neurons in their PEF) at different phases of step cycle during simple (C) and ladder (H) locomotion. D, I, The mean discharge rate during simple (D) and ladder (I) locomotion. Thin lines show SEM. E, J, Phase distribution of PEFs during simple (E) and ladder (J) locomotion. Each trace shows PEFs of one neuron (shown in black in one cycle only). Vertical solid lines highlight one cycle. Vertical interrupted lines denote the end of swing and beginning of stance phase.
There were substantial differences in stride-related activity between neurons with different receptive fields (Fig. 8, one- and two-PEF cells are considered jointly). The lowest average discharge rate was associated with neurons whose receptive fields were located on the shoulder (22.6 ± 3.1 spikes/s; mean ± SEM), slightly increasing among those sensitive to movements of the elbow (24.5 ± 3.5 spikes/s), and greatest among those whose receptive field was on the wrist and/or paw (31.4 ± 3.0 vs 22.6 ± 3.1 spikes/s; p < 0.05, t test). The average maximal discharge rate of wrist/paw neurons was nearly twice as high as compared with either shoulder- or elbow-related cells (76.6 ± 9.2 vs 43.4 ± 5.3 or 44.8 ± 6.0 spikes/s, respectively; mean ± SEM; p = 0.004, t test). Neurons with receptive fields on the wrist/paw were not only more active, they were also more modulated (12.5 ± 1.1 vs 8.0 ± 0.6 or 8.4 ± 0.9%; mean ± SEM; p < 0.01, t test). Further, their PEFs were shorter (54 vs 66% of the step cycle; p = 0.036, t test). Finally, there was a prominent difference between phase positions during the stride of PEFs of cells with different receptive fields. PEFs of wrist/paw-related cells promptly terminated at the end of the swing phase and did not restart before the middle of the stance. In contrast, PEFs of shoulder- and elbow- related neurons were distributed more evenly across the cycle. Both the wrist/paw- and shoulder-related neurons had highest mean discharge rates during swing (averaging 42 and 24 spikes/s, respectively) and lowest during stance (averaging 12 and 17 spikes/s, respectively). This yielded a dramatic difference in population frequency modulation across the step cycle of 30 spikes/s for the wrist/paw-related neurons and only 7 spikes/s for the shoulder-related neurons (Fig. 8A3,C3; p = 0.001, t test). The activity of nonresponsive neurons was fairly evenly distributed across the cycle. The average discharge rate and dM of these cells was similar to those of neurons with shoulder-related receptive fields (p > 0.05, t test).
Figure 8.
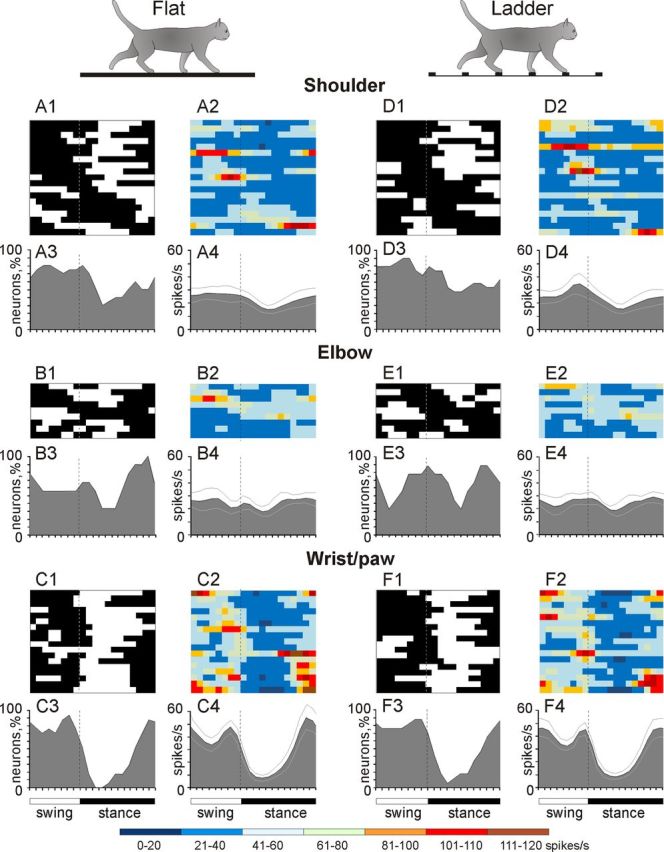
Stride-related activity of neurons with receptive fields on different forelimb segments. A, D, Activity of neurons responsive to movements in the shoulder joint and/or palpation of back, chest, or neck muscles during simple (A) and ladder (D) locomotion. A1, D1, Phase distribution of PEFs. A2, D2, Corresponding phase distribution of discharge frequencies. The average discharge frequency in each 1/20th portion of the cycle is color coded according to the scale shown at the bottom of the figure. A3, D3, Proportion of active neurons (neurons in their PEFs) in different phases of the step cycle during simple (A3) and ladder (D3) locomotion. A4, D4, The mean discharge rate during simple (A4) and ladder (D4) locomotion. Thin lines show SEM. Vertical interrupted lines denote end of swing and beginning of stance phase. B, E, Activity of neurons responsive to passive movement of the elbow joint during simple (B) and ladder (E) locomotion. C, F, Activity of neurons responsive to stimulation of the paw or movement in the wrist joint during simple (C) and ladder (F) locomotion. B1–B4 and C1–C4 are analogous to A1–A4 and E1–E4 and F1–F4 are analogous to D1–D4.
Activity during locomotion along horizontal ladder
During walking along the ladder cats stepped accurately on tops of the crosspieces showing much less spatial variability in feet placement compared with simple locomotion (Beloozerova et al., 2010). The activity of 99 neurons with stride-related modulation during simple locomotion was also modulated in the rhythm of strides during walking along the ladder; while the activity of the other 13 neurons remained unmodulated during both tasks. The same two patterns of activity modulation were observed in proportions similar to those seen during simple locomotion: the one-PEF pattern was found in 71% (70/99) of neurons, and the two-PEF pattern was seen in 29% (29/99). There were also two neurons with three PEFs. Most neurons had a similar pattern during both locomotion tasks, but in some neurons the pattern was different.
The activity of a representative one-PEF neuron during ladder locomotion is shown in Figure 6G,H. This activity can be compared with the activity of the same neuron during simple locomotion (Fig. 6A,B). During ladder locomotion, discharge of the neuron during the first half of swing decreased, increasing during the second half of swing to 123 spikes/s. As a result, the magnitude of modulation of the neuron's discharge was larger during ladder locomotion than simple locomotion and the PEF was shorter. An example of activity of a neuron with two PEFs per stride during ladder locomotion is shown in Figure 7F,G. This is the same neuron whose activity during simple locomotion is shown in Figure 7A,B. During ladder locomotion, discharge rate of the neuron increased during both PEFs, but periods between them were unchanged. As a result, the magnitude of modulation of the neuron' discharge was larger during ladder locomotion compared with simple walking.
Upon transition from simple to ladder locomotion, 75% of neurons (one- and two-PEF neurons considered together) changed at least one characteristic of their activity. For 15% of neurons, the transition from simple to ladder locomotion increased the average discharge rate (average increase +40%). For 18% of neurons this transition caused a decrease in average rate (average decrease −35%). The maximal discharge rate was also affected in the transfer from simple to ladder locomotion. For 19% of neurons the maximal rate increased (average increase +52%, +20.4 spikes/s) and for 18% of neurons the maximal rate decreased (average decrease −23%, −18 spikes/s).
Substantial changes were also observed in the magnitude of frequency modulation. In a quarter of neurons (24%) the dM increased during locomotion on the ladder compared with simple walking, on average by 66 ± 42%. In addition, it decreased in 16% of neurons by 30 ± 13% on average. The duration of the PEF changed in 25% of neurons, decreasing in 15% and increasing in 10% of them by 20–50% of the cycle.
In 19 neurons the number of PEFs per cycle changed upon transition from simple to complex locomotion. Among neurons with two PEFs during simple locomotion one-third (10/30) had one PEF during walking on the ladder. In most of these cells it was because one of gaps between the PEFs was filled with activity during walking on the ladder. Also, 13% (9/67) of neurons that had one PEF during simple locomotion had two PEFs during walking along the ladder. Most of these cells already had two subtle subpeaks in their activity during simple locomotion, and during complex locomotion those subpeaks intensified and now each qualified as a PEF. Finally, in 11/60 neurons that had one PEF during both locomotion tasks the preferred phase of activity changed during walking on the ladder compared with simple locomotion by 15–25% of the cycle, typically shifting from late stance phase to early swing (n = 4) or from early swing phase to late stance (n = 4).
Because different neurons often changed their discharges between two locomotion tasks in opposing ways, population activities of both one- and two-PEF neurons during walking on the ladder were rather similar to those observed during simple locomotion (Figs. 6, 7). The only exception was a less pronounced dip in the activity of two-PEF neurons in the first half of stance during ladder locomotion compared with simple walking (Fig. 7, compare C, H; p = 0.02, χ2 test; or Fig. 7, D, I; p = 0.037, t test). Thus, during the ladder task, two-PEF neurons had a lower difference between the minimal and maximal discharge rate compared with one-PEF cells (32.4 ± 20.7 vs 45.5 ± 29.9 spikes/s; p = 0.034, t test).
During ladder locomotion, similarly to flat surface locomotion, there were substantial differences in the activity between neurons with different receptive fields (Fig. 8). PEFs of shoulder-related and nonresponsive neurons were distributed rather evenly across the cycle (Fig. 8D1–D4), and their average and peak discharge rates were relatively low (in shoulder-related cells 23 ± 3.3 and 42.8 ± 6.1 spikes/s (mean ± SEM), respectively). They also had low average dM (8 ± 1% or 34.1 ± 5.1 spikes/s, mean ± SEM) and long PEFs (70 ± 3% of the cycle, mean ± SEM). In stark contrast, wrist/paw-related cells discharged most intensively during swing and end of stance mostly sparing the first half of stance (Fig. 8F1–F4). They tended to be more active (29 ± 3.4 spikes/s, mean ± SEM), were much more modulated than neurons of any other group (12.4 ± 1.2% or 65 ± 7.4 spikes/s, mean ± SEM; p < 0.005, t test), and had the shortest PEFs (55 ± 4.5% of the cycle; p = 0.007, t test, mean ± SEM). The activity characteristics of elbow-related neurons were in between those of shoulder- and wrist/paw-related cells. As a population, during ladder locomotion, elbow-related neurons reached the maximal discharge rate during transition phase from swing to stance, similarly to their activity during simple walking (Fig. 8E1–E4).
Neurons with different receptive fields tended to react differently to the change in locomotion task. When the cat transferred from simple to ladder locomotion, neurons whose receptive fields were shoulder-related tended to increase both their activity and dM, while wrist-related cells tended to decrease the activity and dM. Whereas these trends did not reach significance, a comparison between all cells with somatosensory receptive fields and those without fields showed that upon transition from simple to ladder locomotion neurons without fields more often increased the dM and more often decreased the duration of their PEF (χ2 test, p < 0.05).
Wrist/paw-related neurons often discharge RE-type bursts during locomotion
Wrist/paw- and shoulder-related cells differed sharply in their inclination to produce sleep-like spike bursts both during standing and locomotion. Figure 9 shows representative examples. A shoulder-related neuron shown on the left exhibited tonic activity during standing (Fig. 9A). During walking, its activity was modulated with respect to the step cycle, but otherwise was rather regular (Fig. 9B,C). The regularity of the discharge is revealed in Figure 9D, in which, for each spike, an interspike interval that preceded it (abscissa) is plotted against interspike interval that followed the spike (ordinate). The “cloud” in the middle of the plot shows that the activity of the neuron was mostly tonic; the small “puffs” on the right and top are attributable to the breaks in the activity associated with the early stance phase (Fig. 9C). This firing behavior contrasted sharply with that of a wrist/paw-related neuron shown on the right (Figs. 9E–H). During standing, the activity of this neuron was irregular and contained bursts of spikes (Fig. 9E). During locomotion its activity was also modulated in relation to the step cycle; however, after a period of silence during stance, this neuron often discharged bursts of spikes (Fig. 9F,G). These bursts led to a considerably different before/after interspike interval plot (Fig. 9H). The cloud is positioned closer to the origin of coordinates indicating many pre/postintervals well below 10 ms. At the same time, the right puff is much closer to the abscissa showing many long intervals, which were followed by a short one. The cluster on the lower right of the plot represents the cardinal spikes of a burst. Inserts in Figure 9, E and F, present bursts at sufficient temporal resolution to illustrate that their structure both during standing (Fig. 9E) and locomotion (Fig. 9F) was similar to the signature RE-type bursts during sleep, in which the discharge frequency first increases and then decreases, and many intervals are <10 ms.
Figure 9.
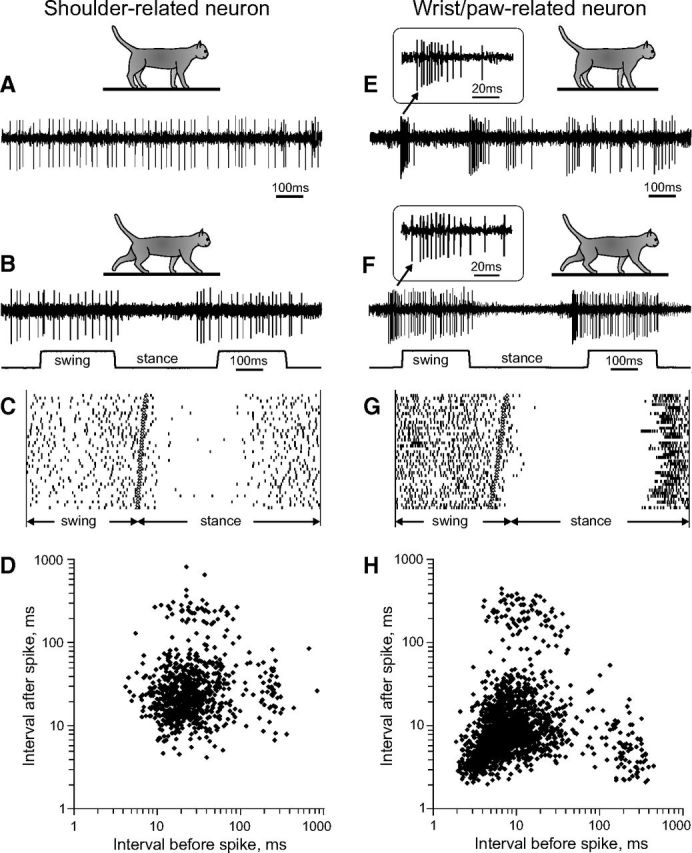
Accelerating–decelerating frequency sleep-type bursting during standing and locomotion. Two representative neurons with nonbursting (A–C) and bursting (D–F) discharges are shown. A, A neuron with a receptive field on the shoulder (#362) discharged regularly during standing. B, During locomotion, the activity of this neuron was modulated to strides but did not contain any sleep-type bursts. C, Raster plot of spikes of this neuron recorded during 40 step cycles. D, Interspike interval plot, for which the abscissa indicates the interval to the previous spike and the ordinate indicates the interval to the next spike. In the activity of the shoulder-related neuron interspike time intervals preceding and following each spike during walking were similar and varied within range of 8–80 ms. E, A neuron with a receptive field on the paw (#332a) during standing discharged sleep-type bursts with accelerating–decelerating discharge frequency. A burst is shown in the insert at a fast time scale. F, During locomotion, this neuron discharged similar bursts at the beginning of its locomotion-related PEFs. G, Raster plot of spikes of this neuron recorded during 40 step cycles. H, Interspike interval plot for the wrist/paw-related neuron. The points at the lower right represent first action potentials of the neuron that occurred after a period of silence longer than 100 ms and were followed by a spike with a time delay shorter than 6 ms, likely at the beginning of a burst. The points at the lower left represent action potentials that within the burst followed each other with 2–6 ms intervals.
All but one shoulder-related cell had relatively regular firing behavior during standing and locomotion, similar to that of the neuron shown in Figure 9, A–D. At variance, a significant portion of wrist/paw-related cells (39%, 7/18) discharged sleep-type bursts during standing and walking, similar to those shown in Figure 9, E–H. During walking, these bursts occurred more often at the beginning of PEF, which in wrist/paw-related cells typically started in the second half of the stance phase (Fig. 10A,C). The probability of burst occurrence varied between neurons, and in the most irregularly firing ones reached 35%, meaning that these neurons discharged a burst during every third step. The peak probability of bursts within the whole wrist/paw-related group was 5.4% during simple locomotion and 6.8% during ladder locomotion (Fig. 10B,D). The difference in these population averages did not reach the level of statistical significance (p = 0.07, t test). However, three individual neurons had a significantly higher probability to discharge a burst during ladder than simple locomotion (p = 0.001, t test).
Figure 10.

Stride-relation of bursts in the activity of neurons with receptive fields on the wrist/paw. A, C, Phase distribution of PEFs during simple (A) and ladder (C) locomotion with the average burst probability in each 1/20th portion of the cycle color coded according to the scale shown on the right. B, D, The mean burst probability in the population during simple (B) and ladder (D) locomotion. Thin lines show SEM. Vertical interrupted lines denote end of swing and beginning of stance phase.
Discussion
Genesis of locomotion-related discharge in the RE
Signals to the motor compartment of the RE come from two main sources: collaterals of thalamocortical neurons of the VL and collaterals of corticothalamic neurons of layer VI of the motor and somatosensory cortex (Fig. 5) (for review, see Jones, 2007). A comparison of discharges generated during locomotion in these two sources shows that the activity of the RE is very similar to that of the VL. Indeed, the overwhelming majority of VL neurons discharge rhythmically during locomotion (Marlinski et al., 2012). Their discharge rates are similar to those of RE neurons. VL cells show the same two basic patterns of stride-related frequency modulation, with one or two PEFs, in proportions similar to those observed in the RE. The average duration of PEFs and dM in VL and RE neurons are also similar. Moreover, VL cells with receptive fields involving different joints, similarly to their counterparts in the RE, tend to have PEFs in different phases of the stride. There is, however, a significant difference in this last aspect between VL and RE neurons: while shoulder-related cells in both nuclei discharge mostly in phase (Fig. 11, data on activity of VL neurons; Marlinski et al., 2012), VL and RE elbow-related cells are active essentially in anti-phase (Fig. 11, dark shaded periods), and populations of wrist/paw-related neurons in VL and RE have activity patterns that are neither in phase nor in antiphase. This suggests differences in either internal or external design for circuits associated with the shoulder versus wrist/paw.
Figure 11.
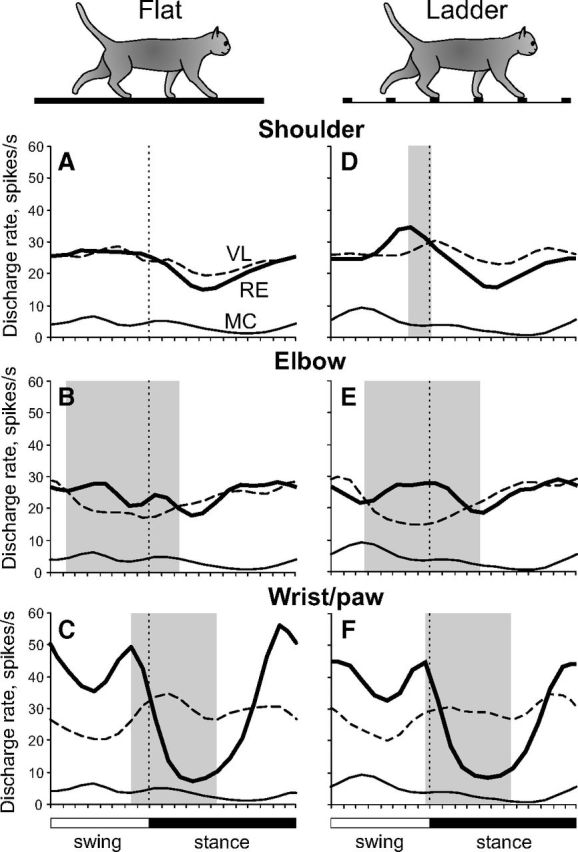
Differential gating of thalamocortical signals by RE during locomotion. A–F, Thick lines show population activities of shoulder-, elbow-, and wrist/paw-related neurons of the RE; interrupted lines show activities of corresponding VL neurons (from Marlinski et al., 2012); and thin lines show the population activity of CF6 neurons of the MC (from Sirota et al., 2005). Shaded are periods of the step cycle when the activities of the RE and VL were in antiphase. Data on the activity of VL and CF6s neurons were obtained in exactly similar experiments albeit conducted on different sets of cats.
In contrast to VL and RE neurons, only approximately one-third of corticofugal neurons of layer VI of the MC (CF6s) during locomotion discharge in synchrony with strides (Sirota et al., 2005). Their discharge rates average ∼1 spike/s, 20 times lower than those of either VL or RE neurons. The magnitude of modulation in CF6s is enormous, much greater than in RE or VL cells. In addition, PEFs of CF6s neurons are brief, ∼35% of the cycle, half the duration of PEFs of either RE or VL neurons. Finally, CF6s typically discharge only one PEF per cycle and almost always lack somatosensory receptive fields. Thus, CF6 neurons are unlikely to drive RE neurons in any transparent way. However, CF6s form a massive (Fig. 5A) and effective (Fig. 3B) input to the RE (for review, see Jones, 2007). Their contribution must play a role in excitation of RE cells, especially during periods when VL neurons are relatively inactive. A convergent influence on a single RE neuron of several CF6 cells with PEFs at slightly different phases of the stride may result in the observed patterns of activity in RE neurons during those periods. In the visual system, both the cortex and relay thalamic nucleus contribute to the formation of responses of neurons in visual compartment of the RE (for review, see Sillito and Jones, 2008).
Effect of RE activity on transmission of thalamocortical signals
The fact that the activity of the RE, both at individual neurons and populations of neuron levels, changes with the phase of the stride (Figs. 6, 7) indicates that during different stride phases RE exerts different influences upon the VL. The activity of one-PEF cells is nearly double in the intensity during the late stance and swing phases compared with early stance (Fig. 6E). The consequence is maximal suppression of target VL neuron activity and minimal thalamocortical signaling during this period. Such a “pause” from the VL could permit nonthalamic inputs to periodically dominate motor cortical circuits. In contrast, during early stance phase when the activity of one-PEF neurons is the lowest and thus their target VL cells are disinhibited, more ascending information passes through the thalamus to the MC allowing the thalamus a larger contribution to the cortical output during this period.
RE neurons with receptive fields on different segments of the limb, presumably related to control of different segments of the limb, act differently during locomotion. Wrist/paw-related neurons greatly exceed both shoulder- and elbow-related cells in the magnitude of their population activity modulation (Fig. 8). They also have the highest discharge rates and greatest depths of frequency modulation in discharges of individual neurons while the shoulder-related cells have the lowest ones. Thus, the VL to MC signal transmission in the distal limb domain is the most heavily regulated by the RE and least regulated in the proximal limb.
The distal to proximal limb gradient in RE–VL influences appears to be hard-wired in the physiology of RE neurons as shoulder- and wrist/paw-related cells show different biophysical properties. While wrist/paw-related cells often discharge characteristic sleep-type bursts of spikes, which evidences their inclination to generate low-threshold Ca2+ spikes even during such an active act as locomotion, shoulder-related cells burst in this manner much less frequently (Figs. 9). In thalamocortical slices of 10- to 28-d-old rats, Lee et al. (2007) found that neurons in the ventral region of the RE (where in the cat we have found the most wrist-related cells; Fig. 4) discharge acceleration–deceleration high-frequency bursts, while the majority of neurons in the dorsal region (where in the cat we have found most shoulder-related cells; Fig. 4) lack such burst discharges. It was shown that the efficiency of high-frequency bursts of spikes considerably exceeds that of tonic discharges (Fanselow et al., 2001; Hartings et al., 2003; Reinagel et al., 1999; Swadlow and Gusev, 2001). In conjunction with the report of Fanselow et al. (2001) on bursting in the ventroposterior medial thalamic nucleus during small-amplitude whiskers movements, the reliable bursting during locomotion that we have observed provides additional evidence that the low-threshold burst mechanism can have a role in active behaviors.
The specific manner by which populations of RE and VL neurons interact appears to vary by the limb segment. The synchronous activity of shoulder-related RE and VL neurons during the step cycle (Fig. 11A) is likely to result in decreasing and sharpening of locomotion-related discharges of shoulder-related VL cells. Assuming that individual shoulder-related RE neurons synapse on shoulder-related VL cells that have PEFs during the same phase of the stride, the following chain of events can be imagined. An incoming volley of VL excitation triggers a feedback volley of inhibition from RE, truncating VL signals to cortex, but increasing their temporal precision. In contrast, elbow-related RE and VL neurons are active in antiphase (Fig. 11B). It appears that elbow-related RE cells are more concerned with the big picture of elbow-related VL neuron discharges by assuring that they do not fire during inappropriate step phases. A functionally similar relationship between the RE and thalamic relay nuclei was earlier reported in both visual and acoustic systems (Cotillon-Williams et al., 2008; Funke and Eysel, 1998).
The roles that the RE plays in regulation of the thalamocortical signal transmission are different during different locomotion tasks: 75% of neurons change at least one aspect of their activity upon transition from simple to ladder locomotion. What are those roles?
It was demonstrated that simple locomotion does not require participation of the MC or VL while complex locomotion does (Trendelenburg, 1911; Chambers and Liu, 1957; Liddell and Phillips, 1944; Beloozerova and Sirota, 1993a,b; 1998). Regarding the MC, we have previously suggested that the locomotion-related modulation of the activity of its neurons during simple locomotion has an informational character (Beloozerova and Sirota, 1993a). This modulation sets, for each individual neuron, the allowable phase of the cycle when a descending influence is permissible, and thus allows the MC to affect the spinal locomotor mechanism during corrections of movements in complex situations without interruption of the ongoing locomotor rhythm. It appears reasonable to extend this suggestion to both the VL and RE.
A correction of spinally generated locomotor rhythmicity is needed during walking along a ladder. During ladder locomotion, discharges in both the MC and VL appear to carry control signals for feet placement (Beloozerova and Sirota, 1993a; Sirota et al., 2005; Beloozerova et al., 2010; Marlinski et al., 2012). The RE seems to participate in shaping those signals. The mean and peak activities in 33–37% of RE neurons during complex locomotion are different from those during simple walking, which signifies differences in the intensity of regulation of the VL to MC transmission between two tasks. In the awake primate, it was similarly found that neurons in the visual compartment of the RE change (increase) amplitude of their visual stimulus-related responses, therefore affecting the lateral geniculate nucleus-to visual cortex signal transmission differently, when subjects actively attended to the stimulus (McAlonan et al., 2006). Differences in the dM in 40% of RE neurons mean differences in the salience of the RE to VL influence. Differences in the preferred phase, duration of PEFs, and/or in the number of PEFs mean differences in the timing of RE influences on the thalamocortical signal transmission, and these were often seen between two tasks. Altogether, this suggests a significant role of the RE in regulating signals passing from VL to MC during complex locomotion.
Footnotes
This research was supported by National Institute of Neurological Disorders and Stroke Grant R01 NS-058659 (I.N.B.). We are grateful to Peter Wettenstein for exceptional engineering assistance.
The authors declare no competing financial interests.
References
- Bal T, McCormick DA. Mechanisms of oscillatory activity in guinea-pig nucleus reticularis thalami in vitro: a mammalian pacemaker. J Physiol. 1993;468:669–691. doi: 10.1113/jphysiol.1993.sp019794. [DOI] [PMC free article] [PubMed] [Google Scholar]
- Batshelet E. Circular statistics in biology. New York: Academic; 1981. [Google Scholar]
- Beloozerova IN, Sirota MG. The role of the motor cortex in the control of accuracy of locomotor movements in the cat. J Physiol. 1993a;461:1–25. doi: 10.1113/jphysiol.1993.sp019498. [DOI] [PMC free article] [PubMed] [Google Scholar]
- Beloozerova IN, Sirota MG. The role of the motor cortex in the control of vigour of locomotor movements in the cat. J Physiol. 1993b;461:27–46. doi: 10.1113/jphysiol.1993.sp019499. [DOI] [PMC free article] [PubMed] [Google Scholar]
- Beloozerova IN, Sirota MG. Cortically controlled gait adjustments in the cat. Ann NY Acad Sci. 1998;860:550–553. doi: 10.1111/j.1749-6632.1998.tb09101.x. [DOI] [PubMed] [Google Scholar]
- Beloozerova IN, Sirota MG. Integration of motor and visual information in the parietal area 5 during locomotion. J Neurophysiol. 2003;90:961–971. doi: 10.1152/jn.01147.2002. [DOI] [PubMed] [Google Scholar]
- Beloozerova IN, Sirota MG, Swadlow HA. Activity of different classes of neurons of the motor cortex during locomotion. J Neurosci. 2003;23:1087–1097. doi: 10.1523/JNEUROSCI.23-03-01087.2003. [DOI] [PMC free article] [PubMed] [Google Scholar]
- Beloozerova IN, Sirota MG, Orlovsky GN, Deliagina TG. Activity of pyramidal tract neurons in the cat during postural corrections. J Neurophysiol. 2005;93:1831–1844. doi: 10.1152/jn.00577.2004. [DOI] [PubMed] [Google Scholar]
- Beloozerova IN, Farrell BJ, Sirota MG, Prilutsky BI. Differences in movement mechanics, electromyographic, and motor cortex activity between accurate and non-accurate stepping. J Neurophysiol. 2010;103:2285–2300. doi: 10.1152/jn.00360.2009. [DOI] [PMC free article] [PubMed] [Google Scholar]
- Bishop PO, Burke W, Davis R. The identification of single units in central visual pathways. J Physiol. 1962;162:409–431. doi: 10.1113/jphysiol.1962.sp006942. [DOI] [PMC free article] [PubMed] [Google Scholar]
- Chambers WW, Liu CN. Corticospinal tract of the cat: an attempt to correlate the pattern of degeneration with deficits in reflex activity following neocortical lesions. J Comp Neurol. 1957;108:23–55. doi: 10.1002/cne.901080103. [DOI] [PubMed] [Google Scholar]
- Contreras D, Curró Dossi R, Steriade M. Electrophysiological properties of cat reticular thalamic neurones in vivo. J Physiol. 1993;470:273–294. doi: 10.1113/jphysiol.1993.sp019858. [DOI] [PMC free article] [PubMed] [Google Scholar]
- Cotillon-Williams N, Huetz C, Hennevin E, Edeline JM. Tonotopic control of auditory thalamus frequency tuning by reticular thalamic neurons. J Neurophysiol. 2008;99:1137–1151. doi: 10.1152/jn.01159.2007. [DOI] [PubMed] [Google Scholar]
- Domich L, Oakson G, Steriade M. Thalamic burst patterns in the naturally sleeping cat: a comparison between cortically projecting and reticularis neurones. J Physiol. 1986;379:429–449. doi: 10.1113/jphysiol.1986.sp016262. [DOI] [PMC free article] [PubMed] [Google Scholar]
- Drew T, Doucet S. Application of circular statistics to the study of neuronal discharge during locomotion. J Neurosci Methods. 1991;38:171–181. doi: 10.1016/0165-0270(91)90167-x. [DOI] [PubMed] [Google Scholar]
- Efron B, Tibshirani RJ. An introduction to the bootstrap. New York: Chapman & Hall; 1993. [Google Scholar]
- Fanselow EE, Sameshima K, Baccala LA, Nicolelis MA. Thalamic bursting in rats during different awake behavioral states. Proc Natl Acad Sci U S A. 2001;98:15330–15335. doi: 10.1073/pnas.261273898. [DOI] [PMC free article] [PubMed] [Google Scholar]
- Fischer NI. Statistical analysis of circular data. Cambridge, UK: Cambridge UP; 1993. [Google Scholar]
- Fuller JH, Schlag JD. Determination of antidromic excitation by the collision test: problems of interpretation. Brain Res. 1976;112:283–298. doi: 10.1016/0006-8993(76)90284-5. [DOI] [PubMed] [Google Scholar]
- Funke K, Eysel UT. Inverse correlation of firing patterns of single topographically matched perigeniculate neurons and cat dorsal lateral geniculate relay cells. Vis Neurosci. 1998;15:711–729. doi: 10.1017/s0952523898154111. [DOI] [PubMed] [Google Scholar]
- Hartings JA, Temereanca S, Simons DJ. State-dependent processing of sensory stimuli by thalamic reticular neurons. J Neurosci. 2003;23:5264–5271. doi: 10.1523/JNEUROSCI.23-12-05264.2003. [DOI] [PMC free article] [PubMed] [Google Scholar]
- Hildebrand M. Symmetrical gaits of horses. Science. 1965;150:701–708. doi: 10.1126/science.150.3697.701. [DOI] [PubMed] [Google Scholar]
- Huguenard JR, Prince DA. A novel T-type current underlies prolonged Ca2+-dependent burst firing in GABAergic neurons of rat thalamic reticular nucleus. J Neurosci. 1992;12:3804–3817. doi: 10.1523/JNEUROSCI.12-10-03804.1992. [DOI] [PMC free article] [PubMed] [Google Scholar]
- Jones EG. The thalamus. Cambridge, UK: Cambridge UP; 2007. [Google Scholar]
- Lam YW, Sherman SM. Mapping by laser photostimulation of connections between the thalamic reticular and ventral posterior lateral nuclei in the rat. J Neurophysiol. 2005;94:2472–2483. doi: 10.1152/jn.00206.2005. [DOI] [PubMed] [Google Scholar]
- Lam YW, Sherman SM. Different topography of the reticulothalmic inputs to first- and higher-order somatosensory thalamic relays revealed using photostimulation. J Neurophysiol. 2007;98:2903–2909. doi: 10.1152/jn.00782.2007. [DOI] [PubMed] [Google Scholar]
- Lam YW, Sherman SM. Functional organization of the thalamic input to the thalamic reticular nucleus. J Neurosci. 2011;31:6791–6799. doi: 10.1523/JNEUROSCI.3073-10.2011. [DOI] [PMC free article] [PubMed] [Google Scholar]
- Lee SH, Govindaiah G, Cox CL. Heterogeneity of firing properties among rat thalamic reticular nucleus neurons. J Physiol. 2007;582:195–208. doi: 10.1113/jphysiol.2007.134254. [DOI] [PMC free article] [PubMed] [Google Scholar]
- Liddell EGT, Phillips CG. Pyramidal section in the cat. Brain. 1944;67:1–9. [Google Scholar]
- Marigold DS, Patla AE. Visual information from the lower visual field is important for walking across multi-surface terrain. Exp Brain Res. 2008;188:23–31. doi: 10.1007/s00221-008-1335-7. [DOI] [PubMed] [Google Scholar]
- Marlinski V, Sirota MG, Beloozerova IN. Activity of thalamic reticular nucleus during locomotion. Program No. 683.4. Neuroscience Meeting Planner; San Diego: Society for Neuroscience; 2010. Online. Soc Neurosci Abstr 36:683.4. [Google Scholar]
- Marlinski V, Nilaweera WU, Zelenin PV, Sirota MG, Beloozerova IN. Signals from the ventrolateral thalamus to the motor cortex during locomotion. J Neurophysiol. 2012;107:455–472. doi: 10.1152/jn.01113.2010. [DOI] [PMC free article] [PubMed] [Google Scholar]
- McAlonan K, Cavanaugh J, Wurtz RH. Attentional modulation of thalamic reticular neurons. J Neurosci. 2006;26:4444–4450. doi: 10.1523/JNEUROSCI.5602-05.2006. [DOI] [PMC free article] [PubMed] [Google Scholar]
- McCormick DA, Bal T. Sleep and arousal: thalamocortical mechanisms. Annu Rev Neurosci. 1997;20:185–215. doi: 10.1146/annurev.neuro.20.1.185. [DOI] [PubMed] [Google Scholar]
- McCormick DA, Contreras D. On the cellular and network bases of epileptic seizures. Annu Rev Physiol. 2001;63:815–846. doi: 10.1146/annurev.physiol.63.1.815. [DOI] [PubMed] [Google Scholar]
- Prilutsky BI, Sirota MG, Gregor RJ, Beloozerova IN. Quantification of motor cortex activity and full-body biomechanics during unconstrained locomotion. J Neurophysiol. 2005;94:2959–2969. doi: 10.1152/jn.00704.2004. [DOI] [PubMed] [Google Scholar]
- Pryor K. Lads before the wind: adventures in porpoise training. New York: Harper and Row; 1975. [Google Scholar]
- Reinagel P, Godwin D, Sherman SM, Koch C. Encoding of visual information by LGN bursts. J Neurophysiol. 1999;81:2558–2569. doi: 10.1152/jn.1999.81.5.2558. [DOI] [PubMed] [Google Scholar]
- Reinoso-Suarez F. Topographischer Hirnatlas der Katze für experimental-physiologische Untersuchungen. Darmstadt, Germany: Von E. Merck AG; 1961. [Google Scholar]
- Reitboeck HJ. Fiber microelectrodes for electrophysiological recordings. J Neurosci Methods. 1983;8:249–262. doi: 10.1016/0165-0270(83)90038-9. [DOI] [PubMed] [Google Scholar]
- Sherk H, Fowler GA. Neural analysis of visual information during locomotion. Prog Brain Res. 2001;134:247–264. doi: 10.1016/s0079-6123(01)34017-7. [DOI] [PubMed] [Google Scholar]
- Sillito AM, Jones HE. The role of the thalamic reticular nucleus in visual processing. Thalamus Relat Systems. 2008;4:1–12. [Google Scholar]
- Sirota MG, Swadlow HA, Beloozerova IN. Three channels of corticothalamic communication during locomotion. J Neurosci. 2005;25:5915–5925. doi: 10.1523/JNEUROSCI.0489-05.2005. [DOI] [PMC free article] [PubMed] [Google Scholar]
- Skinner BF. The behavior of organisms: an experimental analysis. New York: Appleton-Century-Crofts; 1938. [Google Scholar]
- Steriade M, Jones EG, Llinas RR. Thalamic oscillations and signaling. New York: Wiley; 1990. [Google Scholar]
- Steriade M, McCormick DA, Sejnowski TJ. Thalamocortical oscillations in the sleeping and aroused brain. Science. 1993;262:679–685. doi: 10.1126/science.8235588. [DOI] [PubMed] [Google Scholar]
- Swadlow HA, Gusev AG. The impact of ‘bursting’ thalamic impulses at a neocortical synapse. Nat Neurosci. 2001;4:402–408. doi: 10.1038/86054. [DOI] [PubMed] [Google Scholar]
- Trendelenburg W. Untersuchungen über reizlose vorübergehende Aussaltung am Zentralnervensystem. III. Die extermitaten Region der Grosshirninde. Pflügers Arch. 1911;137:515–544. [Google Scholar]
- Udo M, Kamei H, Matsukawa K, Tanaka K. Interlimb coordination in cat locomotion investigated with perturbation. II. Correlates in neuronal activity of Deiter's cells of decerebrate walking cats. Exp Brain Res. 1982;46:438–447. doi: 10.1007/BF00238638. [DOI] [PubMed] [Google Scholar]
- Zelenin PV, Beloozerova IN, Sirota MG, Orlovsky GN, Deliagina TG. Activity of red nucleus neurons in the cat during postural corrections. J Neurosci. 2010;30:14533–14542. doi: 10.1523/JNEUROSCI.2991-10.2010. [DOI] [PMC free article] [PubMed] [Google Scholar]