Abstract
Biological systems are often subject to external noise from signal stimuli and environmental perturbations, as well as noises in the intracellular signal transduction pathway. Can different stochastic fluctuations interact to give rise to new emerging behaviors? How can a system reduce noise effects while still being capable of detecting changes in the input signal? Here, we study analytically and computationally the role of nonlinear feedback systems in controlling external noise with the presence of large internal noise. In addition to noise attenuation, we analyze derivatives of Fano factor to study systems' capability of differentiating signal inputs. We find effects of internal noise and external noise may be separated in one slow positive feedback loop system; in particular, the slow loop can decrease external noise and increase robustness of signaling with respect to fluctuations in rate constants, while maintaining the signal output specific to the input. For two feedback loops, we demonstrate that the influence of external noise mainly depends on how the fast loop responds to fluctuations in the input and the slow loop plays a limited role in determining the signal precision. Furthermore, in a dual loop system of one positive feedback and one negative feedback, a slower positive feedback always leads to better noise attenuation; in contrast, a slower negative feedback may not be more beneficial. Our results reveal interesting stochastic effects for systems containing both extrinsic and intrinsic noises, suggesting novel noise filtering strategies in inherently stochastic systems.
Dedicated to Professor Peter Constantin on the occasion of his 60th Birthday
INTRODUCTION
In biological systems, cells often adapt their fates and adjust to environmental perturbations by sensing the external stimuli, processing the information and generating responses appropriately. With many genes and proteins presenting in low numbers, signal processing is inevitably inherently stochastic.2, 6, 7, 21 Due to internal noise, genetically identical cells may assume different fates within a homogeneous environment. Stochastic effects play an important role in various biological processes. Noise may be used as probabilistic differentiation strategies and to facilitate evolutionary adaption.2, 7 For instance, for many cyanobacteria, photosynthesis and nitrogen fixation are crucial but mutually exclusive; to maintain both functions, a subpopulation of cells are assigned to nitrogen fixation while the rest is kept photosynthetic.2
In spite of internal noise, which fate for a cell to choose is biased by specific environmental cues, such as the strength and duration of stimuli, through which cells exhibit environment-specific diversity.2, 15 For example, during cell differentiation, morphogens determine cell types in a concentration dependent manner. In a deterministic system without noise, a cell turns on one gene expression when the concentration of a morphogen sensed by the cell is above a threshold;18, 19, 29 however, in a stochastic system, having the same gene expression in that cell becomes probabilistic where the probability may depend on the mean concentration of the morphogen.15, 20 While maintaining specific, steady, and inheritable cellular diversity is critical for metazoan development, optimized microbial resource utilization and survival in a frequently stressful environment,2, 7 external noise from the environment, such as the fluctuations in the signal input and the variations of reaction rates, can easily perturb a normal decision-making process of a cell. What strategies do cells use to control external noise for reliable and desirable gene expression?
Linear signaling cascades, in which information flows proportionally to the level of a single signaling species at each step, are studied extensively in recent years.1, 10, 11, 24, 26 It has been found that, in linear signaling cascades, better buffering the input noise results in a decrease in the system's capability of detecting changes in the mean level of the signal input,12 i.e., losing response specificity.
With an assumption on small stationary fluctuations around a unique stable point of each species, a simple and nonlinear model is studied through the van Kampen's Ω-expansion in which the first- and second-order terms capture the deterministic macroscopic behavior and the result from the fluctuation-dissipation theorem, respectively.22 The total noise in the output signal has been found to be the sum of the intrinsic noise in signal processing and the extrinsic noise from the signal input, suggesting that negative feedbacks can suppress noise while positive feedbacks can amplify noise.22
For nonlinear systems with small or negligible intrinsic stochastic effects, feedback loops play critical roles in propagation of noise originally presented in the signal input.4, 12 In many biological systems, such as sensing temperature, nutrient levels or ligand concentrations, changes in the signal input cannot be reflected instantaneously in the downstream reaction components. As a result, rapid stochastic fluctuations in the signal input may be averaged or filtered out through slow components and the feedback loops regulate noise propagation by modulating the timing of signal responses.4, 12 Interestingly, the capability of a feedback system to attenuate the input noise is found to be inversely dependent on the difference between the deactivation time and the activation time, a critical quantity characterized by the deterministic system regardless of positive or negative feedback loops.30
What happens to such nonlinear feedback systems in the presence of significant intrinsic stochastic effects? Multiple states, such as inactive and active states in transcriptionally regulated promoters and bi-stable gene expressions in cellular differentiation20, 29, 31 are often observed in biological systems. Here we incorporate the inherent noise of the system and fluctuations from the input signal using chemical master equations. We study several nonlinear feedback loops both analytically and computationally to examine how each type of feedback loop responds to noises originating from the external signal input. We use the coefficient of variance (CV), defined as the standard deviation of the output divided by its mean, to quantify the noise attenuation capability. In particular, we focus on delineating contributions from intrinsic and extrinsic fluctuations to signal output and exploring the limitation of different feedback loops to control external noise.
Signal specificity is another focus in this study. When a system has a strong capability of removing fluctuations in the input signal, it may become weak in detecting changes in the signal input, such as changes in the mean level.12 How does a system keep the output specific to its input signal while still being able to reduce fluctuations from the input? In other words, the output signal must reveal small changes in the mean of the input signal even when the variance of the input becomes large. Here we consider the Fano factor, defined as the variance of the output divided by its mean, and use its derivative to the mean of the signal input to quantify signal specificity. For example, a larger value of the derivative implies a better sensitivity of the output to the input signal. The advantage of using the Fano factor over CV is that when the mean of the response output is close to zero, the Fano factor may remain finite while CV may blow up. This is very important when considering spatial signals that can span a wide range of strengths. By examining the derivatives of the Fano factor, we investigate a feedback loop's capability of differentiating signal inputs and maintaining signal robustness under different strengths of signal inputs.
ONE POSITIVE FEEDBACK LOOP
To understand noise propagation along complex signaling networks, we first consider a single positive feedback loop consisting of two reacting components (Fig. 1), in which B is activated by the signal input S, B activates C and C can promote the activation of B in turn. The positive feedback module exists in many biological signaling circuits.3, 5, 13, 20, 29 For example, B and C can be considered as two promoter sites, S is a transcription factor of B, and C can produce regulatory proteins to enhance the transcription of B.
Figure 1.

The schematic diagram of one positive feedback loop.
Let c and b denote the fractions of active C and B in cells exposed to the same signal input S. The dynamics of B and C takes the following deterministic continuum equations:
| (1a) |
| (1b) |
where s is the level of S, τ is the temporal scale of the reactions of B, and the loop is slow when τ ≪ 1.
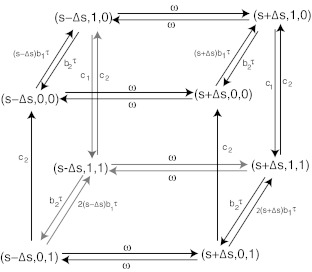
In a discrete stochastic description, we assume that B and C can be either 0 or 1 and S can be either s + Δs or s − Δs. B is active when B = 1, and inactive when B = 0. Similarly, C is active when C = 1 and inactive when C = 0. Define the state of the system as the vector , where , and denote the state of S, B and C, respectively. Possible transitions among different states corresponding to reactions in Fig. 1 are illustrated by the directed graph in Fig. 2. Each directed edge vs → ve stands for one reaction step that changes the state of the system from vs to ve.9 The weight of each edge gives the probability of the occurrence of each reaction during a unit time interval. Define P = (P1, P2, …, P8)′ such that for i = 1, 2, …, 8, Pi is the probability of the state at (s − Δs, 0, 0), (s − Δs, 1, 0), (s − Δs, 1, 1), (s − Δs, 0, 1), (s + Δs, 0, 0), (s + Δs, 1, 0), (s + Δs, 1, 1), and (s + Δs, 0, 1) at time t, respectively. Then the corresponding master equations are
| (2) |
where
| (3) |
| (4) |
| (5) |
and I is the 4 × 4 identity matrix.
Figure 2.
The diagram on transitions among different states.
Input noise control
Similar to the previous studies,12, 22, 30 we use the coefficient of variance (CV) of active C, defined as
| (6) |
to study the output noise when S fluctuates around a constant level s.
The fluctuations inSareadditiveto the inherent stochasticity inBandC. We consider the fluctuations in C at the stationary state when the distribution of C does not change over time, i.e., AP = 0. With the restriction , P can be solved directly in Eq. 2. Then the square of the CV of C at the stationary state is obtained as below
| (7) |
The leading terms in the last equation give an approximation of CV2 if τ ≪ 1, which means the feedback loop from B to C is assumed to be slow. If there is no fluctuation in S, i.e., S ≡ s, the CV of C is
| (8) |
Therefore, CVI measures the fluctuations caused solely by the inherent stochasticity in B and C. We next define
| (9) |
which in turn estimates the fluctuations in the output caused by the external noise from S. We notice that the contribution from the external noise in S is additive to the total fluctuations in the signal output C when the B component changes slowly. Note that CVE is independent of b1 in Eq 9. This is because as S varies, the probabilities of C = 1 and C = 0 change in an order of O(b1) and hence the variance of C varies in . As the mean of C is O(b1), b1 is then canceled in CVE.
The fluctuations fromSare buffered by the slow reaction componentB. In Eq 9, CVE is proportional to
| (10) |
where τ/ω measures the temporal scale of reactions relative to the fluctuation frequency of the signal input S. Noting that the approximation of CV2 does not require any condition on Δs, we conclude that slow downstream reactions can buffer the fast fluctuations from the upstream signal.
The dependence of CVE on τ/ω is consistent with the previous study,30 in which the noise attenuation capability is dependent on a temporal quantity called signed activation time (SAT):
| (11) |
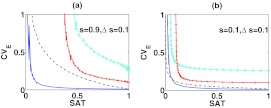
where the activation time scale is the time for the level of C to reach its new steady state after S switches from s − Δs to s + Δs, and the deactivation time scale is defined as the time for the level of C to reach its new steady state after S switches from s + Δs to s − Δs. In Fig. 3, we observe that CVE is a decreasing function of SAT as the signal input fluctuates around the low level (s = 0.1) or the high level (s = 0.9).
Figure 3.
The correlation between CVE and SAT at the variation of parameters. In panel (a) and (b), the signal input S fluctuates around 0.9 and 0.1, respectively. Along the blue-solid line, τ varies from 0.01 to 1; along the black-dot line, b2 varies from 0.1/min to 10/min; along the cyan-circle line, c1 varies from 0.1/min to 10/min; and along the red-cross line, c2 varies from 0.1/min to 10/min. The values of other parameters except the varied ones are chosen from τ = 0.01, c1 = 1/min, c2 = 0.3/min, b1 = 1/min and b2 = 2/min along each line. For comparison, we normalize SAT and CVE by their maximal values within the variation of each parameter, in order to confine them in [0,1].
Signal specificity to the mean level of the input signal and rate constants
To study the specificity of the output signal to noisy signal inputs, we consider the Fano factor of C defined as
| (12) |
The Fano factor, similar to CV, measures the relative fluctuations of the output. When the mean of S is close to zero, the mean of C is close to zero. As a result, the CV of C increases dramatically, while the Fano factor is confined in [0,1]. This is important when the input signal takes a wide range of values such as the spatially varied signals morphogens.18, 19, 20, 29 In addition, the derivative of the Fano factor of C to the mean of the input S measures how sensitive the Fano factor is with respect to changes in the mean of the signal input. This quantity may be used to study the capability of differentiating noisy input signals by detecting the potential small difference between the mean values of two signals. Again, this is important for spatially varied signals as two cells next to each other in space may receive input signals of small differences, but, exhibit two totally different fates.
Given that the Fano factor of a Poisson-distributed variable is one, the Fano factor of a random variable reveals its deviation from the Poisson distribution. The Fano factor of a gene (e.g., C in our system) is the probability of the gene being inactive (i.e., C = 0). When a gene is active, the production of its protein is approximated by a Poisson process. Therefore, the Fano factor may measure how often the transcription and protein production process is interrupted.21, 23 Here, the Fano factor of C can be used to quantify the deviation of its protein production from a Poisson process.
At the low values of the signal input, the Fano factor ofCis robust with respect to perturbations of rate constants. Direct calculation of the Fano factor of C at the stationary state shows
| (13) |
As indicated in Eq. 13, the Fano factor of C is close to one when s ≪ 1. However, at the high level of S, it depends on the kinetic rates. Therefore, at the low level of S, the Fano factor of C is not as sensitive to changes in rate constants as at the high level of S.
Slowing the positive feedback loop can increase the robustness of the output to changes in rate constants and buffer fluctuations in the input while keeping the signal output specific to the mean level of the signal input. The sensitivity of the Fano factor of C to changes in b1 and c1 may be estimated through their derivatives:
| (14) |
| (15) |
Since τ ≪ 1, at s ≪ 1 we have
| (16) |
Moreover, when Δs ≪ s or ω is large enough, reducing τ decreases and .
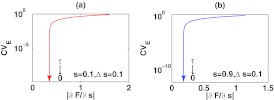
When τ is close to zero, F is dominated by the first two terms in Eq. 13, limiting the influence of τ on the sensitivity of F to s. Therefore, while decreasing τ can reduce CVE to zero, the sensitivity of F to s cannot be reduced after reaching a certain level. This behavior is also seen in Fig. 4, where τ approaches zero, CVE approaches zero while the does not. By slowing B, cells can manage to diminish large fluctuations from the input and detect small changes in the mean of the input simultaneously. This is a very important strategy in many biological systems, like cell differentiation in which specific genes have to be appropriately expressed in the right spatial locations according to spatially and temporally varying, but, noisy signal inputs.20, 29
Figure 4.
The changes of CVE and as τ decreases from one to zero. The arrows indicate where CVE and head as τ approaches zero. Here ω = 1, c1 = 1/min, c2 = 0.3/min, b1 = 1/min, and b2 = 2/min.
Spatially varied signals lead to the non-Poisson behavior of the output signal
During the embryonic development, morphogens, a class of diffusive molecules, form spatial gradients and specify fates of cells.18, 19, 20, 29 Previous studies on stochastic effects of such systems have made an assumption on Poisson distributions of signaling species for simplicity of analysis and computations.8, 17, 27 Here, we study a one-dimensional spatial model without the Poisson assumption and instead use the spatial stochastic Gillespie simulation algorithm9, 14 to solve the full model numerically.
In this model, the one-dimensional tissue consists of ν cells, in which morphogen S is produced in the first cell on the left, diffuses and decays throughout the tissue. In each cell S acts as the signal input to activate downstream components B and C with the regulation shown in Fig. 1. Let Ni be the number of S molecules in the ith cell. It is known that at the stationary state
| (17) |
where Mi is the mean number of S molecules in the ith cell, and M1 > M2 > M3 ⋯> Mν. The exact expressions of Mi's can be found in Ref. 15. So the distribution of Ni is Poisson with mean Mi and variance Mi. To analyze the response of each cell to S, in Eq. 2 we let
| (18) |
where , is the Avogadro's number and V is the volume of the cell. By using Ω, we scale the number of S molecules relative to the concentration of S. 1μM in a cube of volume 1μm3 will be equal to 600 molecules. Since the diameter of a cell is usually between 1 μm to 10 μm, Ω ≫ 1. Furthermore, and Δs ≪ s.
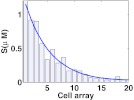
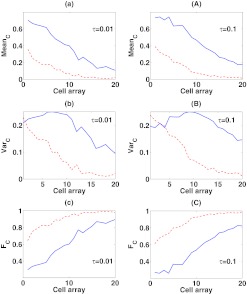
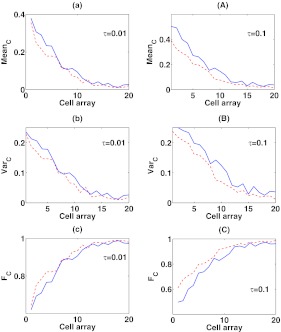
The typical spatial profile for S and its mean are shown in Fig. 5 for an array of 20 cells. We numerically simulate B and C with such input S and compare the statistics of C at different τ's, b1's, and c1's, to examine the ability of the slow positive feedback loop to control input fluctuations, changes in rate constants, and signal specificity. The mean, variance and Fano factor of C under each parameter setting are shown in Figs. 67.
Figure 5.
The spatial profile of S in the one-dimensional tissue at the stationary state. The solid line shows the mean concentration of S from 500 realizations of the stochastic system and the bars display the concentration of S in each cell from one realization. The tissue consists of an array of 20 cells with each cell of dimension 5 μm × 5 μm × 5 μm. Being produced in the first cell with rate 6 μM/min, S diffuses at 9 μm2/sec and decays at 1/min throughout the system. Assuming symmetry, we perform the simulation in a slice of the system with base 0.14 μm × 0.14 μm.
Figure 6.
The mean, variance, and Fano factor of C in response to the spatial signal input S at different b1's. In the panel (a), (b), and (c), τ = 0.01, while in the panel (A), (B), and (C), τ = 0.1. b1 = 1/min along the red-dashed line, while b1 = 10/min along the blue-solid line. The values of the remaining parameters are c1 = 1/min, c2 = 0.3/min and b2 = 2/min.
Figure 7.
The mean, variance, and Fano factor of C in response to the spatial signal input S at different c1's. In the panel (a), (b), and (c), τ = 0.01, while in the panel (A), (B), and (C), τ = 0.1. c1 = 1/min along the red-dashed line, while c1 = 10/min along the blue-solid line. The values of the remaining parameters are b1 = 1/min, b2 = 2/min, and c2 = 0.3/min .
As expected, as b1 or c1 increases, the changes in the mean, variance, and Fano factor of C at τ = 0.01 are all smaller than they are at τ = 0.1 throughout the system, implying that the slow reaction component B reduces the sensitivity of the response to the changes of parameters. Moreover, for the variations of b1 and c1, the changes in all three quantities decrease as the mean level of S decreases. In particular, as b1 increases, the mean of C increases more dramatically at the high signal value (S ≈ 1) than at the low signal value (S ≈ 0). So, when S ≈ 1 the mean of C becomes close to one and the variance is close to zero, making the distribution of C different from Poisson.
DUAL-TIME FEEDBACK LOOPS
In this section, we consider the role of an additional negative feedback to the one positive feedback loop system studied in Sec. 2 (Fig. 8).
Figure 8.

The schematic diagram of the positive-negative feedback loop.
An extra component A, also activated by S and the output C, has a negative regulation on C. The two feedbacks from A and B affect C in an incoherent way with different time scales τa and τb. The deterministic model in a similar form of Eq. 1a, 1b is following:
| (19a) |
| (19b) |
| (19c) |
Here we consider two cases: the system of a fast negative feedback loop and a slow positive feedback loop, i.e., τa = 1 and τb ≪ 1 and the system of a fast positive feedback loop and a slow negative feedback loop, i.e., τa ≪ 1 and τb = 1. Examples of such a regulation mechanism include the mitotic trigger in Xenopus, Ca2 + oscillation, and circadian oscillation in Drosophila and Mammalia.28 Such systems consist of reaction modules whose characteristic time scales may span over femtoseconds to hours or even days.25
The important role of the fast component in processing the fluctuations from S
Similar to the one loop system, we study the effect of the input noise by considering CVE ≡ (CV)2 − (CVI)2, where CV and CVI are the coefficients of variance of C with and without the fluctuations in S, respectively.
For a fast negative feedback loop and a slow positive feedback loop, using a similar approach as the one loop system, we obtain
| (20) |
where CVE(P, N) denotes the CVE of the full system, CVE(N) denotes the CVE of the system with only the fast negative feedback component (B ≡ 1), and Dn = c1(2 + a1(1 + ka)s)2(4c1(3 + a1(1 + ka)s + 3(3 + a1s)(4 + a1(1 + ka)s)). Therefore, how the fluctuations in S affect the system is dominated by the fast negative feedback component. Also note that due to the negative regulation of A on C, CVE(P, N) and CVE(N) are negative, which is consistent with Ref. 22.
For a slow negative feedback loop and a fast positive feedback loop, letting CVE(P) be the CVE of the system with only the fast positive feedback component (A ≡ 0), we have
| (21) |
and
| (22) |
where Dp = c1(2 + b1s(1 + kb))2(9(4 + c1) + b1s(21 + 9kb + 2c1(3 + kb) + b1s(3 + c1)(1 + kb))).
It is straightforward to show that
| (23) |
when kb ⩽ 3 or s ⩾ 1/(8b1). Therefore, when the signal input is high enough, the noise effect from S on the full system is dominated by its impact on the fast feedback component.
The limited and different influence of slowing one positive or negative feedback loop on the propagation of the input noise
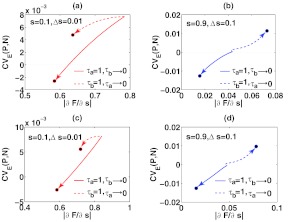
To study the signal specificity to noisy signal inputs, we next examine the derivative of the Fano factor of C to the mean level of the signal input. In Fig. 9, we plot CVE(P, N) and the derivative of the Fano factor of C to s when the temporal scale of either one of the two feedback loops is adjusted from fast to slow. It is interesting to observe that slowing the positive feedback (i.e., τb → 0) leads to different qualitative behaviors of the signal output from slowing the negative feedback (i.e., τa → 0).
Figure 9.
The changes of CVE and as the negative or fast feedback loop is adjusted from fast to slow. The arrows indicate where CVE(P, N) and head as τa or τb approaches zero, and the black solid circles are their limits. Here c1 = 2/min, c2 = 1/min, b1 = 2/min, b2 = 1/min, a1 = 3/min, and a2 = 1/min. In panel (a)-(b), ka = 1 and kb = 1; in panel (c)-(d), ka = 1 and kb = 5.
When slowing the positive feedback and keeping the negative feedback fast (i.e., τb → 0 and τa = 1), CVE(P, N) and decrease to approach non-zero limits at both low and high values of signal inputs. Under a wide range of parameters and signal inputs, positive feedback loops usually amplify noises, also seen in Eq. 21. Slower temporal dynamics of such a loop leads to smaller CVE(P, N). As its time scale becomes comparable to or slower than the negative feedback, CVE(P, N) reaches its lower limit. also exhibits a similar behavior. Together, it shows that although the external noise control capability (i.e., CVE) is limited, the sensitivity of the Fano factor to s is maintained in such a feedback system for signal specificity.
The result is different for slowing the negative feedback and keeping the positive feedback fast (i.e., τa → 0 and τb = 1). CVE(P, N) and increase to reach their limits with the high value of the signal input and decrease to reach their limits at the low value of the signal input. For this case, CVE(N) is negative in Eq. 20, indicating that the negative feedback can repress noise by reacting fast to changes in the signal input. Our calculation on CVE(P, N) suggests that in some parameter regimes, slowing the negative feedback loop may prevent the fast reaction and reduce the noise repression capability, while in others, it may help filter out fluctuations. When the level of S is high, A has a high mean level and the “negative” role of A in signaling is large; slowing the reactions of A reduces noise repression, increasing CVE(P, N) to its limit. At the low values of the signal input with a low mean level of A, the “negative” role of A in signaling is small, and slowing the feedback loop mainly filters the fluctuations in C, reducing CVE(P, N) to its limit.
Because noise propagation is dominated by the faster reacting component, noise control by slowing one feedback is limited. Slowing the positive feedback loop (i.e., reducing τb) leads to better noise attenuation and reduction of CVE(P, N). Interestingly, slowing the negative feedback loop (i.e., reducing τa) can increase or decrease the system's noise attenuation capability, depending on the relative strength of the negative feedback in signal transduction.
CONCLUSIONS AND DISCUSSION
In this paper, we have investigated how inherently stochastic feedback systems respond to noisy signal inputs. We have incorporated both intrinsic and extrinsic noises through a discrete description of chemical reactions in the feedback systems. The models based on chemical master equations have been studied both analytically and computationally. In addition to examining systems' noise attenuation capability through the coefficient of variance of the signal output, we have studied how the signal output maintains its fidelity to the mean level of the signal input using the Fano factor. Using this approach, we also have explored spatially varied input signals in morphogen systems and compared the consequent dynamics with the case of Poisson assumption.
Unlike previous studies with assumptions on small stochastic perturbations,12, 22, 32 our model allows large stochastic effects for probabilistic transitions of signaling species among functionally different states. Our analysis shows that the level of the fluctuations of the signal output is the sum of the external noise from the signal input and the internal noise of signal transduction in one positive feedback loop, a result consistent with a previous study.22 Without surprise, slowing one positive feedback in time leads to good noise control and signal specificity. For spatially varied inputs, the dynamics of the output exhibits non-Poisson behaviors at high values of inputs while the system shows Poisson at low values of inputs.
For a dual-time negative-positive feedback loop system responding to noisy inputs, the impact of the input noise on the signal output mainly depends on how the faster loop of the two feedbacks reacts to the fluctuations, implying a limited effect of slowing only one feedback loop. In addition, we have found that a slower positive loop has better control on propagation of input noises at both high and low input signal values, but, a slower negative loop may not always be beneficial on attenuating noises in the input. The result suggests that a dual-time feedback system of a slow positive feedback loop and a fast negative feedback loop is particularly valuable in controlling input noise compared to other possible combinations.
Our analytical and computational approach provides a systematic way of studying stochastic dynamics of nonlinear signaling networks of multiple temporal scales, with possible applications to many biological systems.4, 16, 20, 28, 29 It would be interesting to expand such an approach to include the effect of feedbacks on internal noise and to explore the impact of slow temporal scales for such case. Several previous studies have suggested advantages of dual-time positive-positive feedback loops in the capability of buffering external noises from the signal input and promoting fast responses to stimuli without considering inherent stochastic effects.4, 16 It would be worthwhile comparing different combinations of feedback loops with intrinsic noise about multiple performance objectives, which may include controlling noises from inputs, fast responses to inputs, signal specificity, and robustness to other internal and external factors.
ACKNOWLEDGMENTS
This work was partially supported by National Institutes of Health Grant Nos. R01GM67247 and P50GM76516 and National Science Foundation (NSF) Grant Nos. DMS-0917492 and DMS-1161621. Q.N. would like to dedicate this work to Professor Peter Constantin for his support, guidance, and mentoring when he was a Dickson instructor at the University of Chicago from 1997 to 1999.
References
- Anderson D. F., Mattingly J. C., Nijhout H. F., and Reed M. C., “Propagation of fluctuations in biochemical systems. I: Linear SSC networks,” Bull. Math. Biol. 69(6), 1791–1813 (2007). 10.1007/s11538-007-9192-2 [DOI] [PubMed] [Google Scholar]
- Balázsi G., Van Oudenaarden A., and Collins J. J., “Cellular decision making and biological noise: From microbes to mammals,” Cell 144(6), 910–925 (2011). 10.1016/j.cell.2011.01.030 [DOI] [PMC free article] [PubMed] [Google Scholar]
- Berridge M. J. et al. , “The versatility and complexity of calcium signalling,” Complexity in biological information processing 239, 52–67 (2001). [PubMed] [Google Scholar]
- Brandman O., J. E.FerrellJr., Li R., and Meyer T., “Interlinked fast and slow positive feedback loops drive reliable cell decisions,” Sci. STKE 310(5747), 496 (2005). 10.1126/science.1113834 [DOI] [PMC free article] [PubMed] [Google Scholar]
- Chang L. and Karin M., “Mammalian MAP kinase signalling cascades,” Nature (London) 410(6824), 37–40 (2001). 10.1038/35065000 [DOI] [PubMed] [Google Scholar]
- Choi J. K. and Kim Y. J., “Intrinsic variability of gene expression encoded in nucleosome positioning sequences,” Nat. Genet. 41(4), 498–503 (2009). 10.1038/ng.319 [DOI] [PubMed] [Google Scholar]
- Eldar A. and Elowitz M. B., “Functional roles for noise in genetic circuits,” Nature (London) 467(7312), 167–173 (2010). 10.1038/nature09326 [DOI] [PMC free article] [PubMed] [Google Scholar]
- Entchev E. V., Schwabedissen A., and González-Gaitán M., “Gradient formation of the TGF-β homolog Dpp,” Cell 103(6), 981–992 (2000). 10.1016/S0092-8674(00)00200-2 [DOI] [PubMed] [Google Scholar]
- Gadgil C., Lee C. H., and Othmer H. G., “A stochastic analysis of first-order reaction networks,” Bull. Math. Biol. 67(5), 901–946 (2005). 10.1016/j.bulm.2004.09.009 [DOI] [PMC free article] [PubMed] [Google Scholar]
- Hooshangi S., Thiberge S., and Weiss R., “Ultrasensitivity and noise propagation in a synthetic transcriptional cascade,” Proc. Natl. Acad. Sci. U.S.A. 102(10), 3581 (2005). 10.1073/pnas.0408507102 [DOI] [PMC free article] [PubMed] [Google Scholar]
- Hooshangi S. and Weiss R., “The effect of negative feedback on noise propagation in transcriptional gene networks,” Chaos 16(2), 026108–026108 (2006). 10.1063/1.2208927 [DOI] [PubMed] [Google Scholar]
- Hornung G. and Barkai N., “Noise propagation and signaling sensitivity in biological networks: A role for positive feedback,” PLOS Comput. Biol. 4(1), e8 (2008). 10.1371/journal.pcbi.0040008 [DOI] [PMC free article] [PubMed] [Google Scholar]
- Huang C. Y. and Ferrell J. E., “Ultrasensitivity in the mitogen-activated protein kinase cascade,” Proc. Natl. Acad. Sci. U.S.A. 93(19), 10078 (1996). 10.1073/pnas.93.19.10078 [DOI] [PMC free article] [PubMed] [Google Scholar]
- Kang H. W., Zheng L., and Othmer H. G., “A new method for choosing the computational cell in stochastic reaction–diffusion systems,” J. Math. Biol., 1–83 (2011). [DOI] [PMC free article] [PubMed] [Google Scholar]
- Kang H. W., Zheng L., and Othmer H. G., “The effect of the signalling scheme on the robustness of pattern formation in development,” Interface Focus 2(4), 465 (2012). 10.1098/rsfs.2011.0116 [DOI] [PMC free article] [PubMed] [Google Scholar]
- Kim D., Kwon Y. K., and Cho K. H., “Coupled positive and negative feedback circuits form an essential building block of cellular signaling pathways,” BioEssays 29(1), 85–90 (2007). 10.1002/bies.20511 [DOI] [PubMed] [Google Scholar]
- Lander A. D., Lo W. C., Nie Q., and Wan F. Y. M., “The measure of success: Constraints, objectives, and tradeoffs in morphogen-mediated patterning,” Cold Spring Harb. Perspect. Biol. 1(1), a002022 (2009). 10.1101/cshperspect.a002022 [DOI] [PMC free article] [PubMed] [Google Scholar]
- Lander A. D., Nie Q., and Wan F. Y. M., “Do morphogen gradients arise by diffusion?” Dev. Cell 2(6), 785–796 (2002). 10.1016/S1534-5807(02)00179-X [DOI] [PubMed] [Google Scholar]
- Lei J., Wan F. Y. M., Lander A. D., and Nie Q., “Robustness of signaling gradient in Drosophila wing imaginal disc,” Discrete Contin. Dyn. Syst., Ser. B 16(3), 835–866 (2011). 10.3934/dcdsb.2011.16.835 [DOI] [PMC free article] [PubMed] [Google Scholar]
- Lopes F. J. P., Vieira F. M. C., Holloway D. M., Bisch P. M., and Spirov A. V., “Spatial bistability generates hunchback expression sharpness in the Drosophila embryo,” PLOS Comput. Biol. 4(9), e1000184 (2008). 10.1371/journal.pcbi.1000184 [DOI] [PMC free article] [PubMed] [Google Scholar]
- Munsky B., Neuert G., and van Oudenaarden A., “Using gene expression noise to understand gene regulation,” Science 336(6078), 183–187 (2012). 10.1126/science.1216379 [DOI] [PMC free article] [PubMed] [Google Scholar]
- Paulsson J., “Summing up the noise in gene networks,” Nature (London) 427(6973), 415–418 (2004). 10.1038/nature02257 [DOI] [PubMed] [Google Scholar]
- Peccoud J. and Ycart B., “Markovian modeling of gene-product synthesis,” Theor Popul. Biol. 48(2), 222–234 (1995). 10.1006/tpbi.1995.1027 [DOI] [Google Scholar]
- Pedraza J. M. and van Oudenaarden A., “Noise propagation in gene networks,” Sci. STKE 307(5717), 1965 (2005). 10.1126/science.1109090 [DOI] [PubMed] [Google Scholar]
- Rojdestvenski I., Cottam M., Park Y.-I., and Öquist G., “Robustness and time-scale hierarchy in biological systems,” Biosystems 50(1), 71–82 (1999). 10.1016/S0303-2647(98)00092-6 [DOI] [PubMed] [Google Scholar]
- Shibata T. and Fujimoto K., “Noisy signal amplification in ultrasensitive signal transduction,” Proc. Natl. Acad. Sci. U.S.A. 102(2), 331 (2005). 10.1073/pnas.0403350102 [DOI] [PMC free article] [PubMed] [Google Scholar]
- Tostevin F., Ten Wolde P. R., and Howard M., “Fundamental limits to position determination by concentration gradients,” PLOS Comput. Biol. 3(4), e78 (2007). 10.1371/journal.pcbi.0030078 [DOI] [PMC free article] [PubMed] [Google Scholar]
- Tsai T. Y.-C., Choi Y. S., Ma W., Pomerening J. R., Tang C., and Ferrell J. E., “Robust, tunable biological oscillations from interlinked positive and negative feedback loops,” Science 321(5885), 126–129 (2008). 10.1126/science.1156951 [DOI] [PMC free article] [PubMed] [Google Scholar]
- Umulis D. M., Serpe M., OÕConnor M. B., and Othmer H. G., “Robust, bistable patterning of the dorsal surface of the Drosophila embryo,” Proc. Natl. Acad. Sci. U.S.A. 103(31), 11613–11618 (2006). 10.1073/pnas.0510398103 [DOI] [PMC free article] [PubMed] [Google Scholar]
- Wang L., Xin J., and Nie Q., “A critical quantity for noise attenuation in feedback systems,” PLOS Comput. Biol. 6(4), e1000764 (2010). 10.1371/journal.pcbi.1000764 [DOI] [PMC free article] [PubMed] [Google Scholar]
- Yan S. J., Zartman J. J., Zhang M., Scott A., Shvartsman S. Y., and Li W. X., “Bistability coordinates activation of the EGFR and DPP pathways in Drosophila vein differentiation,” Mol. Syst. Biol. 5(1), 278 (2009). 10.1038/msb.2009.35 [DOI] [PMC free article] [PubMed] [Google Scholar]
- Zhang J., Yuan Z., and Zhou T., “Physical limits of feedback noise-suppression in biological networks,” Phys. Biol. 6, 046009 (2009). 10.1088/1478-3975/6/4/046009 [DOI] [PubMed] [Google Scholar]


