

Abstract
The flow-induced responses of four self-oscillating synthetic vocal fold models are compared. All models were life-sized and fabricated using flexible silicone compounds with material properties comparable to those of human vocal fold tissue. Three of the models had two layers of different stiffness to represent the body–cover grouping of vocal fold tissue. Two of the two-layer models were based on the “M5” geometry [Scherer et al., J. Acoust. Soc. Am. 109, 1616–1630 (2001)], while the third was based on magnetic resonance imaging data. The fourth model included several layers, including a thin epithelial layer, an exceedingly flexible superficial lamina propria layer, a ligament layer that included an anteriorly–posteriorly oriented fiber to restrict vertical motion, and a body layer. Measurements were performed with these models in full larynx and hemilarynx configurations. Data included onset pressure, vibration frequency, glottal flow rate, maximum glottal width, and medial surface motion, the latter two of which were acquired using high-speed imaging techniques. The fourth, multi-layer model exhibited onset pressure, frequency, and medial surface motion traits that are comparable to published human vocal fold data. Importantly, the model featured an alternating convergent–divergent glottal profile and mucosal wave-like motion, characteristics which are important markers of human vocal fold vibration.
INTRODUCTION
The nature of the structural vibratory characteristics of the human vocal folds is a central element of human phonation. Consequently, being able to observe, measure, and study vocal fold vibratory motion is important for understanding the physics of phonation and the diagnosis and treatment of voice disorders. One example characteristic is the “mucosal wave,” a typical feature of healthy human vocal fold vibration (Shaw and Deliyski, 2008; Voigt et al., 2010). Excised canine and human vocal folds have been used in hemilarynx configurations to study mucosal wave properties and have contributed to an improved understanding of the important role of medial surface dynamics in human voice production (e.g., Berry et al., 2001b; Doellinger et al., 2005; Doellinger and Berry, 2006a,b; Boessenecker et al., 2007).
Along with excised larynx experiments, synthetic model experiments have been useful subjects in voice research; for example, in measuring vocal fold collision forces (Spencer et al., 2008), characterizing supraglottal aerodynamics (Neubauer et al., 2007), and developing in vivo measurement devices (Popolo and Titze, 2008). They are beneficial because their geometries and material properties can be parametrically varied using a repeatable fabrication process and they are usable for longer durations than excised larynges.
Because of the known significance of the role of medial surface dynamics on vocal fold vibration and the growing use of synthetic models mimicking human vocal fold motion, it is important that synthetic vocal fold models exhibit vibratory responses that are similar to those of human vocal folds. It is thus necessary for the medial surface motion of synthetic models to be compared with that of excised human vocal folds.
Some quantitative measures of synthetic model motion have been reported. For example, Berry et al. (2006) used a single-layer model in a hemilarynx experiment and applied the method of empirical eigenfunctions to study mechanisms of irregular vibration in sub-harmonic phonation and bi-phonation. The model geometry was based on the M5 geometry of Scherer et al. (2001). Acoustically and aerodynamically driven modes of vibration have been studied using similar synthetic vocal fold models (Zhang et al., 2006a,b, 2009). Spencer et al. (2008), also using a single-layer M5 model, used superior surface stress and strain data to predict contact stresses. High-speed superior surface imaging and videokymographic approaches have also been used to characterize synthetic model motion (Drechsel and Thomson, 2008; Pickup and Thomson, 2009, 2010). However, lacking are direct measurements of synthetic model medial surface motion (e.g., trajectories of points on the medial surface), the acquisition of which is necessary for quantitative comparison of synthetic model motion with human vocal fold motion.
Additionally, there is a need for synthetic vocal fold models that exhibit mucosal wave-like motion. This can perhaps be best understood by considering the following two types of self-oscillating vocal fold models that have been reported in the literature [note that an extensive survey of synthetic vocal fold models can be found in Kniesburges et al. (2011)].
The first is a fluid-filled cavity covered by a membrane, formed by placing a thin layer of silicone over a hexagonal rod and injecting fluids of varying viscosities between the silicone membrane and the rod surface (Titze et al., 1995). This model approximated the epithelium and superficial layer of the lamina propria (SLLP) layer and was used, in part, to validate the theory that the SLLP fluid viscosity had a large effect on onset pressure (Titze, 1988). Chan et al. (1997) and Chan and Titze (2006) extended the use of this model by varying the silicone thickness, changing the glottal convergence angle, and using injected viscoelastic biomaterials. Studies were performed to explore sensitivity of model onset pressure to changes in epithelial membrane thickness, pre-vibratory glottal half-width, mucosa viscosity, and glottal divergence angle. Other similar membrane-type models have been developed and used to study vocal fold vibration [e.g., the water-filled latex tube model used by Ruty et al. (2007)]. Anecdotally, these models are quite durable over long periods of time. Detailed measurements of the surface dynamics of these models to determine whether they produce an alternating convergent–divergent glottal profile and/or mucosal wave-like motion have not been reported. One limitation of this model concept is that it allows for only limited control over initial geometry.
The second type of self-oscillating vocal fold model is that which is created by casting flexible rubber (usually silicone) models in molds of the desired geometry. Thomson et al. (2005) created a single-layer (homogeneous) model of this type with a modulus of elasticity of 13.7 kPa (which is comparable to that of vocal fold tissue) and a shape based on the M5 model. This model was of the same size scale as the human vocal folds (anterior–posterior dimension of 17 mm), had an onset pressure of 1.2 kPa [compared to around 0.29–0.49 kPa for human phonation, Baken and Orlikoff (2000)], and vibrated at a frequency of 120 Hz (close to that of an adult human male). This same type of model was subsequently used in other studies to study, for example, vibration patterns and glottal jet behavior (e.g., Berry et al., 2006; Zhang et al., 2006a,b; Neubauer et al., 2007; Spencer et al., 2008; Popolo and Titze, 2008; Zhang et al., 2009).
Motivated by the cover–body theory of vocal fold vibration (e.g., Hirano and Kakita, 1985), the single-layer cast-mold concept has been extended to the development of two-layer models. These models have consisted of a relatively stiff body layer with a more flexible cover layer. For reference the cross section of a two-layer M5 model is shown in Fig. 1 (note that the other three models in Fig. 1 are cross sections of other models used in the present study and are explained in the following paragraphs). Both layers are typically fabricated using a silicone molding process similar to that of the single-layer models, only in two successive steps to generate the two layers. These models have been used to study supraglottal jet dynamics (Drechsel and Thomson, 2008), to explore the influence of asymmetric material properties on model response (Pickup and Thomson, 2009), and to study mammalian air sac vocalization (Riede et al., 2008). In these studies, Young's modulus values of the layers have ranged from approximately 8 to 23 kPa for the body and from 2 to 9 kPa for the cover.
Figure 1.

Cross-sectional illustrations of four self-oscillating synthetic vocal fold models. Clockwise from the upper left-hand side: M5-Uniform (M5-UNI), M5-Convergent (M5-CONV), Epithelium (EPI), and Magnetic Resonance Imaging (MRI) models.
Advantages of the cast-model concept include ease of geometric and material property parameterization, durability (relative to excised larynges), and relatively good agreement with human vocal fold vibration in terms of frequency and vibration amplitude. Noted disadvantages include high onset pressure and less-than-lifelike motion, the latter including prominent inferior–superior displacement, minimal alternating convergent–divergent profile, and limited or no mucosal wave-like motion. These disadvantages have generally been attributed to geometric and material simplifications (i.e., idealized geometry, isotropic materials, and only two layers). Additionally, the properties of the silicone materials may also tend to gradually change over time more than those of the materials used in the membrane-type models discussed previously.
Pickup and Thomson (2010) tested a two-layer synthetic model using geometry from magnetic resonance imaging (MRI) data of the larynx, a cross section of which is shown in Fig. 1. The model was fabricated in the same manner as the two-layer models described previously. Compared to a two-layer M5 model that had the same material properties as the MRI model, it was reported that the MRI model appeared to vibrate with less vertical displacement and showed evidence of a convergent/divergent profile and a mucosal wave, although no data were provided to quantify these observations. However, the model's onset pressure was significantly higher (1.86 kPa) than that of the two-layer M5 model (0.91 kPa) and also displayed some anterior–posterior asymmetric motion.
Motivated by the improved motion of the MRI model, which had the same material properties as the M5 model but vibrated quite differently, Pickup and Thomson (2011) used finite element analysis to study the degree to which specific geometric features played a significant role in governing the M5 model motion. The geometric features shown in Fig. 2 were varied. The primary geometries that most affected parameters such as maximum glottal width, alternating convergent–divergent motion, and mucosal wave-like motion, were identified. It was suggested that improved model motion could be achieved by adopting a convergent pre-phonatory profile (θ2c) and enlarging the entrance radius (r1c).
Figure 2.

Geometric parameters for the M5-UNI, M5-CONV, and EPI models.
To summarize the two model types, the membrane-type models have flexible covers (as is the case with the human vocal folds), but precise control over initial geometry is not feasible. The one- and two-layer models have more control over initial geometry, thereby potentially allowing for a wider range of parametric studies. They represent some aspects of human phonation well, but limitations include little or no mucosal wave-like motion (as in the M5 models), high onset pressure and anterior–posterior asymmetric motion (as in the MRI model), and the use of isotropic materials (both M5 and MRI models).
The purposes of this paper are twofold. The first is to describe a synthetic model that includes the advantages of previous synthetic models (repeatability and control over geometry) and that overcomes some important previous limitations, i.e., it has a low onset pressure, reduced inferior–superior motion, an alternating convergent–divergent glottal profile, and mucosal wave-like motion. The model includes a cover that is composed of a thin epithelial layer on top of a very flexible material, a ligament layer that includes an anteriorly–posteriorly oriented fiber that restricts vertical motion, and a body layer. The second purpose is to quantify the medial surface motion of several synthetic, self-oscillating vocal fold models. Cross sections of the models are shown in Fig. 1. The models include a two-layer model of the original M5 geometry, a modified M5 model based on the computational results of Pickup and Thomson (2011), the MRI model of Pickup and Thomson (2010), and the new model described herein. Other measures such as onset pressure, frequency, and maximum glottal width are also reported. The model results are compared with human vocal fold data.
METHODS
Self-oscillating synthetic models
The vibratory responses of the four different synthetic models illustrated in Fig. 1 were measured. Three were two-layer cover–body models in which the cover layers were more flexible than the body layers. Two of these cover–body models were modifications of the M5 geometry (Scherer et al., 2001) according to the geometric parameter definitions shown in Fig. 2 and the parameter values listed in Table TABLE I.. One of these M5-derived models had a uniform glottal profile (here denoted as the “M5-UNI” model). Models similar to this have been used in previous studies (e.g., Riede et al., 2008; Drechsel and Thomson, 2008; Pickup and Thomson, 2009, 2010). The other M5-derived model had a 5° convergent glottal profile (“M5-CONV”). The geometry of the third two-layer model was derived from MRI data (“MRI”) as reported by Pickup and Thomson (2010).
TABLE I.
Values for the geometric parameters used in the M5-UNI, M5-CONV, and EPI models, defined as shown in Fig. 2.
| Parameter | M5-UNI | M5-CONV | EPI |
|---|---|---|---|
| θ1b,c | 50° | 50° | 50° |
| θ2b,c | 0° | 5° | 5° |
| θ3b,c | 90° | 90° | 90° |
| r1c | 1.5 mm | 1.5 mm | 6.0 mm |
| r2c | 0.987 mm | 0.987 mm | 0.987 mm |
| r1b | 1.12 mm | 1.12 mm | 2.0 mm |
| r2b | 0.513 mm | 0.513 mm | 0.513 mm |
| T | 2 mm | 2 mm | 0.1 mm |
| t | 1.5 mm | 1.5 mm | 1.5 mm |
| δ | 1.5 mm | 1.5 mm | 2.0 mm |
| H | 8.4 mm | 8.4 mm | 8.4 mm |
The cover layer of vocal fold models needs to withstand the periodic impact and large-amplitude motion that occurs during vibration. Consequently, in two-layer cover–body models, the cover layer modulus of elasticity has typically been higher than that of the human vocal fold cover (e.g., Chan and Titze, 1999). However, the highly flexible cover is likely key in mucosal wave generation. The fourth model, here denoted as the “EPI” model, was designed to overcome the cover stiffness limitation of two-layer models by creating an extremely flexible SLLP and covering this layer with a thin epithelium layer. This was somewhat similar to the model concept described by Titze et al. (1995), although the SLLP layer in this study was an elastic material generally capable of maintaining shape. The model also included a ligament layer, the center of which contained an anteriorly–posteriorly oriented acrylic fiber. The fiber could be tensioned to introduce anisotropy in a manner analogous to the large longitudinal tensions of the collagen fibers in the human ligament (Titze, 2000).
Like the M5-UNI and M5-CONV models, the EPI model was defined using the same parameters shown in Fig. 2, but with different values (see Table TABLE I.) chosen based on two considerations. The first was to create a more rounded medial surface such as that which has been shown to exist in humans (Berry et al., 2001a; Sidlof et al., 2008; Pickup and Thomson, 2010). The second was to follow the work of Pickup and Thomson (2011), which suggested that a pre-phonatory convergent profile (θ2b,c) and large entrance radius (r1b,c) should be favorable for generating mucosal wave-like motion.
All models were fabricated using addition-cure silicone rubber. The two-layer model fabrication process has been described elsewhere (Drechsel and Thomson, 2008; Riede et al., 2008). The EPI model fabrication process is detailed in Murray and Thomson (2011) and Murray (2011) and is summarized here (see Fig. 3). First, computer-aided design (CAD) solid models of each layer were made using the software package Pro/Engineer, from which rapid prototype models were created. Molds were created from these rapid-prototyped models using the commercial mold-making compound Smooth-Sil 950 (this and all other materials listed here are manufactured by Smooth-On, Inc., Easton, PA) For each layer liquid two-part silicone (EcoFlex®, hereafter abbreviated as EF) and silicone thinner compounds were mixed using the desired ratio (discussed in the following), degassed, poured into the corresponding mold cavity, and cured in an oven at about 120 °C for 1 h. For fiber placement in the ligament layer of the EPI model, the mold was cut in the anterior–posterior direction with a straight razor. Before the silicone was poured into this section, the acrylic fiber was inserted into the cut with approximately 10 cm of excess fiber on either side of the mold. The SLLP was then cast in a manner similar to that of the previous layers [see Murray and Thomson (2011) for step-by-step EPI model fabrication instructions, including casting the SLLP layer]. After the models were made and the support material removed, a stiffer three-part silicone mixture (Dragon Skin®, hereafter abbreviated as DS) was poured over the model and allowed to cure. The last step was repeated, resulting in two layers of durable silicone “epithelium” on the exterior of the model.
Figure 3.

(Color online) EPI model fabrication process schematic, including cross sections of CAD models used for rapid prototyping, molds, and creation of the various layers. Shown at bottom is a finished model with all layers.
Concurrent with the fabrication of each vocal fold model was the simultaneous casting of rheological test specimens for characterizing material properties. The rheological properties of the silicone materials were measured using a controlled strain oscillatory shear test over a range of frequencies (AR 2000EX Rheometer, TA Instruments, New Castle, DE). The rheological specimens were disks measuring 40 mm in diameter and 2 mm thick. The specimens were subjected to an oscillation cycle ranging from 1 to 10 Hz at 4% strain to determine the elastic (G′) and the viscous (G″) shear moduli. The results are shown in Fig. 4. Properties of the various layers were similar to those of human vocal fold tissues in the small-strain regime (Chan and Titze, 1999; Titze, 2006; Chan et al., 2007; Chan and Rodriguez, 2008).
Figure 4.

Elastic (G′) and viscous (G″) shear moduli for various ratios of silicone. Included are representative data of the human cover from Chan et al. (2007).
The body and cover layers of the M5-UNI, M5-CONV, and MRI models were made using EF 1:1:2 (i.e., Ecoflex with a mixing ratio of one part A, one part B, and two parts silicone thinner) and EF 1:1:4 ratios, respectively. The ratios of the EPI model layers were EF 1:1:1, EF 1:1:4, EF 1:1:9, and DS 1:1:1 for the body, ligament, SLLP, and epithelium, respectively.
The fiber used in the EPI model was a bundled strand of very small fibers. To measure the EPI diameter of the fiber bundle, a tension of 0.59 N (60.3 g) was applied to the bundle in order to approximate the diameter of the fiber bundle during actual testing (see Sec. 2B). Using images acquired using a calibrated microscope, the diameter was estimated to be 0.18 mm. The Young's modulus of the fiber bundle was estimated by testing seven samples in an Instron (Norwood, MA) 3342 tensile test apparatus. Using the 0.18 mm diameter along with the measured tensile forces, the calculated average and standard deviation of the Young's modulus values were 2.57 × 10⁶ and 0.475 × 10⁶ Pa, respectively.
To estimate the epithelium thickness in the EPI models, coronal cross sections of two sample models were cut in increments of approximately 4 mm (i.e., one at the approximate medial-lateral midplane and two approximately 4 mm on either side). For visibility in these sample models, the epithelium layer was dyed white (no dye was added to the SLLP layer). In order to cut the models with minimal deformation, they were placed in isopropyl alcohol to which frozen carbon dioxide was added in order to cool to a temperature of −60 °C. This stiffened the silicone. A scalpel, also at −60 °C, was then used to cut the model. A calibrated microscope (Olympus, Shinjuku-ku, Tokyo, SZX 12) with a 25 × magnification factor was then used to image the coronal section (see Fig. 5). (Note that in this image, the reason that the lower boundary does not appear to continue superiorly is due to deformation and subsequent occlusion introduced by the cut.) Multiple measurements were taken along the medial and inferior surfaces, the mean and standard deviation of which are listed in Table TABLE II.. The mean of the six data values in Table TABLE II. is 87 μm.
Figure 5.
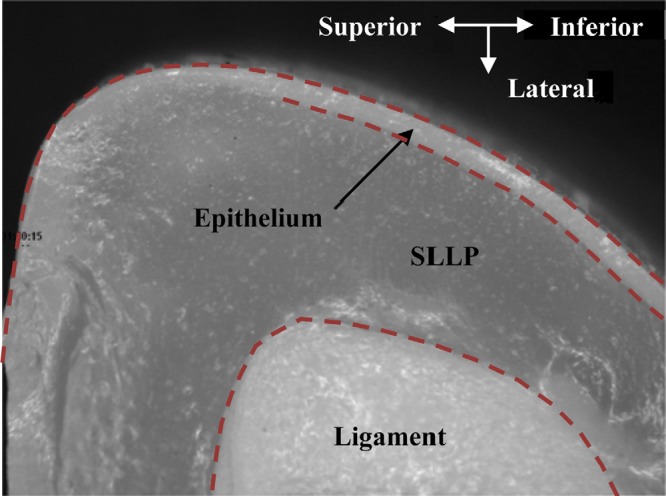
(Color online) Sample image of a coronal section of the EPI model showing the epithelium, cover, and ligament layers.
TABLE II.
Epithelium thickness measurements for the EPI model at three cross sections of two models.
| Epithelium thickness (μm) a | |||
|---|---|---|---|
| Model | Left | Center | Right |
| 1 | 91 (5) | 76 (9) | 76 (11) |
| 2 | 93 (7) | 91 (16) | 97 (4) |
Standard deviation is shown in parentheses.
Experimental setup and procedure
Full larynx and hemilarynx configurations were used to acquire frequency, onset pressure, maximum glottal width, flow rate, and medial surface high-speed image data. Figure 6 shows the full larynx setup. Air from a compressed air source flowed to the vocal fold models via a rigid plenum and an approximately 53 cm long subglottal tube. Flow rate was measured using a rotameter-type flow meter (Key Instruments, Trevose, PA, FR4A37BVBN). A pressure transducer (Omega, Stamford, CT, PX 138-001D5V) was mounted in the subglottal tube wall approximately 3 cm upstream of the model. A Photron APS-RX high-speed digital camera with a Nikkor 105 mm AF microlens captured images of the model motion at a rate of 3000 frames per second (fps) with a 1/6000 s shutter speed. Four high-intensity light-emitting diode lights were used for illumination (Visual Instrumentation Corporation, Lancaster, CA, 900415).
Figure 6.

Full larynx experimental setup (not to scale).
In some tests tension was applied to the thread in the EPI model by suspending a mass (31 g) from each end of the thread, for a total tension of 0.61 N (from the 62 g total suspended mass) in each thread. The 31 g mass was selected through a trial-and-error process to find a weight that applied sufficient tension to the fiber to significantly restrict the model's inferior–superior vibratory motion. For reference, this value compares with the 10–300 g measured by van den Berg and Tan (1959) and with the values of 10, 20, and 50 g used by Doellinger and Berry (2006b). The thread was oriented such that tension was only applied in the anterior–posterior direction (see Figs. 67). In all cases the models were positioned such that in the absence of flow, the medial surfaces were just touching so that the glottal gap was zero before vibration began. High-speed images of each model's superior surface were acquired at pressures corresponding to 110%, 120%, and 130% of each model's measured onset pressure (here denoted as 1.1Pon, 1.2Pon, and 1.3Pon, respectively). The images were processed using a custom MATLAB code that identified the edge of the vocal fold models using grayscale intensity thresholding and that calculated the maximum glottal width [see Murray (2011) for further details]. Frequency was found using the subglottal pressure data acquired using a National Instruments PXI-1042Q data acquisition system and custom LabVIEW programming.
Figure 7.

Hemilarynx experimental setup (not to scale).
In order to view the medial surface of the vocal fold models during vibration, a hemilarynx setup similar to previous studies (e.g., Berry et al., 2001b; Boessenecker et al., 2007) was used, as illustrated in Fig. 7. Stereo images of the medial surface motion were recorded using two synchronized Photron SA3 high-speed digital cameras at 3000 fps and with a 1/6000 s shutter speed. Each camera was fitted with a Nikkor 50 mm lens and a Zeikos 12 mm extension ring. The same methods as mentioned previously were used to acquire frequency, onset pressure, and flow rate. Each model was positioned such that the medial surface just touched the clear acrylic plate in the no-flow state. Tension was applied to the thread of the EPI model in the same manner as in the full larynx tests.
Calibration and quantification of the image space was done using a direct linear transform (DLT) (Abdel-Aziz and Kakara, 1971); details can be found in Murray (2011). This method transforms point locations from stereo two-dimensional images to three-dimensional locations. Because the DLT method extrapolates poorly (Chen et al., 1994), a calibration target that was large enough to encompass the entire investigation area was used. Six markers of black paint (Rust-Oleum, V2178 Flat Black) were applied to the medial and inferior surface of the vocal fold models (Fig. 8). Matching points were selected manually in each image and used by a custom, semi-automated, cross-correlation tracking program in MATLAB to extract the medial surface trajectories. Wave velocity and phase delay measures were calculated from the trajectories using the method described by Titze et al. (1993).
Figure 8.

Stereo image pair of the M5-CONV model used for medial surface tracking. Direction of airflow is from the bottom to the top of the images.
RESULTS AND DISCUSSION
Onset pressure
Onset pressure average and standard deviation values, listed in Table TABLE III., were found by increasing the subglottal pressure and recording the pressure at which vibration commenced. This was repeated five times for one of each type of model. For comparison, typical human values from Baken and Orlikoff (2000) are included in Table TABLE III.. The EPI model onset pressure was significantly lower than that of the others and was the only model that yielded values within the reported physiological values. This does not mean, however, that the other models do not operate at physiological realistic pressures, since pressures on the order of 1–2 kPa are not uncommon during loud speech and singing. The especially high onset pressure of the MRI model has been cited as one of its limitations (Pickup and Thomson, 2009).
TABLE III.
Mean and standard deviation (in parentheses) of onset pressure data for the various models in the full larynx and hemilarynx configurations.
| Onset pressure (kPa) | ||
|---|---|---|
| Model | Full larynx | Hemilarynx |
| M5-UNI | 0.84 (0.008) | 1.36 (0.011) |
| M5-CONV | 0.87 (0.007) | 1.11 (0.011) |
| MRI | 1.68 (0.005) | 1.89 (0.013) |
| EPI, no tension | 0.37 (0.009) | 0.50 (0.005) |
| EPI, with tension | 0.27 (0.022) | 0.43 (0.013) |
| Human | 0.29–0.49 a | — |
Vibration frequency
Frequency data for all models are shown in Fig. 9a. The vibration frequency for all models at all subglottal pressures fell within the range of the human voice (98–246 Hz) (Titze, 2000). The MRI model had the highest frequency of all models. The EPI model with no tension had the lowest frequency. Adding tension to the thread increased the frequency of the EPI model by approximately 10 Hz. For all of the models except the MRI model, the frequency generally slightly decreased with increasing subglottal pressure. This has been observed in other studies using similar synthetic models, for reasons that are not yet fully understood. It is possibly due to a combination of the linearity of the silicone material stress–strain response and possible acoustic coupling. Regarding the latter, based on the results of other tests using similar synthetic models (Zhang et al., 2006a,b, 2009), it is likely that some of these models were at least partially coupled with upstream tube resonances. As is shown in Sec. 3C, increasing the subglottal pressure increased the maximum glottal width, which would alter the impedance of the system at the downstream end of the tube. This would in turn alter the tube resonance frequencies (possibly lowering the fundamental), and in acoustically coupled models, thereby affect the model vibration frequency.
Figure 9.

(Top) Frequency, (middle) maximum glottal width, and (bottom) flow rate for the models at 110%, 120%, and 130% of their respective onset pressures. M5-UNI (•), M5-CONV (○), MRI (×), EPI without tension (+), and EPI with tension (□).
Acoustic coupling in single-layer models has been previously reported (Zhang et al., 2006a,b, 2009), and other data suggest that the two-layer model also exhibits similar acoustic coupling (Drechsel, 2007). To gain insight into the degree of acoustic coupling present in the EPI model, the frequency of an EPI model (separate from the EPI model described elsewhere in this paper, but fabricated using the same methods) was measured with different subglottal tube lengths. At a tube length of 50 cm, the model vibration frequency was 109 Hz. As the tube length was increased to 125 cm, the vibration frequency decreased approximately linearly to 70 Hz. This change in vibration frequency with tube length provides evidence that subglottal acoustic resonances influenced the EPI model vibration in the present studies, although further experiments would be needed to determine the relative contributions of aerodynamic vs acoustic coupling in this model with these and shorter tube lengths.
Maximum glottal width
As can be seen in Fig. 9b, the model with the largest maximum glottal width was the M5-UNI model. The M5-CONV and MRI models had comparable maximum glottal widths. The maximum glottal width of the EPI model decreased by approximately 1 mm when tension was applied to the fiber. It also had the smallest glottal width of all models tested. For excised human vocal folds, the range of maximum glottal width is approximately 0.5–4 mm (Doellinger and Berry, 2006b). Each of the models yielded data in this range.
Glottal flow rate
The MRI model had the highest flow rate [see Fig. 9c], likely due to the higher subglottal pressure required to induce vibration and in spite of a slightly smaller glottal area. In comparing the M5-CONV and the M5-UNI models, the lower subglottal pressure and glottal width resulted in a lower flow rate for the M5-CONV model than the M5-UNI model. The EPI model without tension had almost twice the flow rate as the EPI model with tension, likely primarily due to the larger glottal width during the oscillation cycle. Only the data from the EPI with tension were within the range of the mean airflow during sustained phonation for humans (70–220 ml/s; Baken and Orlikoff, 2000).
Superior surface imaging
Superior views of one period of oscillation for each model at 1.2Pon are shown in Fig. 10. The large glottal width of the M5-UNI model is evident, and it can be seen that the M5-UNI and M5-CONV models exhibited primarily divergent medial surface profiles over the oscillation period (discussed further in the following). The MRI model exhibited an anterior–posterior wave that was possibly due to the asymmetric nature of the vocal fold model geometry. In this view, the EPI model motion appears to be qualitatively similar with and without tension, with the maximum width being reduced with applied tension. Qualitatively speaking, the EPI and MRI models seemed to exhibit the most realistic vibratory responses; this is supported by further analysis and quantitative measures given in the following paragraph and in Sec. 3F.
Figure 10.

Superior view high-speed images of each model over one cycle. All images were obtained with the models vibrating at 120% of their respective onset pressures.
High-speed kymograms of one cycle of oscillation for the four models provide insight into the movement of their medial surfaces. During the opening phase of human phonation, when viewed from above, the inferior margin of the medial surface is occluded by the superior margin because of a convergent profile (Titze et al., 1993). As can be seen in Fig. 11, the vibration patterns for the M5-UNI and M5-CONV models were both such that the inferior margin of the medial surface was hidden only briefly during the opening phase. This suggests that the models did not exhibit a convergent profile except for possibly during a very brief portion of the opening phase. By contrast, the MRI model and the EPI model (both with and without tension) showed the superior margin of the medial surface occluding the inferior margin for a longer duration. Thus the angle appeared to be convergent for a large portion of the opening phase and divergent for the remainder of the cycle, similar to what has been observed in kymograms of human larynges (Svec et al., 2007).
Figure 11.

High-speed kymograms of one period for the four models. Estimated locations of the superior (black) and inferior (white) margins are shown by dotted lines.
Medial surface tracking
The marker trajectories obtained in the hemilarynx configuration, with each model driven at 120% of its onset pressure, were calculated and are shown over several phases of a cycle in Fig. 12. The data confirm that the M5-UNI and M5-CONV models had a primarily divergent upper medial surface profile throughout the oscillation period, with only very slight mucosal wave-like motion. The MRI and EPI models exhibited clear mucosal wave-like motion from the inferior to superior portion of the model, less vertical displacement than the M5-UNI and M5- CONV models, and an alternating convergent–divergent profile (convergent during opening, divergent during closing).
Figure 12.

(Color online) Medial surface motion at six phases of oscillation at 1.2Pon. Horizontal and vertical axes denote, respectively, medial-lateral and inferior–superior positions (mm). The vertical dashed line denotes the position of the clear acrylic plate. In each frame the thin solid lines are traces of the markers during oscillation, and the thick solid line is a spline interpolation between markers to approximate the position of the medial surface at the given phase. The left column corresponds to the phase near glottal opening.
Qualitatively, the MRI and EPI motion patterns were more similar to those observed in excised larynx experiments than the M5-UNI and M5-CONV models. Quantitative agreement between the MRI and EPI model data and human vocal fold data was also better. Table TABLE IV. lists several quantities pertaining to mucosal wave properties calculated from the marker trajectories. Representative values from the literature are included for reference. Note that the displacement values in Table TABLE IV. are measured from the marker trajectories, and are thus different than the glottal width values discussed in Sec. 3C. Lateral and vertical displacement values for the M5-UNI and M5-CONV models are significantly greater than those found in the literature. The MRI and EPI models' values of lateral displacement are slightly higher than the literature value, but much closer than the M5-UNI and M5-CONV model values. The same is true for the vertical displacement of the EPI models. The vertical displacement of the MRI model was lower than the published value. Similar tendencies are seen with the remaining values of absolute velocity, wave velocity, and phase angle. Taken as a whole, the EPI model data exhibit better overall agreement with the published values than those of the other models.
TABLE IV.
Calculated mucosal wave properties, acquired at 1.2Pon.
| Parameter | M5-UNI | M5-CONV | MRI | EPI—no tension | EPI—tension | Representative published value |
|---|---|---|---|---|---|---|
| Lateral displacement (mm) | 3.10 | 3.15 | 2.46 | 2.20 | 2.27 | 1.90 a |
| Vertical displacement (mm) | 1.82 | 3.12 | 0.98 | 1.47 | 1.42 | 1.36 b |
| Absolute velocity (m/s) | 0.78 | 1.82 | 1.32 | 1.18 | 1.26 | 1.62 b |
| Wave velocity (m/s) | 2.76 | 2.82 | 3.33 | 1.27 | 1.18 | 0.5–2.2 c |
| Phase angle (°/mm) | 13.4 | 15.9 | 15.1 | 24.7 | 30.1 | 24–60 c |
Repeatability and longevity
For insight into the repeatability and the longevity of the EPI model, an EPI model was tested on two different occasions. This is the same model used in the frequency vs subglottal tube experiments discussed in Sec. 3B. Here, an upstream flow supply tube of 0.5 m was used. The model (with tension) initially vibrated at a frequency of 109 Hz with an onset pressure of 0.36 kPa. This model was then used in a separate set of experiments in which it was vibrated for a duration on the order of a couple of hours, during which time it was subjected to extensive particle image velocimetry (PIV) studies in which fine oil particles were injected into the flow stream upstream of the model and came into contact with the model surface. The model was then set aside in the room-temperature laboratory. Retesting 13 days later showed that the model vibration frequency was then 123 Hz with an onset pressure of 0.43 kPa. The values from this model compare reasonably well with the data in Fig. 9a and Table TABLE III. for the EPI model with tension. While further studies could be performed to document all aspects of repeatability and longevity, these data indicate reasonable similarity between models fabricated at different times, as well as relative stability in model response over an extended time period, certainly much longer than that which can be achieved using excised canine tissue. It is noted, however, that the silicone-based models used in these studies likely may not have the same degree of durability and stability as the fluid-filled latex tube models.
CONCLUSIONS
The vibratory responses of four synthetic vocal fold models were compared using measurements of onset pressure, frequency, maximum glottal width, flow rate, and medial surface motion. These data were also compared with results from human data. Included in this model set was a new model (EPI) that included epithelial and extremely flexible superficial lamina propria layers.
The EPI model onset pressure was the lowest of the four models and was within the range of data reported in the literature for human phonation. Importantly, the EPI model, along with the MRI model, vibrated with an alternating convergent–divergent motion and evidence of a vertically traveling mucosal wave. These are two vibratory features that are important characteristics of human vocal fold vibration but were missing in previous one- and two-layer vocal fold models with M5-based geometries. The data presented here confirm that the M5-UNI and M5-CONV medial surface profiles were primarily divergent throughout the oscillation cycle and that they exhibited only minor mucosal wave-like motion. It is interesting to note the relatively large differences between the M5-UNI and M5-CONV quantitative measures, in spite of only minor differences in geometry. Potential differences in these two models' responses due to variation in fabrication and mounting cannot be ruled out. The general natures of their vibratory movements were similar to each other, however, and were both clearly different than the MRI and EPI models. Other quantitative measures of the EPI model medial surface motion compared favorably with published data from excised human hemilarynx experiments. These advantages are attributed primarily to the extremely soft SLLP layer—which was able to be included because of the thin epithelial layer—that facilitated mucosal wave propagation.
Along with these advantages of the EPI model, its limitations are here noted. First, it is more difficult to fabricate because of the added layers and incorporation of the exceedingly flexible SLLP layer. Additionally, due to the delicate nature of the cover layer, it is likely not able to withstand as large deformations of the models with the stiffer cover, although it was able to sustain the physiologically realistic deformations encountered in the present study. Finally, the geometry is still somewhat idealized, and with the exception of the fiber in the ligament layer, is materially isotropic.
A few areas of additional research are here suggested. First, studies to quantify the relationship between large-amplitude mucosal wave propagation and material and geometric properties of the various layers, including tensioning and anisotropy, would be beneficial. Exploring the relationship between frequency and EPI model tension could be included in this study. Second, it is anticipated that incorporation of materials that are anisotropic and that have nonlinear stress–strain relationships (e.g., Shaw et al., 2012) would result in even more realistic vocal fold models. Third, additional exploration of acoustical phenomena associated with this model should be performed. This includes subglottic coupling, inclusion of a downstream vocal tract, exploration of coupling of model vibration with subglottic and supraglottic acoustic resonances, and characterization of radiated acoustics (e.g., sound pressure level, acoustic efficiency, and spectral content). Finally, it would be helpful to further measure factors related to durability and longevity of the EPI models, as well as repeatability using multiple, nominally identical models.
ACKNOWLEDGMENTS
This work was supported by Grant No. R01 DC009616 from the National Institute on Deafness and Other Communication Disorders (NIDCD). Its content is solely the responsibility of the authors and does not necessarily represent the official views of the NIDCD or the National Institutes of Health (NIH). The authors gratefully acknowledge the helpful suggestions from two anonymous reviewers. The authors thank Simeon Smith and Kimberly Stevens for help with preparing and conducting some of the experiments. S.L.T. gratefully acknowledges the Friedrich-Alexander University Erlangen-Nürnberg Graduate School in Advanced Optical Technologies for hosting and supporting his sabbatical leave, during which time portions of this manuscript were prepared.
References
- Abdel-Aziz, Y. I., and Karara, H. M. (1971). “ Direct linear transformation from comparator coordinates into object space coordinates in close-range photogrammetry,” in Proceedings of the Symposium on Close-Range Photogrammetry (American Society of Photogrammetry, Falls Church, VA), pp. 1–18.
- Baken, R. J., and Orlikoff, R. F. (2000). Clinical Measurement of Speech and Voice, 2nd ed. (Singular, San Diego: ), pp. 328, 358–363. [Google Scholar]
- Berry, D. A., Clark, M. J., Montequin, D. W., and Titze, I. R. (2001a). “ Characterization of the medial surface of the vocal folds,” Ann. Otol. Rhinol. Laryngol. 110(5 ), 470–477. [DOI] [PubMed] [Google Scholar]
- Berry, D. A., Montequin, D. W., and Tayama, N. (2001b). “ High-speed digital imaging of the medial surface of the vocal folds,” J. Acoust. Soc. Am. 110(5 ), 2539–2547. 10.1121/1.1408947 [DOI] [PubMed] [Google Scholar]
- Berry, D. A., Zhang, Z., and Neubauer, J. (2006). “ Mechanisms of irregular vibration in a physical model of the vocal folds,” J. Acoust. Soc. Am. 120(3 ), EL36–EL42. 10.1121/1.2234519 [DOI] [PubMed] [Google Scholar]
- Boessenecker, A., Berry, D. A., Lohscheller, J., and Eysholdt, U. D. (2007). “ Mucosal wave properties of a human vocal fold,” Acta Acust. 93, 815–823. [Google Scholar]
- Chan, R. W., Fu, M., Young, L., and Tirunagari, N. (2007). “ Relative contributions of collagen and elastin to elasticity of the vocal fold under tension,” Ann. Biomed. Eng. 35(8 ), 1471–1483. 10.1007/s10439-007-9314-x [DOI] [PubMed] [Google Scholar]
- Chan, R. W., and Rodriguez, M. L. (2008). “ A simple-shear rheometer for linear viscoelastic characterization of vocal fold tissues at phonatory frequencies,” J. Acoust. Soc. Am. 124, 1207–1219. 10.1121/1.2946715 [DOI] [PMC free article] [PubMed] [Google Scholar]
- Chan, R. W., and Titze, I. R. (1999). “ Viscoelastic shear properties of human vocal fold mucosa: Measurement methodology and empirical results,” J. Acoust. Soc. Am. 106(4 ), 2008–2021. 10.1121/1.427947 [DOI] [PubMed] [Google Scholar]
- Chan, R. W., and Titze, I. R. (2006). “ Dependence of phonation threshold pressure on vocal tract acoustics,” J. Acoust. Soc. Am. 119(4 ), 2351–2362. 10.1121/1.2173516 [DOI] [PubMed] [Google Scholar]
- Chan, R. W., Titze, I. R., and Titze, M. R. (1997). “ Further studies of phonation threshold pressure in a physical model of the vocal fold mucosa,” J. Acoust. Soc. Am. 101(6 ), 3722–3727. 10.1121/1.418331 [DOI] [PubMed] [Google Scholar]
- Chen, L., Armstrong, C. W., and Raftopoulos, D. D. (1994). “ An investigation on the accuracy of three-dimensional space reconstruction using the direct linear transformation technique,” J. Biomech. 27(4 ), 493–500. 10.1016/0021-9290(94)90024-8 [DOI] [PubMed] [Google Scholar]
- Doellinger, M., and Berry, D. A. (2006a). “ Computation of the three-dimensional medial surface dynamics of the vocal folds,” J. Biomech. 39, 369–374. 10.1016/j.jbiomech.2004.11.026 [DOI] [PubMed] [Google Scholar]
- Doellinger, M., and Berry, D. A. (2006b). “ Visualization and quantification of the medial surface dynamics of an excised human vocal fold during phonation,” J. Voice 20(3 ), 401–413. 10.1016/j.jvoice.2005.08.003 [DOI] [PubMed] [Google Scholar]
- Doellinger, M., Berry, D. A., and Berke, G. S. (2005). “ Medial surface dynamics of an in vivo canine vocal fold during phonation,” J. Acoust. Soc. Am. 117(5 ), 3174–3183. 10.1121/1.1871772 [DOI] [PubMed] [Google Scholar]
- Drechsel, J. S. (2007). “ Characterization of synthetic, self-oscillating vocal fold models,” Masters thesis, Brigham Young University, Provo, UT. [Google Scholar]
- Drechsel, J. S., and Thomson, S. L. (2008). “ Influence of supraglottal structures on the glottal jet exiting a two-layer synthetic, self-oscillating vocal fold model,” J. Acoust. Soc. Am. 123(6 ), 4434–4445. 10.1121/1.2897040 [DOI] [PMC free article] [PubMed] [Google Scholar]
- Hirano, M., and Kakita, Y. (1985). “ Cover body theory of vocal fold vibration,” in Speech Science: Physiological Aspects, edited by Daniloff R. (College-Hill, San Diego: ), pp. 1–46. [Google Scholar]
- Kniesburges, D., Thomson, S. L., Barney, A., Triep, M., Sidlof, P., and Horacek, J. (2011). “ In vitro experimental investigation of voice production,” Curr. Bioinf. 6(3 ), 305–322. 10.2174/157489311796904637 [DOI] [PMC free article] [PubMed] [Google Scholar]
- Murray, P. R. (2011). “ Flow induced responses of normal, bowed, and augmented synthetic vocal fold models,” Masters thesis, Brigham Young University, Provo, UT. [Google Scholar]
- Murray, P. R., and Thomson, S. L. (2011). “ Synthetic, multi-layer, self-oscillating vocal fold model fabrication,” J. Vis. Exp. 58, e3498. [DOI] [PMC free article] [PubMed] [Google Scholar]
- Neubauer, J., Zhang, Z., Miraghaio, R., and Berry, D. A. (2007). “ Coherent structures of the near field flow in a self-oscillating physical model of the vocal folds,” J. Acoust. Soc. Am. 121(2 ), 1102–1118. 10.1121/1.2409488 [DOI] [PubMed] [Google Scholar]
- Pickup, B. A., and Thomson, S. L. (2009). “ Influence of asymmetric stiffness on the structural and aerodynamic response of synthetic vocal fold models,” J. Biomech. 42, 2219–2225. 10.1016/j.jbiomech.2009.06.039 [DOI] [PMC free article] [PubMed] [Google Scholar]
- Pickup, B. A., and Thomson, S. L. (2010). “ Flow-induced vibratory response of idealized versus magnetic resonance imaging-based synthetic vocal fold models,” J. Acoust. Soc. Am. 128(3 ), EL124–EL129. 10.1121/1.3455876 [DOI] [PMC free article] [PubMed] [Google Scholar]
- Pickup, B. A., and Thomson, S. L. (2011). “ Identification of geometric parameters influencing the flow-induced vibration of a two-layer self-oscillating computational vocal fold model,” J. Acoust. Soc. Am. 129(4 ), 2121–2132. 10.1121/1.3557046 [DOI] [PMC free article] [PubMed] [Google Scholar]
- Popolo, P. S., and Titze, I. R. (2008). “ Qualification of a quantitative laryngeal imaging system using videostroboscopy and videokymography,” Ann. Otol. Rhinol. Laryngol. 117(6 ), 404–412. [DOI] [PMC free article] [PubMed] [Google Scholar]
- Riede, T., Tokuda, I. T., Munger, J. B., and Thomson, S. L. (2008). “ Mammalian laryngeal air sacs add variability to the vocal tract impedance: Physical and computational modeling,” J. Acoust. Soc. Am. 124(1 ), 634–647. 10.1121/1.2924125 [DOI] [PMC free article] [PubMed] [Google Scholar]
- Ruty, N., Pelorson, X., Van Hirtum, V., Lopez-Arteaga, I., and Hirschberg, A. (2007). “ An in vitro setup to test the relevance and the accuracy of low-order vocal folds models,” J. Acoust. Soc. Am. 121(1 ), 479–490. 10.1121/1.2384846 [DOI] [PubMed] [Google Scholar]
- Scherer, R., Shinwari, D., De Witt, K., Zhang, C., Kucinschi, B., and Afjeh, A. (2001). “ Intraglottal pressure profiles for a symmetric and oblique glottis with a divergence angle of 10 degrees,” J. Acoust. Soc. Am. 109, 1616–1630. 10.1121/1.1333420 [DOI] [PubMed] [Google Scholar]
- Shaw, H., and Deliyski, D. (2008). “ Mucosal wave: A normophonic study across visualization techniques,” J. Voice 22, 23–33. 10.1016/j.jvoice.2006.08.006 [DOI] [PubMed] [Google Scholar]
- Shaw, S. M., Thomson, S. L., Dromey, C., and Smith, S. (2012). “ Frequency response of synthetic vocal fold models with linear and nonlinear material properties.” J. Speech Lang. Hear. Res. 55(5 ), 1395–1406. 10.1044/1092-4388(2012/11-0153) [DOI] [PMC free article] [PubMed] [Google Scholar]
- Sidlof, P., Svec, J. G., Horecek, J., Vesely, J., Klepacek, I., and Havlik, R. (2008). “ Geometry of human vocal folds and glottal channel for mathematical and biomechanical modeling of voice production,” J. Biomech. 41, 985–995. 10.1016/j.jbiomech.2007.12.016 [DOI] [PubMed] [Google Scholar]
- Spencer, M., Siegmund, T., and Mongeau, L. (2008). “ Determination of superior surface strains and stresses, and vocal fold contact pressure in a synthetic larynx model using digital image correlation,” J. Acoust. Soc. Am. 123(2 ), 1089–1103. 10.1121/1.2821412 [DOI] [PubMed] [Google Scholar]
- Svec, J. G., Sram, F., and Schutte, H. K. (2007). “ Videokymography in voice disorders; what to look for?” Ann. Otol. Rhinol. Laryngol. 116(3 ), 172–180. [DOI] [PubMed] [Google Scholar]
- Thomson, S. L., Mongeau, L., and Frankel, S. H. (2005). “ Aerodynamic transfer of energy to the vocal folds,” J. Acoust. Soc. Am. 118, 1689–1700. 10.1121/1.2000787 [DOI] [PubMed] [Google Scholar]
- Titze, I. R. (1988). “ The physics of small-amplitude oscillation of the vocal folds,” J. Acoust. Soc. Am. 83, 1536–1552. 10.1121/1.395910 [DOI] [PubMed] [Google Scholar]
- Titze, I. R. (2000). Principles of Voice Production, 2nd ed. (National Center for Voice and Speech, Iowa City, IA: ), pp. 15–19; 205–207. [Google Scholar]
- Titze, I. R. (2006). The Myoelastic Aerodynamic Theory of Phonation (National Center for Voice and Speech, Iowa City, IA: ), pp. 84–99. [Google Scholar]
- Titze, I. R., Jiang, J. J., and Hsiao, T.-Y. (1993). “ Measurement of mucosal wave propagation and vertical phase difference in vocal fold vibration,” Ann. Otol. Rhinol. Laryngol. 102, 58–63. [DOI] [PubMed] [Google Scholar]
- Titze, I. R., Schmidt, S. S., and Titze, M. R. (1995). “ Phonation threshold pressure in a physical model of the vocal fold mucosa,” J. Acoust. Soc. Am. 97(5 ), 3080–3084. 10.1121/1.411870 [DOI] [PubMed] [Google Scholar]
- van den Berg, J. W., and Tan, T. S. (1959). “ Results of experiments with human larynges,” Pract. Otorhinolaryngol. (Basel) 21, 425–450. [DOI] [PubMed] [Google Scholar]
- Voigt, D., Doellinger, M., Eysholdt, U., Yang, A., Guerlek, E., and Lohscheller, J. (2010). “ Objective detection and quantification of mucosal wave propagation,” J. Acoust. Soc. Am. 128(5 ), EL347–EL353. 10.1121/1.3493637 [DOI] [PubMed] [Google Scholar]
- Zhang, Z., Neubauer, J., and Berry, D. A. (2006a). “ Aerodynamically and acoustically driven modes of vibration in a physical model of the vocal folds,” J. Acoust. Soc. Am. 120(5 ), 2841–2849. 10.1121/1.2354025 [DOI] [PubMed] [Google Scholar]
- Zhang, Z., Neubauer, J., and Berry, D. A. (2006b). “ The influence of subglottal acoustics on laboratory models of phonation,” J. Acoust. Soc. Am. 120(3 ), 1558–1569. 10.1121/1.2225682 [DOI] [PubMed] [Google Scholar]
- Zhang, Z., Neubauer, J., and Berry, D. A. (2009). “ Influence of vocal fold stiffness and acoustic loading on flow-induced vibration of a single-layer vocal fold model,” J. Sound Vib. 322, 299–313. 10.1016/j.jsv.2008.11.009 [DOI] [PMC free article] [PubMed] [Google Scholar]