Abstract
Background
Considerable evidence suggests that the time of day at which calories are consumed markedly impacts body weight gain and adiposity. However, a precise quantification of energy balance parameters during controlled animal studies enforcing time-of-day-restricted feeding is currently lacking in the absence of direct human interaction.
Objective
The purpose of the present study was therefore to quantify the effects of restricted feeding during the light (sleep) phase in a fully-automated, computer-controlled comprehensive laboratory animal monitoring system (CLAMS) designed to modulate food access in a time-of-day-dependent manner. Energy balance, gene expression (within metabolically-relevant tissues), humoral factors, and body weight were assessed.
Results
We report that relative to mice fed only during the dark (active) phase, light (sleep) phase fed mice: 1) consume a large meal upon initiation of food availability; 2) consume greater total calories per day; 3) exhibit a higher RER (indicative of decreased reliance on lipid/fatty acid oxidation); 4) exhibit tissue-specific alterations in the phases and amplitudes of circadian clock and metabolic genes in metabolically active tissues (greatest phase differences observed in the liver, and diminution of amplitudes in epididymal fat, gastrocnemius muscle, and heart); 5) exhibit diminished amplitude in humoral factor diurnal variations (e.g., corticosterone); and 6) exhibit greater weight gain within 9 days of restricted feeding.
Conclusions
Collectively, these data suggest that weight gain following light (sleep) phase restricted feeding is associated with significant alterations in energy balance, as well as dyssynchrony between metabolically active organs.
Keywords: Body Weight, Chronobiology, Energy Balance, Gene Expression, Metabolism
INTRODUCTION
A large body of both epidemiological and experimental data supports the concept that the time of day at which an organism consumes food has marked influences on metabolic homeostasis at multiple levels.(1) For example, individuals who do not habitually eat breakfast tend to weigh more than individuals who do routinely eat this meal; this appears to be due, at least in part, to consumption of more calories later in the day.(2) Shift workers, who often consume meals during the night, have an increased risk of the development of various metabolic diseases, including obesity, diabetes, and cardiovascular disease.(3–5) Similarly, individuals suffering from night eating syndrome develop morbid obesity.(6) Collectively, these observations suggest that consumption of dietary calories later in the day and/or during the night is associated with weight gain and adiposity. Consistent with this hypothesis, recent studies in mice report that restricting food access to only the normal sleep (light) phase is associated with accelerated weight gain (within 1 week).(7) Similarly, we have shown that consumption of a high fat meal at the end of the active period results in cardiometabolic syndrome development in mice, including weight gain, adiposity, glucose intolerance, and dyslipidemia, relative to mice that consume the same high fat meal at the beginning of the active period.(8)
Understanding the mechanisms by which time-of-day-dependent feeding influences metabolic homeostasis will likely provide important insight into the pathogenesis of cardiometabolic diseases associated with shift work and other phenomena of circadian disruption. A number of recently published studies have investigated the effects of restricted feeding regimes on distinct parameters, including the transcriptome. Vollmers et al have reported that sleep/light phase restricted feeding in mice phase shifts diurnal rhythms in the expression of multiple metabolic genes in the liver (relative to dark/active phase restricted fed mice).(9) Similarly, several laboratories have reported that restricted feeding regimes markedly influence the phase of circadian clock gene oscillations in distinct metabolically active tissues, such as the liver.(10, 11) Circadian clocks are transcriptionally-based cell autonomous molecular mechanisms that confer the selective advantage of anticipation.(12, 13) The significance of these seemingly independent observations is highlighted by the fact that circadian clocks modulate metabolism in a time-of-day-dependent manner, such that genetic manipulation of this molecular mechanism has profound effects on energy balance.(14, 15) These findings have led to suggestions that alterations in circadian clocks within metabolically active peripheral tissues following restricted feeding contributes towards altered energy homeostasis.
The purpose of the present study was to quantify the effects of light (sleep) phase restricted feeding in mice, in the absence of a direct human interaction, on body weight gain as well as diurnal variations in energy balance, gene expression (within metabolically-relevant tissues), and humoral factors. To achieve our goal, a fully-automated, computer-controlled CLAMS was utilized to modulate food access in a time-of-day-dependent manner. We report that relative to dark (active) phase fed mice, light (sleep) phase fed mice: 1) consume a large meal upon initiation of food availability; 2) consume greater total calories per day; 3) exhibit a higher RER (indicative of decreased reliance on lipid/fatty acid oxidation); 4) exhibit tissue-specific alterations in the phases and amplitudes of circadian clock and metabolic genes in metabolically active tissues (greatest phase differences observed in the liver, and diminution of amplitudes in epididymal fat, gastrocnemius muscle, and heart); 5) exhibit diminished amplitude in humoral factor diurnal variations (e.g., corticosterone); and 6) exhibit greater weight gain within 9 days of restricted feeding. Collectively, these data suggest that weight gain following light (sleep) phase restricted feeding is associated with significant alterations in energy balance, as well as dyssynchrony (defined as a differential effect of restricted feeding on time-of-day-dependent rhythms in the parameters measured) between metabolically active organs.
MATERIALS AND METHODS
Animals
Twenty-week old male wild-type mice (on FVB/N background) were housed at the Center for Comparative Medicine at the University of Alabama at Birmingham under controlled conditions (28 ± 1°C and 12-h:12-h LD cycle enforced by environmental chambers) within a Comprehensive Laboratory Animal Monitoring System (CLAMS; Columbus Instruments Inc., Columbus, OH). All mice were housed singly, and allowed to acclimatize to the CLAMS for 9 days prior to initiation of the experimental protocol; during acclimatization, mice received standard rodent chow ad libitum. Throughout all studies, water was provided in an ad libitum fashion. The chow provided in all studies was Harlan NIH-31 Irradiated Open formula Mouse/Rat Diet (4.7% fat).
Non-invasive Mouse Monitoring and Restricted Feeding Enforcement
Continuous 24-hour monitoring of behavioral and physiological parameters was performed using the CLAMS. Twenty-four-hour patterns of energy expenditure (indirect calorimetry), physical activity (beam breaks), and food intake were measured. During periods of restricted feeding, food access was enforced in an automated fashion by the CLAMS.
Experimental Design
Following acclimatization, baseline CLAMS measures were performed in 44 mice during ad libitum feeding; baseline was considered the last two days prior to restricted feeding enforcement. Following baseline measures, mice were randomly divided into one of two groups: light phase (LP, food access initiated at ZT0 and terminated at ZT12; 23 mice) and dark phase (DP, food access initiated at ZT12 and terminated at ZT24; 21 mice) restricted feeding. Groups of mice were euthanized at ZT0, ZT6, ZT12, and ZT18 on the ninth day of restricted feeding, at which time blood, liver, epididymal fat, gastrocnemius muscle, and heart were isolated. Body weights were recorded at the initiation of the baseline period and at the end of the restricted feeding; mice were not disturbed (i.e., did not receive direct human contact) between these two experimental points.
RNA Isolation and Real-Time RT-PCR
RNA was extracted from liver, epididymal fat, gastrocnemius muscle, and heart using standard procedures. Expression of candidate clock and metabolic genes were measured by quantitative RT-PCR; primer and probe sequences have been reported previously (16–21), with the exceptions of accα (5’-GGCCAGTGATATGCTGAGAT-3’ [forward], 5’-AGGGTCAAGTGCTGCTCCA-3’ [reverse], 5’-FAM-AATCTGGCTGCATCCATTATGTCAAACG-TAMRA-3’ [probe]), lpk (5’-CGACGGGCTCATCTCCTTAG-3’ [forward], 5’-CACCGTGCTCCACTTCTGTC-3’ [reverse], 5’-FAM-CAGTCCCTCTGGGCCGATTTTCTGTA-TAMRA-3’ [probe]), glut2, (5’-AGCAACTGGGTCTGCAATTTT-3’ [forward], 5’-CAAGAACACGTAAGGCCCAAG-3’ [reverse], 5’-FAM-AAGTCCGCAATGTACTGGAAG-TAMRA-3’ [probe]), and lgs (5’-TGTAAATGATGCTGTCAGAAGAGC-3’ [forward], 5’-TCAAAAAGTACCACATAAGGACTTCC-3’ [reverse], 5’-FAM-TCCAAAATGCACCTGGCAGCCAT-TAMRA-3’ [probe]). Standard RNA was made by the T7 polymerase method (Ambion, Austin, TX), using total RNA isolated from mouse hearts; the use of standard RNA allows absolute quantification of gene expression. Quantitative RT-PCR data are represented as mRNA molecules per ng total RNA.
Humoral Factor Measurements
Plasma was isolated from mice at the time of euthanasia. Plasma glucose, triglyceride, and corticosterone concentrations were measured using commercially available kits (Stanbio, Boerne, TX; Millipore, St. Charles, MO; MP Biomedicals, LLC, Orangeburg, NY).
Statistical analysis
Statistical analysis was performed using two-way or repeated-measure ANOVA. Stata version IC10.0 (Stata Corp., San Antonio, TX) was used to perform two-way ANOVA to investigate the main effects of diet and time. Repeated-measure ANOVA was used to determine the effects of different diets over time. A full model including second-order interactions was conducted for each experiment. Significant differences were determined using Type III sums of squares. The null hypothesis of no model effects was rejected at p < 0.05. Bonferroni post hoc analyses were performed for pair-wise comparisons.
Rhythmic parameter comparisons (phase and amplitude) of gene expression data were calculated using cosinor analysis. Stata version IC10.0 was used with the following equation where the initial values and default parameter ranges were set manually:
f(t) = Mesor + A * Cos[(2 πt/T)+ Acrophase].
where
Mesor (acronym for midline estimating statistic of rhythm) = the mean of the oscillation
A = the amplitude (peak-to-trough difference)
T = the period (24 h)
Acrophase = the timing of the cosine maximum
t = a timepoint.
R2 is the resulting statistic that measures the percent variance accounted for by the 24 h approximating waveform. The cosinor analyses were performed based on the assumption that the free-running period is fixed at 24 h. Individual cosinor parameters (mesor, amplitude, and acrophase) for each group were compared for each gene byt tests with significance ascribed at p < 0.05.
RESULTS
Restricted Feeding Leads to Rapid Changes in Whole Body Energy Balance
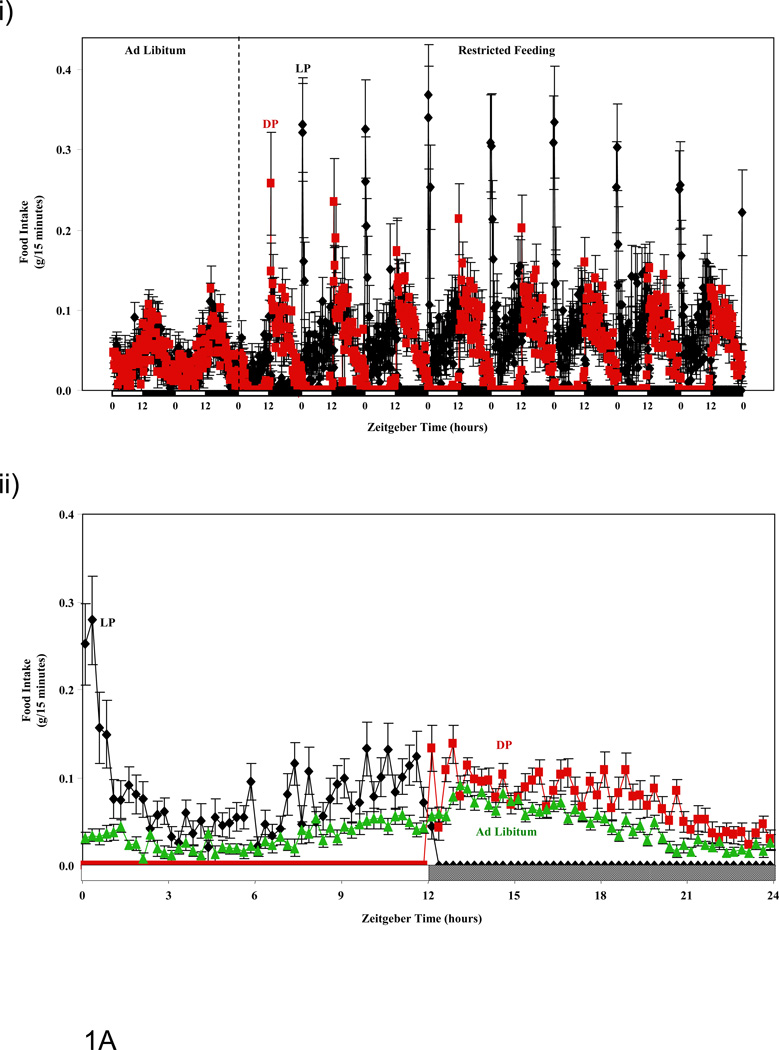
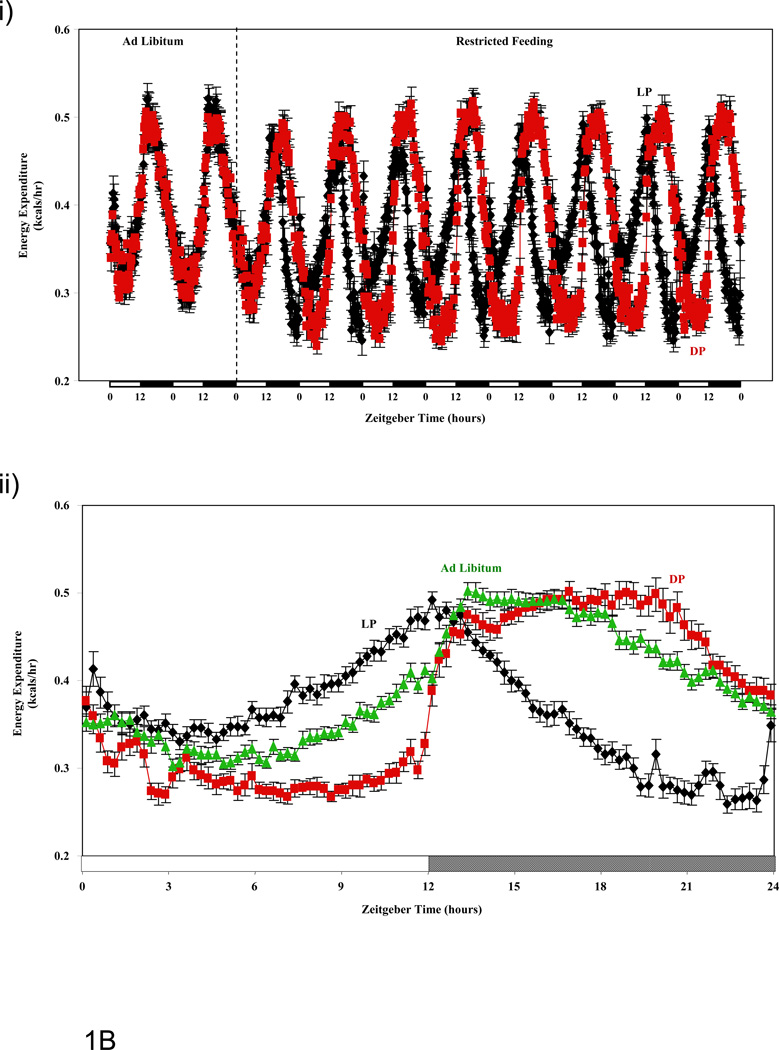
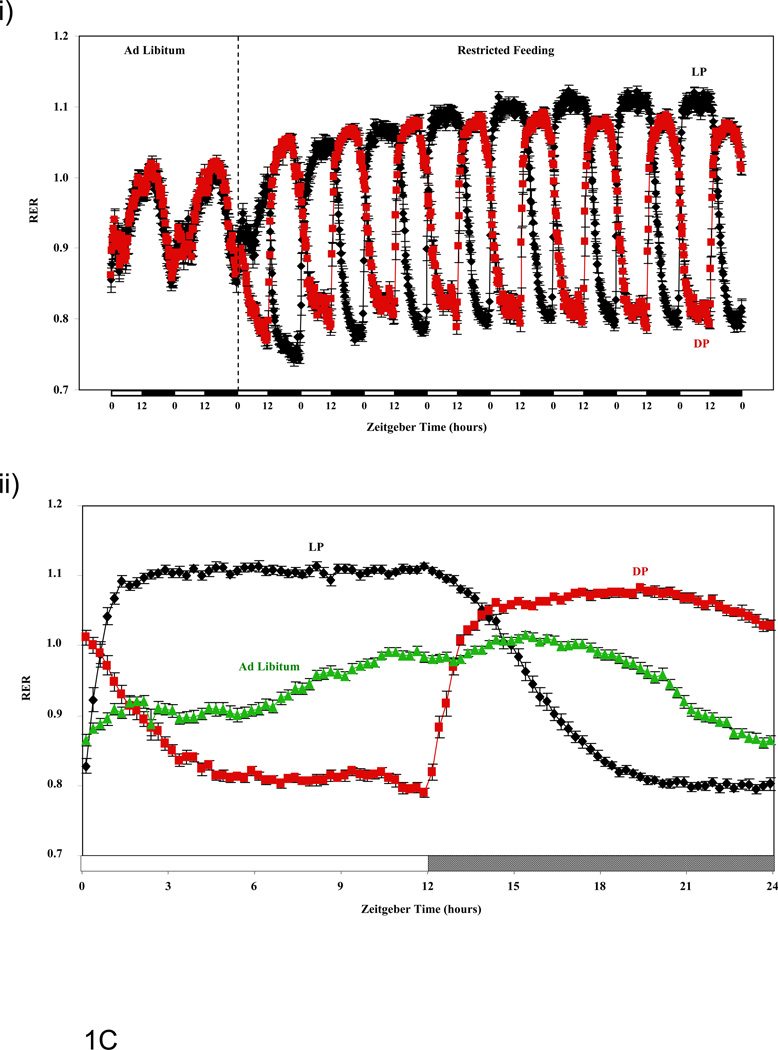
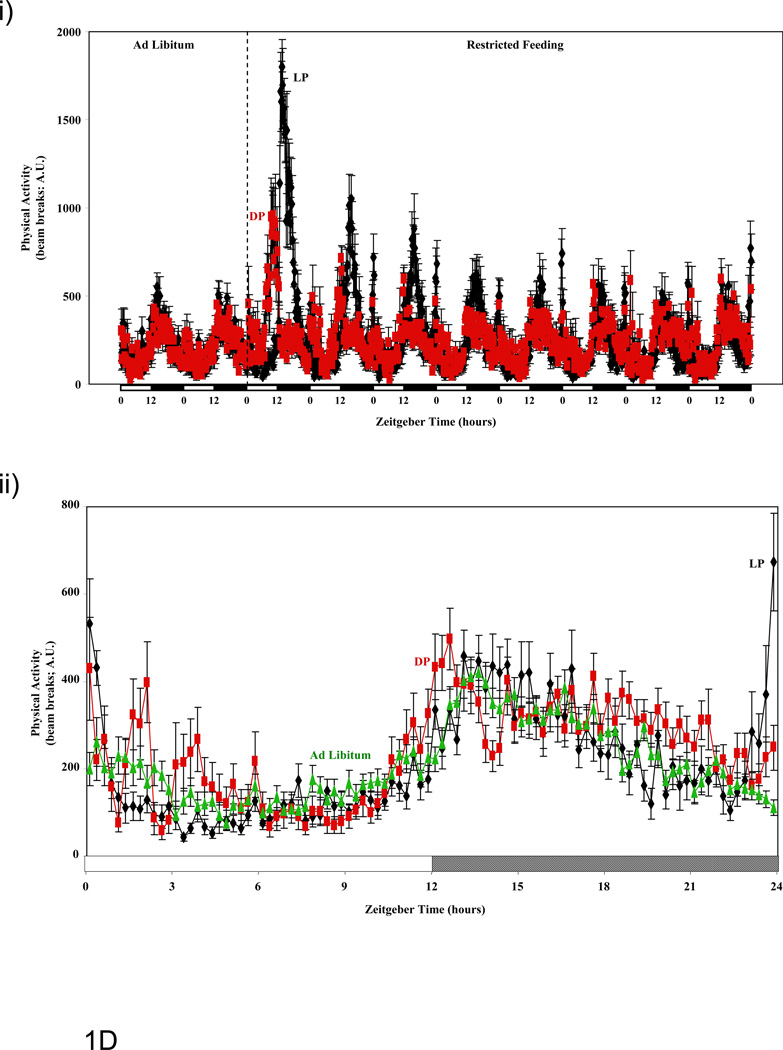
A computer operated, fully automated CLAMS was utilized for a series of experiments designed to investigate the effects of restricted feeding in the absence of a direct human intervention. As anticipated, food intake, physical activity, energy expenditure, and RER all exhibited diurnal variations in ad libitium fed mice, peaking during the dark phase (Figure 1). Within 24-hours of restricted feeding enforcement, the patterns of all measured parameters were significantly altered, independent of the period during which food was restricted (Figure 1). A steady state was reached within 7 days for all measured parameters of energy balance. As such, baseline data (average of days 1 and 2 during ad libitum feeding) were compared to steady state data for restricted feeding groups (average of days 9 and 10; Figure 1). In all cases, ad libitum feeding exhibited distinct 24-hour patterns in energy balance parameters, compared with the restricted feeding groups (Figure 1 and Table 1), as described below.
Figure 1.
Influence of restricted feeding on diurnal variations in food intake (A), energy expenditure (B), RER (C), and activity (D). Mice were fed standard laboratory chow in an ad libitum (Ad Lib; n=44) fashion, followed by random assignment to dark phase (DP; n=21) or light phase (LP; n=23) restricted feeding groups. All parameters were monitored continuously using a CLAMS; restricted feeding was enforced in an automated manner by the CLAMS. Data are reported as mean ± SEM, at 15 minute intervals, for the entire experimental time course (i) or at steady state (i.e., average of last 2 days; ii). Food intake, energy expenditure, and activity units are grams/15 minutes, kcals/hour, and beam breaks/15 minutes, respectively. Main effects for time and/or feeding regime are reported in the top left hand corner of the figure panels.
Table 1.
Influence of restricted feeding on the phase and amplitude of diurnal variations in energy balance parameters. Mice were fed standard laboratory chow in an ad libitum (Ad Lib; n=44) fashion, followed by random assignment to dark phase (DP; n=21) or light phase (LP; n=23) restricted feeding groups. All parameters were monitored continuously using a CLAMS; restricted feeding was enforced in an automated manner by a CLAMS. Data are reported as mean ± SEM. Phase is the zeitgeber time (ZT; in hours) at which the peak value in the oscillation occurs. Food intake, energy expenditure, and activity units for amplitude (i.e., peak-to-trough difference) are g, kcals/hr, and number of beam breaks, respectively.
| Phase | Amplitude | |||||
|---|---|---|---|---|---|---|
| Ad Lib | DP | LP | Ad Lib | DP | LP | |
| Food Intake | 13.9 ± 0.1 | 16.7 ± 0.1* | 5.9 ± 0.1*$ | 0.04 ± 0.01 | 0.10 ± 0.01* | 0.06 ± 0.02 |
| Energy Expenditure | 15.7 ± 0.1 | 17.3 ± 0.1* | 10.7 ± 0.2*$ | 0.18 ± 0.01 | 0.22 ± 0.02 | 0.17 ± 0.01$ |
| RER | 13.6 ± 0.2 | 18.4 ± 0.2* | 8.1 ± 0.1*$ | 0.08 ± 0.01 | 0.25 ± 0.01* | 0.31 ± 0.01*$ |
| Activity | 15.4 ± 0.2 | 16.6 ± 0.2* | 16.1 ± 0.3* | 253 ± 59 | 634 ± 313 | 410 ± 95 |
p<0.05 compared to Ad Lib fed conditions (paired t-test);
p<0.05 for DP versus LP fed mice (unpaired t-test).
Food Intake
Consistent with the CLAMS-enforced feeding regimes, 24-hour patterns in food intake were markedly distinct between ad libitum, LP, and DP fed mice (Figure 1A and Table 1). Similar to previously published studies, ad libitum fed mice consume a greater quantity of food during the dark phase versus the light phase; 60% and 40% of total daily food intake, respectively. For LP fed mice, a burst of food intake was observed immediately following food availability (i.e., ZT0-ZT1), after which the rate of food consumption decreased to values comparable to ad libitum fed mice (i.e., by approximately ZT3) (Figure 1Aii). After ZT4.5, the rate of food intake increased gradually in LP fed mice, until food access was restricted at ZT12. In contrast, DP fed mice did not exhibit a dramatic increase in food intake when presented with food at ZT12 (in comparison to LP fed mice presented with food at ZT0), despite having no access to food for twelve hours prior to the dark phase. The pattern of food intake for DP fed mice was comparable to ad libitum fed mice during the dark phase, with the notable exception of a higher amplitude (Figure 1 and Table 1). When compared to ad libitum fed mice, no significant differences in total daily caloric intake were observed for either of the restricted feeding groups (Table 2). In contrast, mice subjected to the LP feeding regime consumed significantly more total daily calories (approximately 10%) compared to DP fed mice (Table 2).
Table 2.
Influence of restricted feeding on multiple energy balance parameters. Mice were fed standard laboratory chow in an ad libitum (Ad Lib; n=44) fashion, followed by random assignment to dark phase (DP; n=21) or light phase (LP; n=23) restricted feeding groups. All parameters were monitored continuously using a CLAMS; restricted feeding was enforced in an automated manner by a CLAMS. Data for food intake (g) and activity (beam breaks) are totals (i.e., the sum during a distinct time period), while data for energy expenditure (kcals/hr) and RER are averages (i.e., the average during a distinct time period). Data are reported as mean ± SEM.
| 12h Light Period Total/Average | 12h Dark Period Total/Average | 24h Daily Total/Average | |||||||
|---|---|---|---|---|---|---|---|---|---|
| Ad Lib | LP | DP | Ad Lib | LP | DP | Ad Lib | LP | DP | |
| Food Intake | 1.53 ± 0.05 | 3.97 ± 0.08* | 0.00 ± 0.00*$ | 2.30 ± 0.05 | 0.00 ± 0.00* | 3.60 ± 0.07*$ | 3.83 ± 0.08 | 3.97 ± 0.08 | 3.60 ± 0.07$ |
| Energy Expenditure | 0.34 ± 0.01 | 0.38 ± 0.01* | 0.29 ± 0.01*$ | 0.45 ± 0.01 | 0.35 ± 0.01* | 0.46 ± 0.01$ | 0.39 ± 0.01 | 0.36 ± 0.01* | 0.38 ± 0.01 |
| RER | 0.93 ± 0.01 | 1.09 ± 0.01* | 0.84 ± 0.01*$ | 0.96 ± 0.00 | 0.90 ± 0.01* | 1.05 ± 0.00*$ | 0.95 ± 0.00 | 0.99 ± 0.00* | 0.94 ± 0.00$ |
| Activity | 7638 ± 500 | 6337 ± 586 | 8068 ± 822 | 12811 ± 764 | 13748 ± 938 | 14805 ± 997 | 20449 ± 1178 | 20084 ± 1352 | 22874 ± 1717 |
p<0.05 compared to Ad Lib fed conditions (paired t-test);
p<0.05 for DP versus LP fed mice (unpaired t-test).
Energy Expenditure
The three feeding groups investigated exhibited significant differences in 24-hours rhythms for energy expenditure (Figure 1B and Table 1). At steady state, ad libitum and DP fed mice exhibited similar phase (only a 1.6 hour phase delay in DP mice) and amplitude (trough-to-peak difference) values in energy expenditure oscillations. In contrast, LP fed mice exhibited a phase advance (approximately 5 hours) in the 24-hour rhythm of this parameter. Average daily energy expenditure was significantly lower in LP versus ad libitum fed mice, while this parameter was not significantly different in DP fed mice compared to the other two feeding groups (Table 2).
Respiratory Exchange Ratio (RER)
RER is utilized to estimate the relative reliance on an organism for carbohydrate versus fatty acid metabolism, as well as aerobic versus anaerobic metabolism; a value of 0.7 represents almost complete reliance on fatty acid metabolism, of 1.0 represents reliance on aerobic carbohydrate metabolism, and of >1.0 represents reliance on anaerobic carbohydrate metabolism. Figure 1Ci shows that during the first few days of restricted feeding, food withdrawal was associated with a rapid decline in RER in both LP and DP fed mice, which approached a value of 0.75 (i.e., reliance on stored fatty acids as a fuel during fasting). However, as the restricted feeding regimes were continued, RER values steadily increased in both restricted feeding groups, such that the trough value during the food withdrawal period at steady state was approximately 0.8 (Figure 1Cii). The peak RER values also steadily increased during the restricted feeding regime, and approached a value of 1.1 at steady state (Figure 1C). At steady state, these rhythms were essentially anti-phase between LP and DP fed groups (i.e., 10.3 hour phase shift; Figure 1C and Table 1). Average daily RER was significantly higher in LP fed mice, compared to both ad libitum and DP fed mice (Table 2). Average daily RER was not significantly different in DP fed mice relative to ad libitum fed mice (Table 2).
Physical Activity
Steady state diurnal rhythms in physical activity between ad libitum, LP, and DP fed mice are compared in Figure 1D and Table 1. In general terms, physical activity rhythms were minimally influenced by restricted feeding (relative to the effects of restricted feeding on other energy balance parameters). Consistent with previous reports, mice exhibit increased physical activity immediately prior to food availability/presentation (i.e., food anticipatory response) in both LP and DP fed mice (Figure 1D).(22) No significant differences were observed for total daily physical activity between the three feeding groups investigated (Table 2).
Restricted Feeding has Tissue-Specific Transcriptional Effects
Figure 1 and Table 1 reveal that restricted feeding induces a dyssynchrony between several parameters of energy balance (e.g., a 10.8 hour phase differences in food intake for DP versus LP fed mice resulted in a 10.3 hour phase difference in RER [i.e., synchrony] but only a 6.6 hour phase difference in energy expenditure [i.e., dyssynchrony]). In an attempt to elucidate the mechanisms potentially contributing towards these observations, we initially investigated expression of genes encoding for both key circadian clock components and metabolic enzymes (through quantitative RT-PCR).
Clock Gene Expression
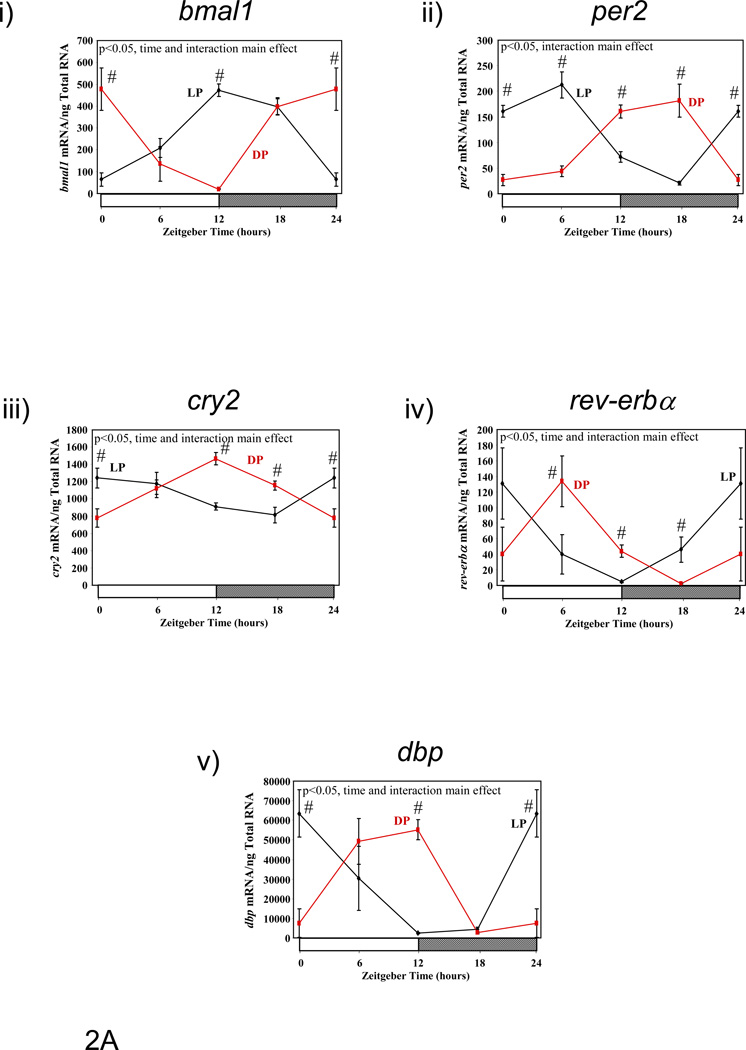
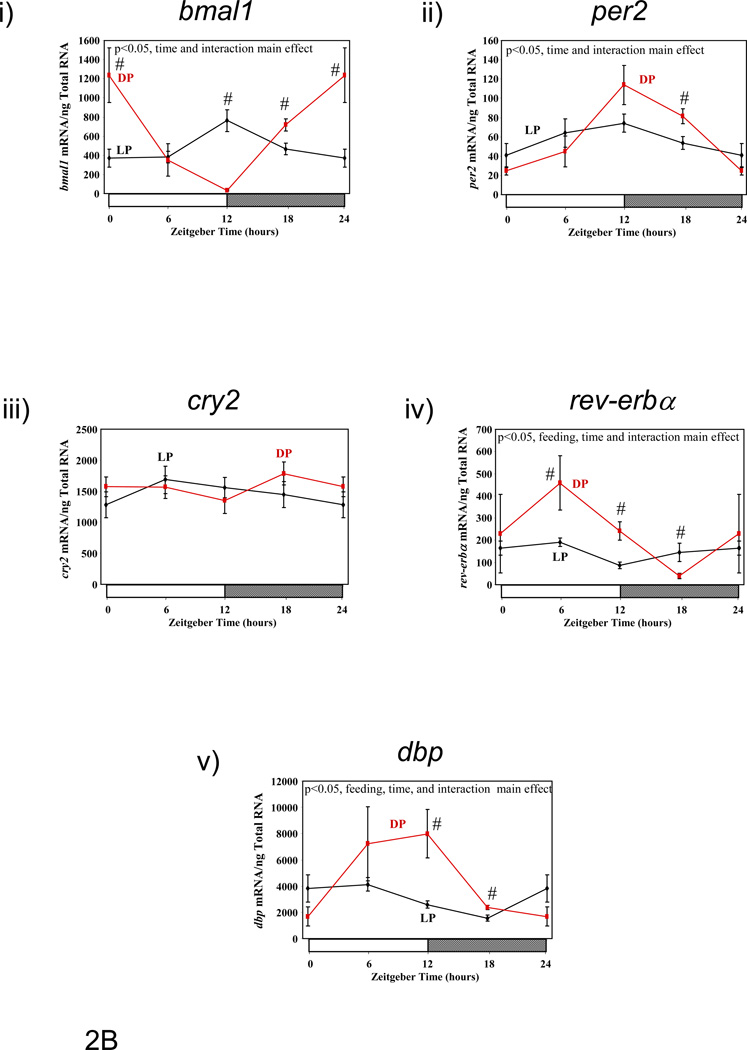
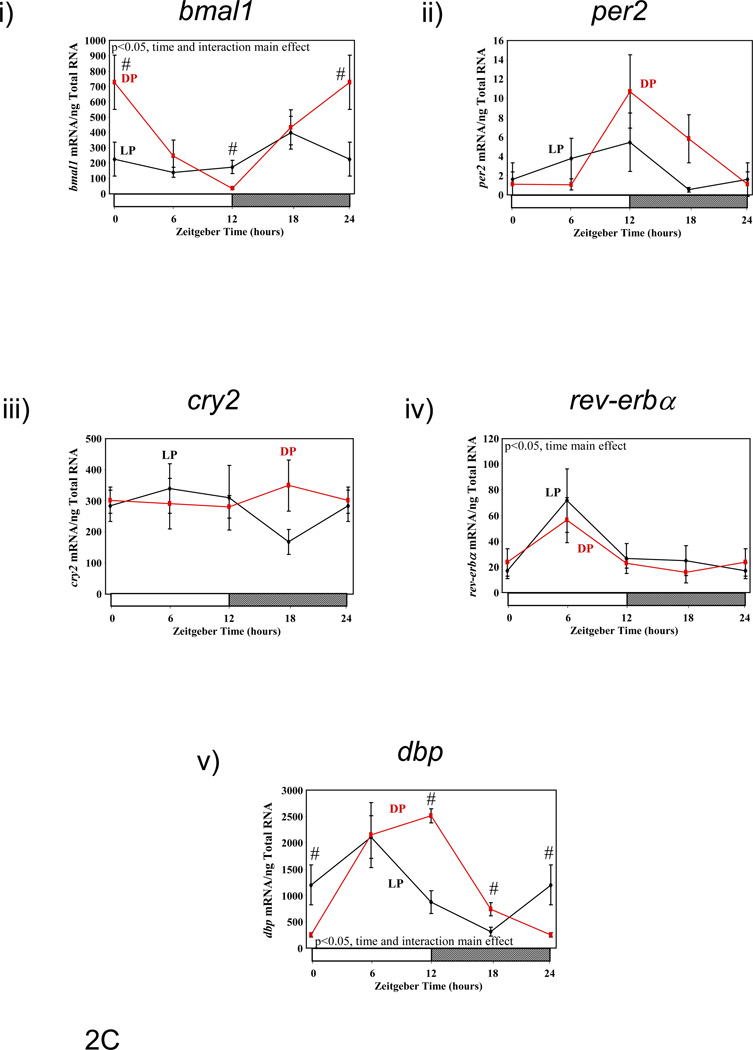
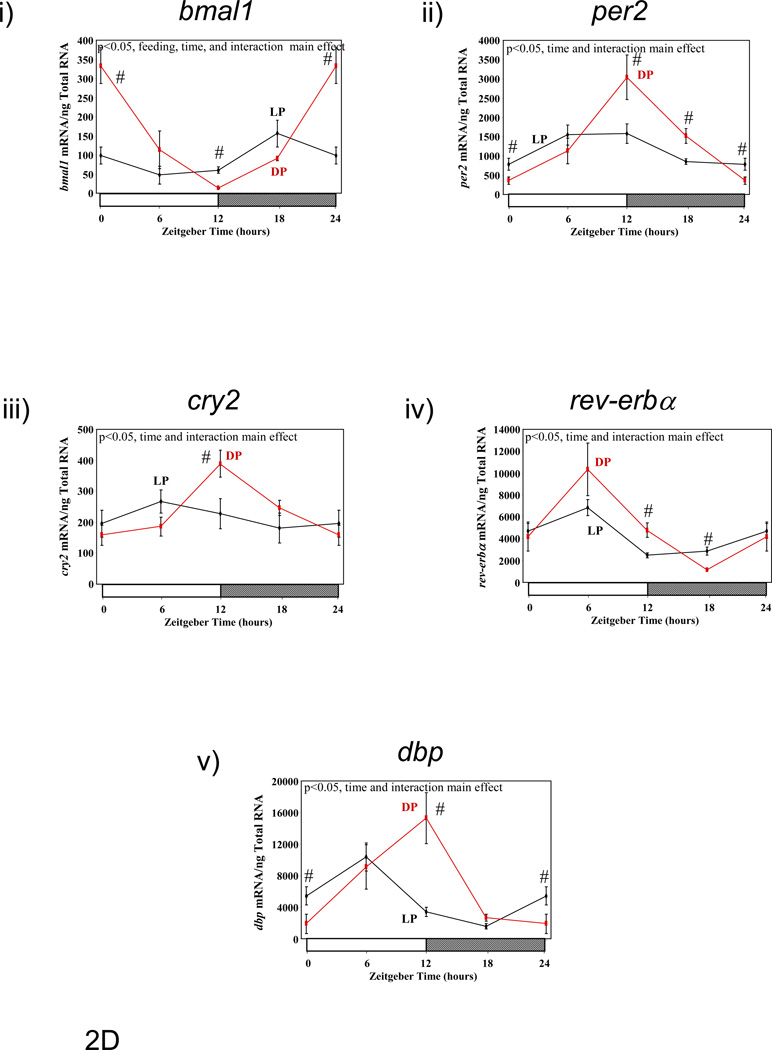
Previous studies have suggested that restricting food availability to the light/sleep phase results in 12-hour phase shifts in circadian clock gene expression in rodent peripheral tissues.(10) Therefore, we investigated the effect of enforcement of restricted feeding regimes, through use of a CLAMS, on clock gene expression in metabolically active tissues. Figure 2 shows diurnal variations in gene expression of circadian clock components (bmal1 [brain and muscle ARNT-like 1], per2 [period 2], cry2 [cryptochrome 2], and rev-erbα [nuclear receptor subfamily 1, group D, member 1]), as well as the clock-controlled gene dbp (D site binding protein), in liver, epididymal fat, gastrocnemius muscle, and heart isolated from LP and DP fed mice. Consistent with previous reports, dramatic phase shifts in the gene expression of clock components and output genes are observed in the livers of LP versus DP fed mice (Figure 2A and Table 3). Phase differences between LP and DP fed mouse livers for these genes were within the range of 6 and 11 hours (average of 8.38 ± 0.84 hours); in contrast, no significant effects on amplitude were observed. Unlike the liver, restricted feeding had markedly lower and less consistent effects on the phases of clock component and output gene oscillations in epididymal fat, gastrocnemius muscle, and heart (Figures 2B–D, respectively, and Table 3). Average phase shifts for the clock genes investigated were 6.88 ± 2.06, 3.46 ± 1.41, and 3.90 ± 0.83 hours, for epididymal fat, gastrocnemius muscle, and heart respectively (Table 3). Average phase shifts in clock gene oscillations were significantly less in gastrocnemius muscle and heart compared to the liver (p<0.05). Furthermore, the amplitude of gene expression oscillations were often significantly dampened in these metabolically active, extra-hepatic peripheral tissues; average repression of amplitude was 69 ± 3%, 24 ± 20%, and 54 ± 5% for epididymal fat, gastrocnemius muscle, and heart, respectively (Table 3; this value was 8 ± 7% in the liver). As such, average repression in clock gene oscillations was significantly greater in epididymal fat and heart versus liver (p<0.05). Collectively, these data show that restricted feeding has tissue-specific effects on peripheral circadian clocks.
Figure 2.
Influence of restricted feeding on diurnal variations in circadian clock gene expression in liver (A), epididymal fat (B), gastrocnemius muscle (C), and heart (D). Mice were randomly assigned to dark phase (DP; n=21) or light phase (LP; n=23) restricted feeding groups. On the 9th day of restricted feeding, mice were euthanized at ZT0, ZT6, ZT12, or ZT18. Data are reported as mean ± SEM for between 4 and 6 independent observations. Data at ZT0 are plotted a second time at ZT24. Main effects for time and/or feeding regime are reported in the top left hand corner of the figure panels. #, p<0.05 for DP versus LP fed mice (post hoc pair-wise comparisons).
Table 3.
Influence of restricted feeding on the phase and amplitude of diurnal variations in expression of circadian clock genes within metabolically active peripheral tissues. Mice were randomly assigned to dark phase (DP; n=21) or light phase (LP; n=23) restricted feeding groups. Data are reported as mean ± SEM. Phase is the zeitgeber time (ZT; in hours) at which the peak value in the oscillation occurs. Amplitude (i.e., peak-to-trough difference) units are mRNA molecules per ng total RNA. NS signifies not significant.
| Parameter | Tissue | Feeding Group | Gene | ||||
|---|---|---|---|---|---|---|---|
| bmal1 | per2 | cry2 | rev-erbα | dbp | |||
| Phase | Liver | LP | 13.66±0.39 | 4.33±0.34 | 3.18±0.98 | 23.80±1.07 | 1.53±0.78 |
| DP | 22.02±0.55$ | 15.08±0.50$ | 12.2±0.57$ | 6.03±0.88$ | 9.05±0.53$ | ||
| Epididymal Fat | LP | 12.80±1.12 | 10.82±1.54 | NS | 2.05±1.63 | 4.27±1.03 | |
| DP | 22.85±0.58$ | 13.48±0.70 | NS | 6.10±1.17 | 9.49±1.08$ | ||
| Gastrocnemius Muscle | LP | 18.18±1.5 | NS | NS | 6.98±1.65 | 5.28±0.78 | |
| DP | 22.78±0.89$ | 13.87±1.52 | NS | 5.82±1.63 | 9.89±0.62$ | ||
| Heart | LP | 19.29±1.02 | 9.25±0.90 | NS | 4.02±0.66 | 5.14±0.62 | |
| DP | 0.26±0.55$ | 12.54±0.64$ | 12.94±0.70 | 6.18±0.77$ | 10.31±0.75$ | ||
| Amplitude | Liver | LP | 449.76±46.58 | 211.38±19.02 | 494±126.88 | 126.1±35.34 | 66354±13698 |
| DP | 528.26±78.34 | 191.34±25.14 | 687.54±107.52 | 131.96±29.2 | 67042±9340 | ||
| Epididymal Fat | LP | 399.06±116.96 | 34.8±14.12 | NS | 90.2±38.64 | 2860±774 | |
| DP | 1248.78±198.84$ | 96.94±18.4$ | NS | 419.54±123.7$ | 7964±2286$ | ||
| Gastrocnemius Muscle | LP | 258.3±101.82 | NS | NS | 48.24±20.94 | 1827.94±361.76 | |
| DP | 602.06±146.56 | 10.96±5.18 | NS | 40.54±14.66 | 2690.96±460.04 | ||
| Heart | LP | 115.78±31.16 | 1045.28±249.08 | NS | 4544±748 | 9026±1480 | |
| DP | 314.86±47.88$ | 2743.8±487.54$ | 243.46±47.04 | 9200±1788$ | 15100±3090 | ||
p<0.05 for DP versus LP fed mice.
Metabolic Gene Expression
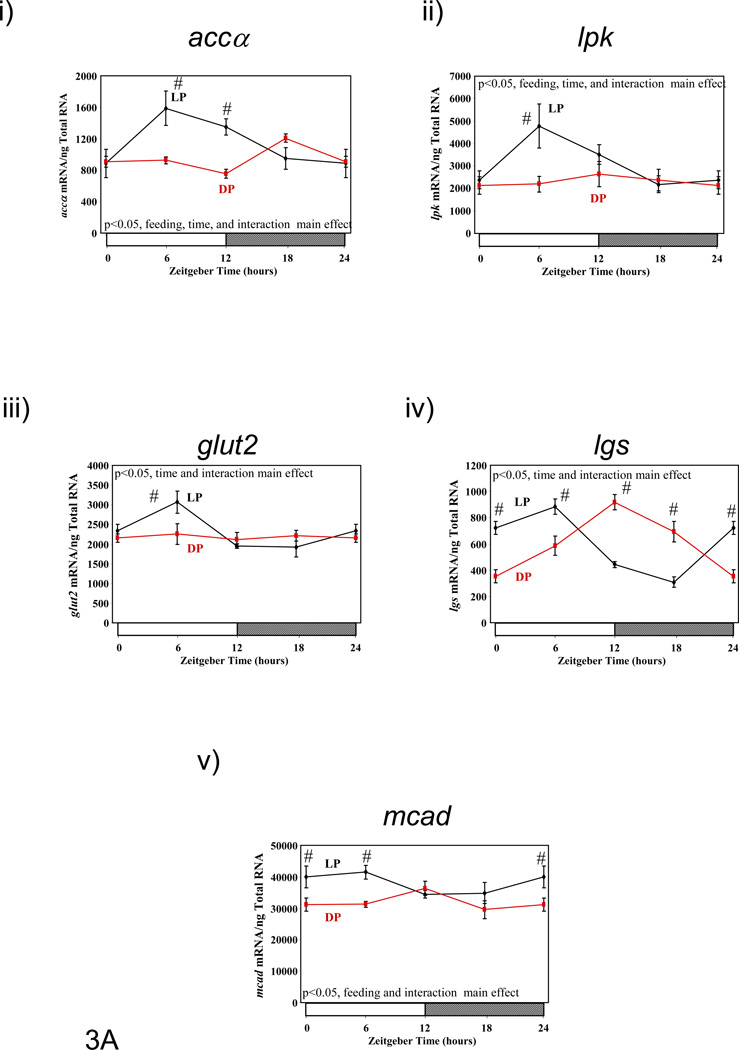
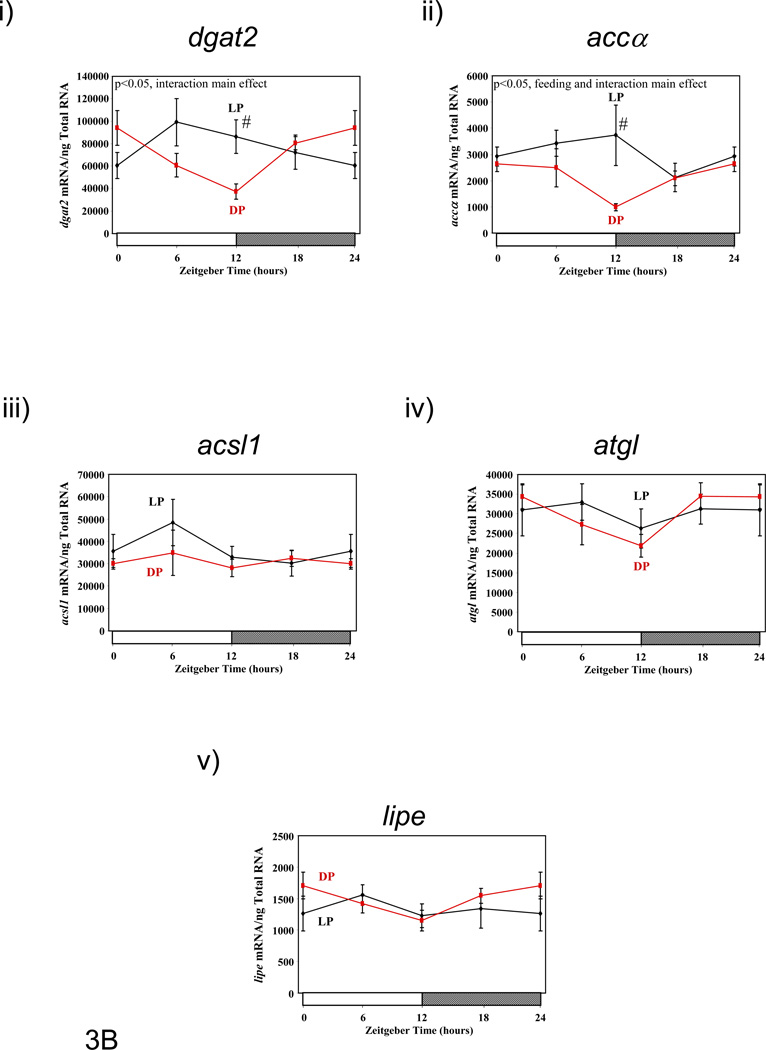
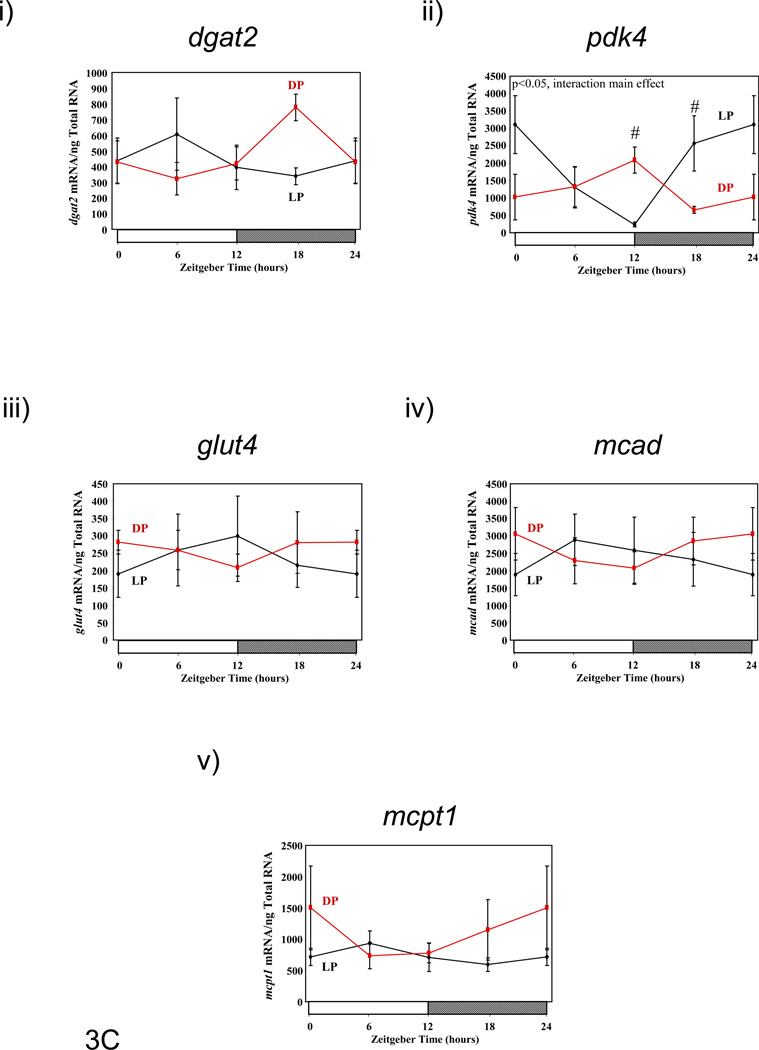
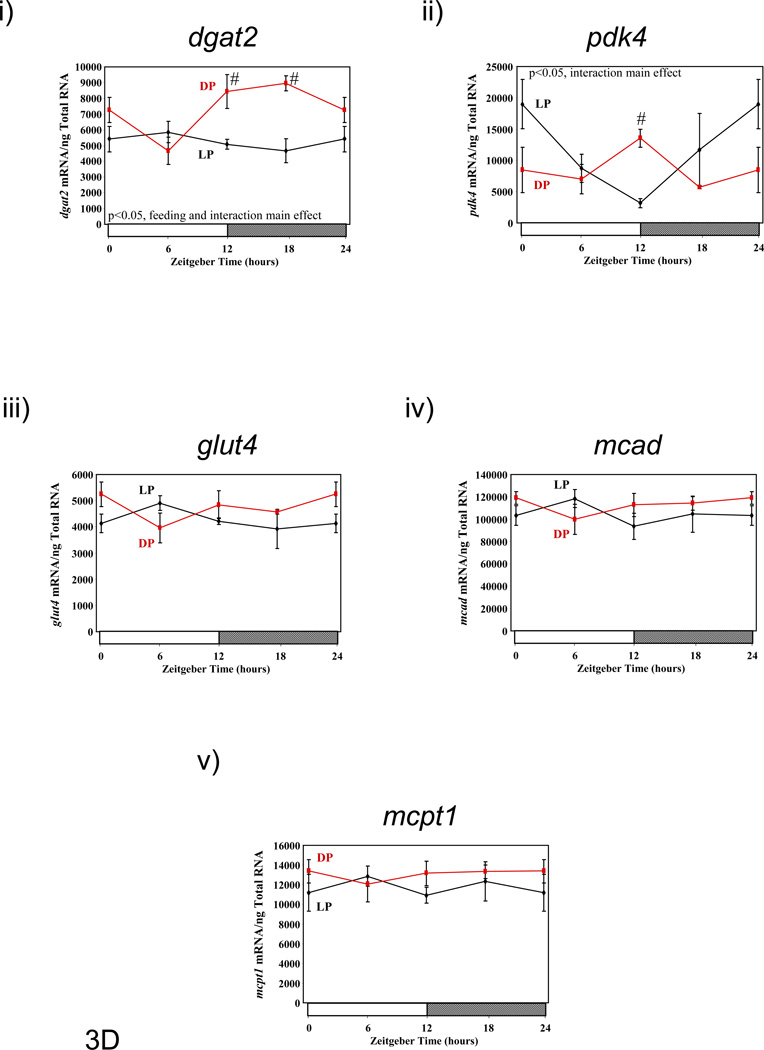
Figure 3 shows diurnal variations in numerous metabolic genes in liver, epididymal fat, gastrocnemius muscle, and heart isolated from LP and DP fed mice. Given distinct metabolic functions for these organs, relevant sets of metabolic genes were measured for each.
Figure 3.
Influence of restricted feeding on diurnal variations in metabolic gene expression in liver (A), epididymal fat (B), gastrocnemius muscle (C), and heart (D). Mice were randomly assigned to dark phase (DP; n=21) or light phase (LP; n=23) restricted feeding groups. On the 9th day of restricted feeding, mice were euthanized at ZT0, ZT6, ZT12, or ZT18. Data are reported as mean ± SEM for between 4 and 6 independent observations. Data at ZT0 are plotted a second time at ZT24. Main effects for time and/or feeding regime are reported in the top left hand corner of the figure panels. #, p<0.05 for DP versus LP fed mice (post hoc pair-wise comparisons).
In the case of the liver, genes involved in fatty acid/lipid metabolism (i.e., accα [acetyl-CoA carboxylase alpha] and mcad [medium chain acyl-CoA dehydrogenase]), as well as glucose metabolism (i.e., glut2 [facilitated glucose transporter 2], lpk [liver pyruvate kinase], and lgs [liver glycogen synthase]) were investigated (Figure 3A and Supplemental Table 1). Liver accα expression exhibited a diurnal variation in both LP and DP fed mice, with a phase difference of approximately 12 hours, peaking around 8 hours after food presentation. The amplitude of the oscillation tended to be higher in LP versus DP fed mice (p=0.07). Similar patterns were observed for lpk and glut2. In the case of lgs, the phase of the oscillation was shifted by approximately 8 hours, for LP versus DP fed mice, in the absence of an amplitude difference. A similar pattern was observed for mcad. On average, metabolic gene expression oscillations were phase shifted in the liver by 9.22 ± 1.57 hours (LP versus DP).
Genes involved in lipogenesis (i.e., dgat2 [diacylglycerol O-acyltransferase 2], accα, acsl1 [acyl-CoA synthetase long-chain family member 1]) and lipolysis (i.e., atgl adipose triglyceride lipase], lipe [hormone sensitive lipase]) were next investigated in epididymal fat isolated from LP and DP fed mice (Figure 3B and Supplemental Table 2). In the case of genes promoting lipogenesis, dgat2 and accα both exhibit a diurnal variation in DP fed mice, with highest levels of expression at the end of the dark phase. Time-of-day-dependent variations for these genes were less pronounced in epididymal fat isolated from LP fed mice (i.e., metabolic gene expression data did not fit a cosine curve in LP fed epididymal fat), which exhibited higher levels of expression, independent of the time-of-day. No significant differences were observed with respect to time-of-day or feeding group for acsl1 mRNA. In the case of the genes promoting lipolysis (i.e., atgl and lipe), these genes exhibit significant diurnal rhythms in DP, but not LP, fed mice (Supplemental Table 2).
Genes involved in lipid/fatty acid metabolism (i.e., dgat2, mcad, mcpt1 [carnitine palmitoyltransferase 1B]) and glucose metabolism (i.e., glut4, pdk4 [pyruvate dehydrogenase kinase 4]) were next investigated in gastrocnemius muscles isolated from DP and LP fed mice (Figure 3C and Supplemental Table 3). Of these genes, dgat2 and pdk4 exhibited significant diurnal variations in expression in DP fed mice (peaking around ZT18 and ZT10, respectively), which were significantly altered in LP fed mice. In contrast, glut4, mcad, and mcpt1 did not exhibit significant diurnal variations in expression in gastrocnemius muscles, and were not significantly different between DP and LP fed mice.
The heart is metabolically active organ, which has been shown to exhibit diurnal variations in both oxidative and non-oxidative metabolism.(23) Genes involved in lipid/fatty acid metabolism (i.e., dgat2, mcad, mcpt1) and glucose metabolism (i.e., glut4, pdk4) were investigated in hearts isolated from DP and LP fed mice (Figure 3D and Supplemental Table 4). Similar to gastrocnemious muscles, dgat2 exhibited a significant diurnal variation in hearts isolated from DP fed mice, which was almost completely suppressed in LP fed mice. In contrast, pdk4, glut4, mcad, and mcpt1 did not exhibit significant diurnal variations in expression in DP fed mouse hearts, although time-of-day-dependent differences were observed for pdk4 expression in DP versus LP fed mice.
Restricted Feeding Effects on Humoral Factors
Given the marked effects of restricted feeding on whole body energy balance, as well as metabolic gene expression in various tissues, we next decided to investigate diurnal variations in plasma nutrients in DP and LP fed mice (Figure 4). Plasma glucose and triglyceride levels both exhibited significant diurnal variations in DP fed mice, which peaked at approximately ZT6 and ZT0 respectively (Figures 4A–B). Plasma glucose did not vary significantly by time in LP fed mice (Figure 4A). In contrast, the variation in plasma TAG was essentially identical in LP and DP fed mice (Figure 4B). Previous studies have reported that feeding mice during the light phase results in a biphasic rhythm in plasma corticosterone levels, in which a second peak in this “stress” hormone appears at the time of food presentation. Using the CLAMS system, we find that LP feeding does not lead to a peak in corticosterone upon food presentation. As such, the phase of corticosterone diurnal variations is similar between DP and LP fed mice, although the amplitude of the oscillation is diminished in LP fed mice (Figure 4C).
Figure 4.
Influence of restricted feeding on diurnal variations in plasma glucose (A), triglyceride (B), and corticosterone (C). Mice were randomly assigned to dark phase (DP; n=21) or light phase (LP; n=23) restricted feeding groups. On the 9th day of restricted feeding, mice were euthanized at ZT0, ZT6, ZT12, or ZT18. Data are reported as mean ± SEM for between 4 and 6 independent observations. Data at ZT0 are plotted a second time at ZT24. Main effects for time and/or feeding regime are reported in the top left hand corner of the figure panels. #, p<0.05 for DP versus LP fed mice (post hoc pair-wise comparisons).
Restricted Feeding Effects on Body Weight Gain
A consequence of altered energy balance is often development of metabolic diseases, such as obesity, diabetes, and cardiovascular disease. Given the short duration of the current feeding study, and that previous studies have suggested that restricting food intake to the light phase is associated with weight gain in mice, we investigated only body weight differences in LP versus DP fed mice (baseline and at the end of the study).(7) Consistent with previous reports (7), as well as the disturbances in energy balance and metabolic gene expression reported here, LP fed mice gained more weight relative to DP fed mice during the 9 day restricted feeding protocol (2.4 ± 0.3g versus 1.6 ± 0.3g, LP versus DP fed mice, respectively; p<0.05).
DISCUSSION
The purpose of the present study was several-fold. First, we wished to establish a method for time-of-day-dependent restricted feeding in mice in the absence of direct human contact. Previous studies have shown that human contact (visual, auditory, olfactory, physical) is a considerable stressor on mice, resulting in increased physical activity, heart rate, blood pressure, and circulating levels of stress hormones, including corticosterone.(24–28) Previously published methodologies for restricted feeding studies in rodents have involved human contact (e.g., addition/removal of food from the cage, or exchanging the rodent between two cages [one cage has food, while the other does not]).(7, 10, 11, 29) These methods involve human contact twice daily. The latter is associated with a biphasic oscillation in corticosterone, peaking at the beginning of the light and dark phases.(30) The current study employed a computer-controlled, fully automated CLAMS for time-of-day-dependent food restriction. Through the use of this system, the effects of light/sleep phase restricted food intake could be determined in the absence of the stress of direct human contact (as confirmed by plasma corticosterone levels, which do not exhibit a biphasic pattern; Figure 4C). This system also utilizes cages with uniformly distributed holes in the floor, thereby preventing feces consumption by the coprophagic rodent during the food restriction period. A second goal of the present study was to quantify energy balance in a large number of mice undergoing restricted feeding; previous studies have established that relatively small alterations in energy balance can result in the pathogenesis of cardiometabolic diseases within the lifetime of the organism.(31–33) Through use of the CLAMS, time-of-day-dependent rhythms in food intake, energy expenditure, and physical activity were accurately quantified in >20 mice per group. A third goal of the present study was to perform a comprehensive analysis of diurnal variations in both circadian clock and metabolic genes in multiple metabolically active organs from the same mouse; previous studies have focused primarily on gene expression in the liver.
Time course studies reveal that restricted feeding regimes (LP and DP fed) induce essentially instantaneous changes in multiple energy balance parameters, which persist throughout the duration of these measurements (i.e., 8 days; Figure 1). Consistent with the nature of the study, food intake diurnal variations were markedly different between the feeding groups. Of interest was the observation that LP fed mice consumed a large meal immediately upon food presentation (i.e., beginning of light phase; Figure 1Aii), while this large meal upon food presentation was not observed in DP fed mice (at steady state; Figure 1Aii). Clear differences were also observed for both energy expenditure and RER between ad libitum, LP, and DP feeding regimes (Figures 1B and 1C). The extent to which restricted feeding induced phase shifts was both parameter and feeding group dependent. Not surprisingly, LP restricted feeding induced greater phase shifts in these parameters compared to DP-restricted feeding. Interestingly, DP feeding appears to synchronize oscillations in RER and energy expenditure, while LP feeding appeared to desynchronize these parameters (e.g., RER-energy expenditure phases differ by 2.1, 1.1, and 2.6 hours for ad libitum, DP, and LP fed mice respectively). In the case of physical activity, no major differences were observed between the feeding groups (with the exception of increased activity immediately prior to food availability in the restricted feeding groups [i.e., food anticipation]; Figure 1D). It should be noted that an important parameter influencing energy balance, namely digestion/absorption, was not assessed in the present study. Given that digestion and absorption are known to exhibit diurnal variations (34), future studies should be performed in order to determine whether time-of-day-dependent restricted feeding influences these parameters.
Subtle variations in energy balance can lead to modulation in cardiometabolic parameters, such as adiposity and body weight, over relatively long periods of time. (31–33) We therefore calculated total daily averages for energy expenditure, RER, food intake, and physical activity (Table 2). We found that LP fed mice consume approximately 10% more calories per day than DP fed mice. This is associated with a higher daily average RER (consistent with lower fatty acid oxidation throughout the course of the day). No significant differences were observed in total daily average energy expenditure or physical activity between LP and DP fed mice. However, LP fed mice exhibited significantly lower energy expenditure than ad libitum fed mice (which was not different between DP and ad libitum fed mice). Taken together, increased daily food intake, coupled with decreased fatty acid oxidation and energy expenditure in LP fed mice would likely promote adiposity (consistent with greater body weight gain observed in this group).
Previous studies have suggested that light phase restricted feeding results in approximate 12 hour phase shifts in hepatic metabolic and circadian clock gene expression.(9, 11) However, few studies have investigated other metabolically active tissues. In addition, it has been suggested that restricted feeding induced phase shifts in circadian clock genes is influenced by corticosterone.(30) Through the use of the CLAMS (which avoids direct human contact), plasma corticosterone does not exhibit a biphasic oscillation during the restricted feeding regimes, allowing the effects of restricted feeding on gene expression oscillations to be investigated in the absence of alterations in the phasic nature of this stress hormone. Consistent with previously reported studies, oscillations in circadian clock gene expression in the liver are markedly phase shifted in LP versus DP fed mice; average of 8.4 hour phase shift (Figure 2A). Such a pattern is also observed for a number of genes encoding for key metabolic enzymes (i.e., accα, lgs, mcad; Figure 3A). In contrast, circadian clock genes do not phase shift to the same extent in other metabolically active organs, such as adipose, skeletal muscle and heart (Figures 2B, 2C, and 2D). In contrast, the amplitude of the clock gene expression oscillations is often diminished in these tissues; a similar dampening of metabolic gene oscillations is also observed in these tissues (Figures 3B, 3C, and 3D). As such, these observations suggest that feeding-induced entrainment is stronger in the liver and that LP restricted feeding results in a dyssynchrony between metabolically active peripheral tissues.
In summary, the current study shows that sleep (light) phase restricted feeding results in increased caloric intake, decreased energy expenditure, decreased reliance on fatty acid oxidation, and dyssynchorony between metabolically active peripheral tissues. These profound alterations in homeostasis are associated with body weight gain. Collectively, these data are consistent with the concept that the time of day at which food is consumed significantly impacts energy balance.
Supplementary Material
ACKNOWLEDGEMENTS
This work was supported by the National Heart, Lung, and Blood Institute (HL-074259 and HL-106199).
Footnotes
CONFLICT OF INTEREST
The authors do not have any competing financial conflicts in relation to this work.
SUPPLEMENTARY INFORMATION
Supplementary information is available at IJO's website.
REFERENCES
- 1.Froy O. Metabolism and circadian rhythms--implications for obesity. Endocr Rev. 2010;31:1–24. doi: 10.1210/er.2009-0014. [DOI] [PubMed] [Google Scholar]
- 2.Giovannini M, Verduci E, Scaglioni S, Salvatici E, Bonza M, Riva E, et al. Breakfast: a good habit, not a repetitive custom. J Int Med Res. 2008;36:613–624. doi: 10.1177/147323000803600401. [DOI] [PubMed] [Google Scholar]
- 3.Harma M, Ilmarinen J. Towards the 24-hour society--new approaches for aging shift workers? Scand J Work Envion Health. 1999;25:610–615. doi: 10.5271/sjweh.488. [DOI] [PubMed] [Google Scholar]
- 4.Knutson KL, Spiegel K, Penev P, Van Cauter E. The metabolic consequences of sleep deprivation. Sleep Med Rev. 2007;11:163–178. doi: 10.1016/j.smrv.2007.01.002. [DOI] [PMC free article] [PubMed] [Google Scholar]
- 5.Knutsson A, Akerstedt T, Jonsson B, Orth-Gomer K. Increased risk of ischaemic heart disease in shift workers. Lancet. 1986;12:89–92. doi: 10.1016/s0140-6736(86)91619-3. [DOI] [PubMed] [Google Scholar]
- 6.Stunkard AJ, Allison KC, Lundgren JD, O'Reardon JP. A biobehavioural model of the night eating syndrome. Obes Rev. 2009;10(Suppl 2):69–77. doi: 10.1111/j.1467-789X.2009.00668.x. [DOI] [PubMed] [Google Scholar]
- 7.Arble DM, Bass J, Laposky AD, Vitaterna MH, Turek FW. Circadian timing of food intake contributes to weight gain. Obesity (Silver Spring) 2009;17:2100–2102. doi: 10.1038/oby.2009.264. [DOI] [PMC free article] [PubMed] [Google Scholar]
- 8.Bray MS, Tsai JY, Villegas-Montoya C, Boland BB, Blasier Z, Egbejimi O, et al. Time-of-day-dependent dietary fat consumption influences multiple cardiometabolic syndrome parameters in mice. Int J Obes (Lond) 2010;34:1589–1598. doi: 10.1038/ijo.2010.63. [DOI] [PMC free article] [PubMed] [Google Scholar]
- 9.Vollmers C, Gill S, DiTacchio L, Pulivarthy SR, Le HD, Panda S. Time of feeding and the intrinsic circadian clock drive rhythms in hepatic gene expression. Proc Natl Acad Sci U S A. 2009;106:21453–21458. doi: 10.1073/pnas.0909591106. [DOI] [PMC free article] [PubMed] [Google Scholar]
- 10.Damiola F, Le MN, Preitner N, Kornmann B, Fleury-Olela F, Schibler U. Restricted feeding uncouples circadian oscillators in peripheral tissues from the central pacemaker in the suprachiasmatic nucleus. Genes Dev. 2000;14:2950–2961. doi: 10.1101/gad.183500. [DOI] [PMC free article] [PubMed] [Google Scholar]
- 11.Satoh Y, Kawai H, Kudo N, Kawashima Y, Mitsumoto A. Time-restricted feeding entrains daily rhythms of energy metabolism in mice. Am J Physiol Regul Integr Comp Physiol. 2006;290:R1276–R1283. doi: 10.1152/ajpregu.00775.2005. [DOI] [PubMed] [Google Scholar]
- 12.Edery I. Circadian rhythms in a nutshell. Physiol Genomics. 2000;3:59–74. doi: 10.1152/physiolgenomics.2000.3.2.59. [DOI] [PubMed] [Google Scholar]
- 13.Takahashi JS, Hong HK, Ko CH, McDearmon EL. The genetics of mammalian circadian order and disorder: implications for physiology and disease. Nat Rev Genet. 2008;9:764–775. doi: 10.1038/nrg2430. [DOI] [PMC free article] [PubMed] [Google Scholar]
- 14.Bass J, Takahashi JS. Circadian integration of metabolism and energetics. Science. 2010;330:1349–1354. doi: 10.1126/science.1195027. [DOI] [PMC free article] [PubMed] [Google Scholar]
- 15.Bray MS, Young ME. Regulation of fatty acid metabolism by cell autonomous circadian clocks: time to fatten up on information? J Biol Chem. 2011;286:11883–11889. doi: 10.1074/jbc.R110.214643. [DOI] [PMC free article] [PubMed] [Google Scholar]
- 16.Tsai JY, Kienesberger PC, Pulinilkunnil T, Sailors MH, Durgan DJ, Villegas-Montoya C, et al. Direct regulation of myocardial triglyceride metabolism by the cardiomyocyte circadian clock. J Biol Chem. 2010;285:2918–2929. doi: 10.1074/jbc.M109.077800. [DOI] [PMC free article] [PubMed] [Google Scholar]
- 17.Young M, Razeghi P, Taegtmeyer H. Clock genes in the heart: characterization and attenuation with hypertrophy. Circ Res. 2001;88:1142–1150. doi: 10.1161/hh1101.091190. [DOI] [PubMed] [Google Scholar]
- 18.Young M, Razeghi P, Cedars A, Guthrie P, Taegtmeyer H. Intrinsic diurnal variations in cardiac metabolism and contractile function. Circ Res. 2001;89:1199–1208. doi: 10.1161/hh2401.100741. [DOI] [PubMed] [Google Scholar]
- 19.Durgan D, Trexler N, Egbejimi O, McElfresh T, Suk H, Petterson L, et al. The circadian clock within the cardiomyocyte is essential for responsiveness of the heart to fatty acids. J Biol Chem. 2006;281:24254–24269. doi: 10.1074/jbc.M601704200. [DOI] [PubMed] [Google Scholar]
- 20.Durgan D, Smith J, Hotze M, Egbejimi O, Cuthbert K, Zaha V, et al. Distinct transcriptional regulation of long-chain acyl-CoA synthetase isoforms and cytosolic thioesterase 1 in the rodent heart by fatty acids and insulin. Am J Physiol Heart Circ Physiol. 2006;290:H2480–H2497. doi: 10.1152/ajpheart.01344.2005. [DOI] [PubMed] [Google Scholar]
- 21.Young M, Patil S, Ying J, Depre C, Ahuja H, Shipley G, et al. Uncoupling protein 3 transcription is regulated by peroxisome proliferator-activated receptor (alpha) in the adult rodent heart. FASEB J. 2001;15:833–845. doi: 10.1096/fj.00-0351com. [DOI] [PubMed] [Google Scholar]
- 22.Mistlberger RE. Neurobiology of food anticipatory circadian rhythms. Physiol Behav. 2011;104:535–545. doi: 10.1016/j.physbeh.2011.04.015. [DOI] [PubMed] [Google Scholar]
- 23.Durgan DJ, Young ME. The cardiomyocyte circadian clock: emerging roles in health and disease. Circ Res. 2010;106:647–658. doi: 10.1161/CIRCRESAHA.109.209957. [DOI] [PMC free article] [PubMed] [Google Scholar]
- 24.Turner JG, Parrish JL, Hughes LF, Toth LA, Caspary DM. Hearing in laboratory animals: strain differences and nonauditory effects of noise. Comp Med. 2005;55:12–23. [PMC free article] [PubMed] [Google Scholar]
- 25.Brown AM, Julian T. The body temperature response of two inbred strains of mice to handling, saline and amphetamine. Int J Neuropharmacol. 1968;7:531–541. doi: 10.1016/0028-3908(68)90065-8. [DOI] [PubMed] [Google Scholar]
- 26.Kvetnansky R, Sabban EL. Stress and molecular biology of neurotransmitter- related enzymes. Ann N Y Acad Sci. 1998;851:342–356. doi: 10.1111/j.1749-6632.1998.tb09008.x. [DOI] [PubMed] [Google Scholar]
- 27.Kramer K, van de Weerd H, Mulder A, van Heijningen C, Baumans V, Remie R, et al. Effect of conditioning on the increase of heart rate and body temperature provoked by handling in the mouse. Alternatives to Laboratory Animals. 2004;32:177–181. doi: 10.1177/026119290403201s29. [DOI] [PubMed] [Google Scholar]
- 28.Poole T. Happy animals make good science. Lab Anim. 1997;31:116–124. doi: 10.1258/002367797780600198. [DOI] [PubMed] [Google Scholar]
- 29.Sujino M, Furukawa K, Koinuma S, Fujioka A, Nagano M, Iigo M, et al. Differential Entrainment of Peripheral Clocks in the Rat by Glucocorticoid and Feeding. Endocrinology. doi: 10.1210/en.2011-1794. [DOI] [PubMed] [Google Scholar]
- 30.Le Minh N, Damiola F, Tronche F, Schutz G, Schibler U. Glucocorticoid hormones inhibit food-induced phase-shifting of peripheral circadian oscillators. EMBO J. 2001;20:7128–7136. doi: 10.1093/emboj/20.24.7128. [DOI] [PMC free article] [PubMed] [Google Scholar]
- 31.Hill JO. Understanding and addressing the epidemic of obesity: an energy balance perspective. Endocr Rev. 2006;27:750–761. doi: 10.1210/er.2006-0032. [DOI] [PubMed] [Google Scholar]
- 32.Speakman JR, Levitsky DA, Allison DB, Bray MS, de Castro JM, Clegg DJ, et al. Set points, settling points and some alternative models: theoretical options to understand how genes and environments combine to regulate body adiposity. Dis Model Mech. 2011;4:733–745. doi: 10.1242/dmm.008698. [DOI] [PMC free article] [PubMed] [Google Scholar]
- 33.Mokdad AH, Bowman BA, Ford ES, Vinicor F, Marks JS, Koplan JP. The continuing epidemics of obesity and diabetes in the United States. JAMA. 2001;286:1195–1200. doi: 10.1001/jama.286.10.1195. [DOI] [PubMed] [Google Scholar]
- 34.Hussain MM, Pan X. Clock genes, intestinal transport and plasma lipid homeostasis. Trends Endocrinol Metab. 2009;20:177–185. doi: 10.1016/j.tem.2009.01.001. [DOI] [PMC free article] [PubMed] [Google Scholar]
Associated Data
This section collects any data citations, data availability statements, or supplementary materials included in this article.


