Abstract
Background: Scotland has been dubbed ‘the sick man of Europe’ on account of its higher mortality rates compared with other western European countries. It is not clear the length of time for which Scotland has had higher mortality rates. The root causes of the higher mortality in Scotland remain elusive. Methods: Life expectancy data from the Human Mortality Database were tabulated and graphed for a selection of wealthy, mainly European countries from around 1850 onwards. Results: Scotland had a life expectancy in the mid-range of countries included in the Human Mortality Database from the mid-19th century until around 1950. After 1950, Scottish life expectancy improved at a slower rate than in comparably wealthy nations before further faltering during the last 30 years. Scottish life expectancy now lies between that of western European and eastern European nations. The USA also displays a marked faltering in its life expectancy trend after 1981. There is an inverse association between life expectancy and the Index of Economic Freedom such that greater neoliberalism is associated with a smaller increase, or a decrease, in life expectancy. Conclusion: Life expectancy in Scotland has only been relatively low since around 1950. From 1980, life expectancy in Scotland, the USA and, to a greater extent, the former USSR displays a further relative faltering. It has been suggested that Scotland suffered disproportionately from the adoption of neoliberalism across the nations of the UK, and the evidence here both supports this suggestion and highlights other countries which may have suffered similarly.
Introduction
Scotland has been dubbed the ‘sick man’ of Europe. This reflects its paradoxically high mortality compared with other western European countries. In the past 30 years Scotland has seen, to a greater extent than other parts of the UK and the rest of Europe, increases in alcohol-related deaths, violent deaths and suicide. This has added to already high levels of premature deaths due to cardiovascular disease, cancer and stroke,1,2 and higher levels of drug-related deaths than the rest of the UK.3 Inequalities in Scottish mortality and morbidity have also risen in the past three decades,4 driving much of the increase in health inequalities across the UK.5,6
In 2001, less than half of the 15% excess mortality in Scotland as compared with England and Wales could be accounted for by higher levels of deprivation.7 Nor does it seem likely that poverty and deprivation explain all of the divergent pattern in Scotland compared with other European countries; indeed, the region of greatest deprivation within Scotland compares unfavourably in terms of mortality with European regions which in fact suffer from greater poverty and unemployment.8,9 Even within Britain, the ability to explain the higher level of mortality in Scotland, and in Glasgow in particular, by reference to deprivation has declined since 1981—at which point it could account for close to two-thirds of a rather smaller excess of 12%.7,10 It is not fully known when Scotland's relatively higher mortality pattern first appeared.
There are at least 17 hypotheses which have been suggested to explain Scotland's mortality record.11 One of these hypotheses, focussing on the period from the 1980s onwards, is that Scotland suffered disproportionately from a neoliberal ‘political attack’ under the Conservative government which was first elected in 1979.12
We use the Human Mortality Database,13 which provides a longer time series of data than was previously available for Scotland,2,14 to explore when the mortality divergence between Scotland and the rest of Europe first appeared. We then go on to explore whether the mortality pattern from 1980 might be explained by the adoption of neoliberal economics.
Methods
The Human Mortality Database has published data stretching back to the 18th and 19th centuries detailing the life expectancy each year for a collection of relatively rich nations. The data were tabulated in a spreadsheet to allow a series of descriptive graphs for total life expectancy (i.e. for men and women together) to be presented for Scotland from 1850 in relation to: (i) all other available countries; (ii) other constituent nations of the UK; (iii) other western European countries; (iv) east European countries; and (v) American and Latin American countries.
To examine whether there was association between economic policy and life expectancy from the 1980s, data were taken from the Fraser Institute's ‘Index of Economic Freedom’ for the longest period available between 1980 and 2006. The data for the 1980s were taken from the 2001 report15 and the data for the 1990s and 2000s were taken from the 2009 report.16 The Index of Economic Freedom is a composite score based on 23 factors regarded by neoliberals as markers of a neoliberal economic system. It includes measures of the: size of government (including government expenditure, tax and enterprise); legal structure and security of property rights; access to ‘sound money’; freedom of international trade; and regulation of credit, labour and business. The Index scores range from 0 to 10 with higher scores indicating greater ‘economic freedom’ (i.e. more neo-liberal).
All countries which had data on life expectancy from the Human Mortality Database and economic data from the Fraser Institute were included. The percentage change in both the Index of Economic Freedom and life expectancy were then calculated for the longest time series available between 1980 and 2006 and displayed graphically for men and women. A correlation coefficient was then calculated between the two measures.
Results
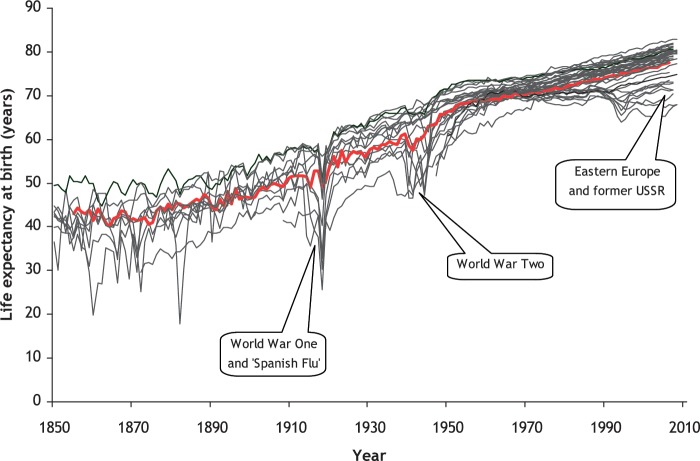
Figure 1 shows all the data for all available countries in the Human Mortality Database after 1850 (data are available from 1855 for Scotland). Scotland has a comparable life expectancy to other countries in the database throughout the available time period and at no point does Scotland become an outlier in the complete international dataset, unlike Spain during the influenza outbreak in 1919, France during the Second World War or the countries of the former USSR from 1990 onwards—during the rapid imposition of a radical version of neoliberal capitalism.
Figure 1.
Life expectancy at birth of Scotland (in red) compared with all other available nations from 1850 (males and females; data from the Human Mortality Database, 2010). Data from: Australia, Austria, Belgium, Belarus, Bulgaria, Canada, Chile, Czech Republic, Denmark, East Germany, England and Wales, Estonia, Finland, France, Germany, Hungary, Ireland, Iceland, Israel, Italy, Japan, Latvia, Lithuania, Luxembourg, Netherlands, New Zealand, Northern Ireland, Norway, Poland, Portugal, Russia, Scotland, Slovakia, Slovenia, Spain, Sweden, Switzerland, Taiwan, West Germany, Ukraine and USA
The Scottish mortality pattern is, however, starker if compared with England and Wales and Northern Ireland (Supplementary figure S1). Around 1900, Scotland and England and Wales show very similar life expectancy, but following the First World War and the 1919 influenza outbreak, Scotland gets left behind, despite England and Wales suffering more profoundly during the period 1910–20. Data are available for Northern Ireland from 1923, and the life expectancy here is very similar to Scotland's until around 1970. The life expectancy in Northern Ireland then dips (both in absolute and relative terms) for around a decade during the most intense period of its civil conflict, before overtaking Scotland once again around 1980. England and Wales continue to have a better life expectancy from 1920 right through to the end of the time series.
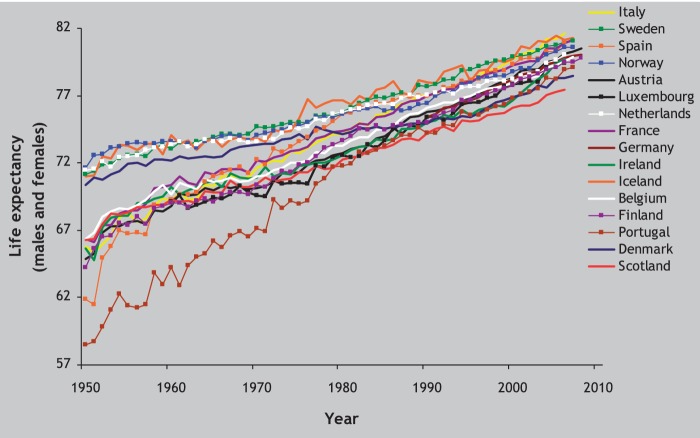
Figure 2 shows Scotland's life expectancy trend in relation to other western European countries. Until 1950, Scottish life expectancy sits at around the median of the distribution, but improves more slowly after this to begin the 21st century as the nation with the lowest figure. There are at least four other western European countries (Spain, Portugal, Finland and Italy) which, for the first 50 years of the 20th Century, had a much lower life expectancy than Scotland but which improved more quickly over the next 50 years to achieve a higher figure (figure 2). Scotland has also been slower to improve its life expectancy compared with its neighbours in the more recent time period from 1970 onwards. Even in this more recent time series, Scotland can be seen to diverge from other countries and be overtaken by Austria and Portugal.
Figure 2.
Life expectancy at birth of Scotland compared with other western European countries from 1950 (males and females; data from the Human Mortality Database, 2010)
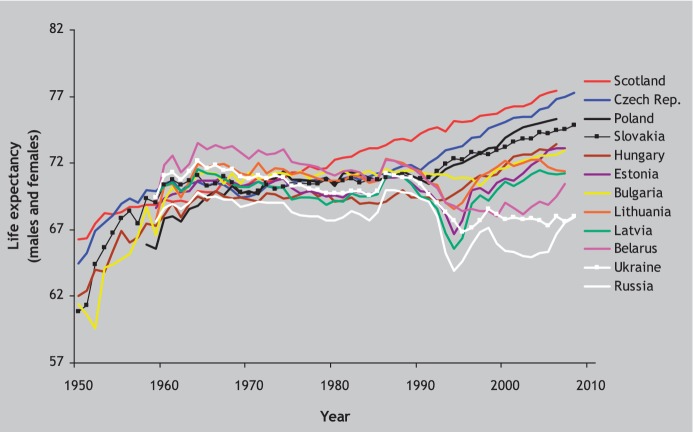
Figure 3 shows the Scottish trend in relation to that of the eastern European countries. Scotland sits in between the east European countries and the rest of western Europe, with eastern Europe displaying the familiar flattening in life expectancy improvement from the 1970s and dip in the early 1990s.
Figure 3.
Life expectancy at birth of Scotland compared with eastern European countries from 1950 (males and females; data from the Human Mortality Database, 2010)
Supplementary figure 2 compares Scotland with North and Latin American nations, Australia and New Zealand. Scotland has a consistently worse life expectancy than all countries with available data. It is interesting to note from this same graph that life expectancy in the USA also seems to falter from around 1981 onwards (the point at which the USA moved decisively towards neoliberalism under President Reagan). Life expectancy in the USA ranks 12th highest in 1981 out of 41 (compared with Scotland's rank of 22nd) but only 26th highest by 2006 (compared with Scotland's rank of 28th).
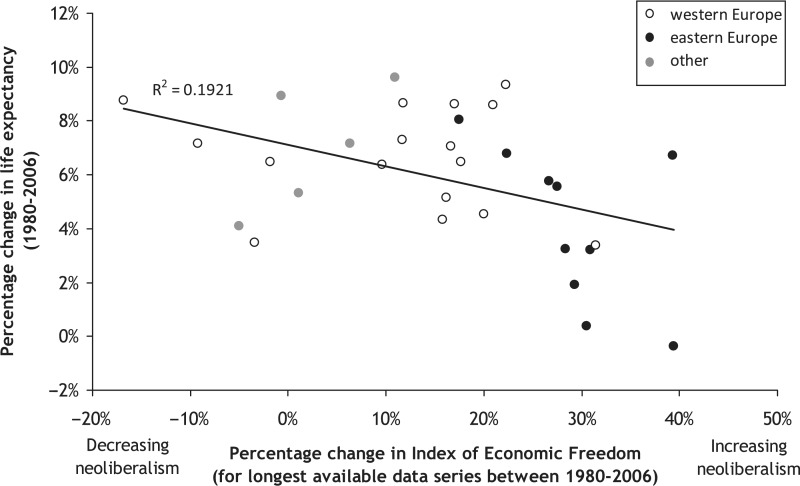
Comparing the change in life expectancy for the longest time period of data availability between 1980 and 2006 shows an inverse association with the Index of Economic Freedom (i.e. greater change towards neoliberalism is associated with a smaller increase, or a decrease, in life expectancy). No correlation coefficient was calculated for men as the relationship does not appear to be linear and is driven largely by the rapid adoption of neoliberalism and decline or stagnation in life expectancy in eastern Europe (Supplementary figure 3). There was a weaker, but linear, correlation for women (R2 = 0.19) suggesting a similar effect (figure 4).
Figure 4.
Percentage change in female life expectancy (1980–2006) and in the Index of Economic Freedom (for the longest period available 1980–2006). Includes data for: Australia, Austria, Belgium, Bulgaria, Canada, Czech Republic, Denmark, Estonia, Finland, France, Hungary, Iceland, Ireland, Italy, Japan, Latvia, Lithuania, Luxembourg, Netherlands, Norway, Poland, Portugal, Russia, Slovak Rep., Spain, Sweden, Switzerland, Taiwan, Ukraine, UK and USA
Discussion
Scotland had a life expectancy in the mid-range of countries included in the Human Mortality Database from the mid-19th century until around 1950. After 1950, Scottish life expectancy improved at a slower rate than the comparison nations before further faltering during the past 30 years. Scottish life expectancy now lies between that of western and eastern European nations.
There are a number of caveats surrounding the quality of the data, which are particularly relevant for the earliest data periods.17 However, it is unlikely that small errors in these data would alter the overall conclusions of the article. It is also possible that if a wider range of countries were included a different patterning might emerge, although most countries with a reasonable population size within Europe are included in the data set. There are also no data available for the Index of Economic Freedom for Scotland in isolation from the rest of the UK.
It is known that the mortality rates in Scotland, and in the west of Scotland and Glasgow in particular, are much higher than in the rest of the UK. There has however been an apparent reluctance to consider the similarity of the Scottish mortality experience with that of Eastern Europe,18 even though Scotland's faltering improvement over the past few decades has left it between the life expectancy of the latter and western Europe.
One hypothesis regarding the recent trend in mortality in Scotland foregrounds neoliberal policies. This does not preclude other more proximal but related influences on Scotland's health and its position relative to other countries: for example, its poor (and in some cases worsening) record in relation to alcohol, smoking, drugs, diet and physical activity.1 Rather, it seeks to position political economy as a key factor in shaping and aligning the contributions of other, especially more proximal, causes.19
Neoliberal policies have been associated with poor health outcomes and health inequalities in a number of studies in Eastern Europe (with very little time lag between the implementation of policy and health outcomes)20–23 and the USA,24 but the UK also underwent radical change from 1979 as the Conservative government elected in that year implemented a range of such policies. While the resulting change was less profound than that flowing from the stark imposition of neoliberalism in Russia and other parts of the former Soviet Union after 1990, and perhaps also somewhat less profound than ‘Reaganomics’ in the USA after 1980, it has been further argued that Scotland, and in particular the west of Scotland, was, amongst the nations of the UK, disproportionately vulnerable to, and worse affected by, its damaging effects.25,26 It is therefore possible that the intensity of the application of neoliberal policies has a ‘dose–effect’ relationship with mortality, in that those countries experiencing the most intense impact of neoliberalism suffered more than those countries where the movement in that direction was less intense (more gradual, managed and/or mitigated), or where there were other confounding variables (such as the gain of substantive political independence for a previously dependent country—such as in Poland).23 It is also worth noting that as health inequalities have risen rapidly in the UK over the past 30 years this has disproportionately affected Scotland because it contains the poorest communities with the worst health outcomes.6,27 Scotland has also had a devolved government since 1999 which has had responsibility for housing, health and social care policies, but there is little evidence that this has changed its mortality trajectory.
This article illustrates that other countries have managed to improve life expectancies to achieve close to the West European median within one or two decades (including Austria, Northern Ireland and Portugal). It is not, therefore, inevitable that Scotland need continue to suffer higher mortality than other countries for the foreseeable future. Many of the most important determinants of health are already known, including income, inequality, employment and housing.28 These ‘structural’ determinants are themselves heavily shaped politically and ideologically.24,29 Actions to address ‘all of these determinants’ will be needed to address the faltering mortality in Scotland and in other comparably rich nations which have seen a faltering in their life expectancy trend in recent decades.
Further research is merited to consider the precise impact on Scotland of the application of neoliberal policies in recent decades. This is particularly relevant in the context of the current UK coalition government which has embarked on a ‘reform’ agenda which includes a ‘cumulative, abrupt and substantial programme of spending cuts and tax increases from 2010 to 2015’, together with ‘a far-reaching restructuring of state services, involving significant transfers of responsibility from the state to the private sector and the citizen’.30 As authoritative commentators have observed, ‘On current projections public expenditure in the UK appears likely to fall below that in the USA by 2014 or 2015. This is simply unprecedented and, if fully implemented, indicates a radical new departure in British policy directions’.30 This programme, the authors continue is ‘certain to generate winners and losers’—indeed the ‘rewards and penalties are potentially greater than under any previous programme in this country’.30 It seems clear that amongst the many effects of this agenda will be those which register further effects in terms of health and mortality—key determinants of health and mortality, including those mentioned above. If the radical neoliberalism of recent decades was indeed responsible or partially responsible for the recent Scottish mortality phenomenon, as is the view of a significant section of academic and other commentators in Scotland today,25,26,31–33 there is a very real danger that the yet more radical neoliberalism which is currently being implemented will result in a future rise in mortality relative to the rest of Europe.21
Supplementary data
Supplementary data are available at EURPUB online.
Key points.
Scotland has a higher mortality rate than most other Western European countries.
Life expectancy in Scotland was comparable with other countries in Europe until around 1950, after which improvement in Scotland occurred at a slower rate.
From around 1980, the improvement in life expectancy in Scotland and the USA faltered in comparison with Western European countries, but to a lesser extent than the drop in life expectancy in Eastern Europe.
There is a moderate association between a rapid adoption of neoliberalism and a slower improvement in life expectancy from 1980 to 2006.
Acknowledgements
The opinions expressed in this article reflect those of the authors and not the employing organizations.
Conflicts of interest: None declared.
References
- 1.Hanlon P, Walsh D, Whyte B. Let Glasgow Flourish. Glasgow: Glasgow Centre for Population Health; 2006. [Google Scholar]
- 2.Leon D, Morton S, Cannegieter S, McKee M. Understanding the Health of Scotland's Population in an International Context: A Review of Current Approaches, Knowledge and Recommendations for New Research Directions. London: London School of Hygiene and Tropical Medicine and Public Health Institute for Scotland; 2003. Available at http://www.scotpho.org.uk/home/Comparativehealth/InternationalComparisons/int_mortality_comparisons.asp (20 April 2010, date last accessed) [Google Scholar]
- 3.Bloor M, Gannon M, Hay G, et al. Contribution of problem drug users’ deaths to excess mortality in Scotland: secondary analysis of cohort study. BMJ. 2008;337:a478. doi: 10.1136/bmj.a478. [DOI] [PMC free article] [PubMed] [Google Scholar]
- 4.Leyland A, Dundas R, McLoone P, Boddy F. Cause-specific inequalities in mortality in Scotland: two decades of change. A population-based study. BMC Public Health. 2007;7:172. doi: 10.1186/1471-2458-7-172. [DOI] [PMC free article] [PubMed] [Google Scholar]
- 5.Smith GD, Dorling D, Shaw M. Poverty, Inequality and Health in Britain 1800-2000: A Reader. Bristol: The Policy Press; 2001. [Google Scholar]
- 6.Thomas B, Dorling D, Smith GD. Inequalities in premature mortality in Britain: observational study from 1921 to 2007. BMJ. 2010;341:c3639. doi: 10.1136/bmj.c3639. [DOI] [PMC free article] [PubMed] [Google Scholar]
- 7.Hanlon P, Lawder R, Buchanan D, et al. Why is mortality higher in Scotland than in England & Wales? Decreasing influence of socioeconomic deprivation between 1981 and 2001 supports the existence of a ‘Scottish effect’. J Public Health. 2005;27:199–204. doi: 10.1093/pubmed/fdi002. [DOI] [PubMed] [Google Scholar]
- 8.Walsh D, Taulbut M, Hanlon P. The Aftershock of Deindustrialisation - Trends in Mortality in Scotland and Other Parts of Post-industrial Europe. Glasgow: Glasgow Centre for Population Health; 2008. [DOI] [PubMed] [Google Scholar]
- 9.Walsh D, Taulbut M, Hanlon P. The aftershock of deindustrialization—trends in mortality in Scotland and other parts of post-industrial Europe. Eur J Public Health. 2010;20:58–64. doi: 10.1093/eurpub/ckp063. [DOI] [PubMed] [Google Scholar]
- 10.Walsh D, Bendel N, Jones R, Hanlon P. It's not ‘just deprivation’: why do equally deprived UK cities experience different health outcomes? Public Health. 2010;124:487–95. doi: 10.1016/j.puhe.2010.02.006. [DOI] [PubMed] [Google Scholar]
- 11.McCartney G, Collins C, Walsh D, Batty GD. Accounting for Scotland's Excess Mortality: Towards a Synthesis. Glasgow: Glasgow Centre for Population Health; 2011. [Google Scholar]
- 12.Collins C, McCartney G. Is a ‘political attack’ an explanation for the ‘Scottish Effect’ in health outcomes? Int J Health Services. 2011;41(3):501–523. doi: 10.2190/HS.41.3.f. [DOI] [PubMed] [Google Scholar]
- 13.Human Mortality Database. University of California, Berkeley (USA) and Max Planck Institute for Demographic Research (Germany) 2010 Available at www.mortality.org (4 June 2010, date last accessed) [Google Scholar]
- 14.Whyte B. Scottish mortality in a European context 1950-2000: an analysis of comparative mortality trends. Edinburgh Scottish Public Health Observatory, 2007. Available at http://www.scotpho.org.uk/nmsruntime/saveasdialog.asp?lID=3591&sID=3079 (20 April 2010, date last accessed) [Google Scholar]
- 15.Gwartney J, Lawson R, Park W, Skipton C. Economic Freedom of the World 2001 Annual Report. Vancouver: Fraser Institute; 2001. [Google Scholar]
- 16.Gwartney J, Lawson R, Grubel H, et al. Economic Freedom of the World 2009. Vancouver: Fraser Institute; 2009. [Google Scholar]
- 17.Wilmoth J, Andreev K, Jdanov D, Glei D. Methods protocol for the Human Mortality Database. University of California, Berkeley and Max Planck Institute for Demographic Research. 2007 http://www.mortality.org/Public/Docs/MethodsProtocol.pdf (12 September 2011, date last accessed) [Google Scholar]
- 18.Leon D, Chenet L, Shkolnikov V, et al. Huge variation in Russian mortality rates 1984-1994: artefact, alcohol, or what? Lancet. 1997;350:383–8. doi: 10.1016/S0140-6736(97)03360-6. [DOI] [PubMed] [Google Scholar]
- 19.McCartney G, Collins C, Walsh D, Batty GD. Accounting for Scotland's excess mortality: towards a synthesis. Glasgow, Glasgow Centre for Population Health, 2011 The Scottish Mortality Phenomenon: Towards a Synthesis. 2010 http://www.gcph.co.uk/publications/238_accounting_for_scotlands_excess_mortality_towards_a_synthesis (12 September 2011, date last accessed) [Google Scholar]
- 20.Beckfield J, Krieger N. Epi + demos + cracy: linking political systems and priorities to the magnitude of health inequities–evidence, gaps, and a research Agenda. Epidemiol Rev. 2009;31:152–177. doi: 10.1093/epirev/mxp002. [DOI] [PubMed] [Google Scholar]
- 21.Stuckler D, Basu S, McKee M. Budget crises, health, and social welfare programmes. BMJ. 2010;340:c3311. doi: 10.1136/bmj.c3311. [DOI] [PubMed] [Google Scholar]
- 22.Stuckler D, Basu S, Suhrcke M, et al. The public health effect of economic crises and alternative policy responses in Europe: an empirical analysis. Lancet. 2009;374:315–23. doi: 10.1016/S0140-6736(09)61124-7. [DOI] [PubMed] [Google Scholar]
- 23.Stuckler D, King L, McKee M. Mass privatisation and the post-communist mortality crisis: a cross national analysis. Lancet. 2009;373:399–407. doi: 10.1016/S0140-6736(09)60005-2. [DOI] [PubMed] [Google Scholar]
- 24.Navarro V, Borrell C, Benach J, et al. The importance of the political and the social in explaining mortality differentials among the countries of the OECD, 1950-1998. Int J Health Serv. 2003;33:419–94. doi: 10.2190/R7GE-8DWK-YY6C-183U. [DOI] [PubMed] [Google Scholar]
- 25.Phillips J. The Industrial Politics of Devolution. Scotland in the 1960s and 1970s. Manchester: Manchester University Press; 2008. [Google Scholar]
- 26.Foster J. The Economic Restructuring of the West of Scotland: 1945-2000. In: Blazyca G, editor. Restructuring Regional and Global Economics: Towards a Comparative Study of Scotland and Upper Silesia. Aldershot: Ashgate; 2003. [Google Scholar]
- 27.Shaw M, Smith GD, Dorling D. Health inequalities and new labour: how the promises compare with real progress. BMJ. 2005;330:1016–21. doi: 10.1136/bmj.330.7498.1016. [DOI] [PMC free article] [PubMed] [Google Scholar]
- 28.Marmot M, Friel S, Bell R, et al. Closing the gap in a generation: health equity through action on the social determinants of health. Lancet. 2008;372:1661–9. doi: 10.1016/S0140-6736(08)61690-6. [DOI] [PubMed] [Google Scholar]
- 29.Navarro V, Muntaner C, Borrell C, et al. Politics and health outcomes. Lancet. 2006;368:1033–7. doi: 10.1016/S0140-6736(06)69341-0. [DOI] [PubMed] [Google Scholar]
- 30.Taylor-Gooby P, Stoker G. The coalition programme: a new vision for Britain or politics as usual. Polit Quart. 2011;82:4–15. [Google Scholar]
- 31.McCormack C. Glasgow: Argyll Publishing; 2009. The Wee Yellow Butterfly. [Google Scholar]
- 32.Bell I. Still suffering Thatcher's legacy 30 years on. The Herald. May 2, 2009. [Google Scholar]
- 33.MacWhirter I. That bloody woman. New Statesman. March 2, 2009. [Google Scholar]
Associated Data
This section collects any data citations, data availability statements, or supplementary materials included in this article.


