Abstract
Considering information in the crystal structures of the cytochrome b6f complex relevant to the rate-limiting step in oxygenic photosynthesis (1–5), it is enigmatic that electron transport in the complex is not limited by the large distance, approximately 26 Å, between the iron-sulfur cluster (ISP) and its electron acceptor, cytochrome f. This enigma has been explained for the respiratory bc1 complex by a crystal structure with a greatly shortened cluster-heme c1 distance (6), leading to a concept of ISP dynamics in which the ISP soluble domain undergoes a translation-rotation conformation change and oscillates between positions relatively close to the cyt c1 heme and a membrane-proximal position close to the ubiquinol electron-proton donor. Comparison of cytochrome b6f structures shows a variation in cytochrome f heme position that suggests the possibility of flexibility and motion of the extended cytochrome f structure that could entail a transient decrease in cluster-heme f distance. The dependence of cyt f turnover on lumen viscosity (7) is consistent with a role of ISP - cyt f dynamics in determination of the rate-limiting step under conditions of low light intensity.
Under conditions of low light intensity and proton electrochemical gradient present, for example, under a leaf canopy, it is proposed that a rate limitation of electron transport in the b6f complex may also arise from steric constraints in the entry/exit portal for passage of the plastoquinol and -quinone to/from its oxidation site proximal to the iron-sulfur cluster.
Keywords: not in title: cytochrome bc1 complex, oxygenic photosynthesis, plastoquinone
I. Background
A. Rate limitations of oxygenic photosynthesis
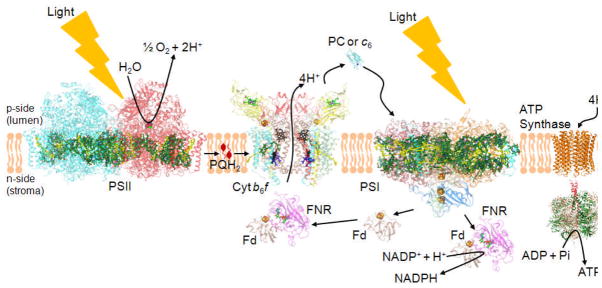
The rate of oxygenic photosynthesis can be limited by: (a) incident light intensity; the productive spectral region of the incident solar energy is defined by the absorbance spectrum of the light-harvesting pigments (8–10) modulated by photo-protection including non-photochemical quenching (11–13). (b) Under conditions of high light intensity, the trans-membrane proton electrochemical potential gradient, Δμ̃H+, and phosphorylation potential limit photosynthetic electron transport (14). (c) The rate of CO2 fixation can be limiting when the light intensity is saturating (15). The limitation is dependent on the turnover of RuBP and optimization of productive carbon fixation versus competing photorespiration (16). However, CO2 levels that were 315 and 390 μmol-mol−1 in the years 1960 and 2009, have been projected to be 550 and 800 μmol-mol−1, respectively, in 2050 and 2100 (17). Thus, in the presence of high CO2 levels, such as those extrapolated for the near future, and under limiting illumination such as that present in the lower layers of a leaf canopy (18), the rate-limiting step (5–10 msec) of the oxygenic photosynthetic electron transport chain (Fig. 1) is located in the charge transfer reactions of the 240 kDa cytochrome b6f complex, which mediates electron transfer and proton translocation between the photosystem II (water-splitting) and photosystem I (NADP+ reducing) reaction center complexes. This is simply shown by the effect of phosphorylation potential on the rate of reduction of cytochrome f (19, 20). The characteristic time for the rate-limiting step is similar to a mean passage time, approximately 8 msec, calculated for diffusion of ubiquinone through the LH1 ring that surrounds the bacterial photosynthetic reaction center (21). The time scale of the terminal (S4) step in the S-state transitions involved in H2O-splitting and oxygen evolution is approximately an order of magnitude shorter (22).
Figure 1. The electron transport chain of oxygenic photosynthesis.
Formation of the trans-membrane Δμ̃H+, by the linear electron transport chain, which extends from the H2O oxidation site to that for reduction of NADP+, by H+ translocation in the PSII reaction center and cytochrome b6f complex is shown, along with the utilization of this gradient by the ATP synthase. The rate-limitation in the linear ETC is associated with the oxidation of plastoquinol (PQH2; see PQ in lipid bilayer) by the b6f complex, which involves the structure-based entry/exit of the quinol-quinone to/from the [2Fe-2S] cluster of the iron-sulfur protein, and electron/proton transfer from the quinol to the cluster. Cyt b6f (PDB ID 2E74), cytochrome b6f; Fd (PDB ID 1EWY), ferredoxin; FNR (PDB ID 1EWY), ferredoxin-NADP+-reductase; PC (PDB ID 2Q5B), plastocyanin; PSII (PDB ID 3ARC) and PSI (PDB ID 1JB0), photosynthetic reaction center complexes.
B. Structure-Function of the Cytochrome b6f Complex
Crystal structures that define the structure elements in cytochrome b6f complexes which could limit the rate of electron transfer have been obtained from cyanobacteria (1, 23, 4, 5), Mastigocladus laminosus and Nostoc sp PCC 7120, and from the green alga, Chlamydomonas reinhardtii (2). A summary of references to many crystal structures of the respiratory and bacterial photosynthetic cytochrome bc1 complex, whose integral core is very similar to that of the b6f complex, is found in (24).
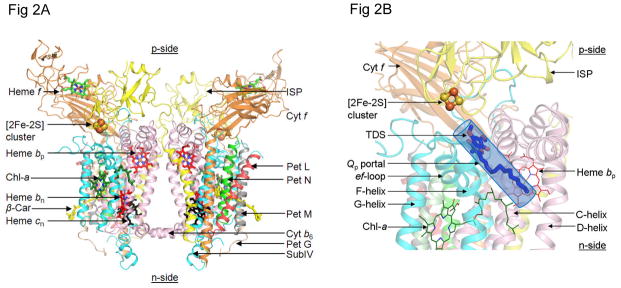
The thirteen trans-membrane helices and eight subunits of the b6f complex, a hetero-oligomeric integral membrane protein complex that functions, along with cytochrome bc1 complexes, as a symmetric dimer, are described in Fig. 2A. The molecular weights and redox potentials of the five redox prosthetic groups, heme f, the Rieske [2Fe-2S] cluster, hemes bp and bn on the electrochemically positive and negative sides of the complex, and heme cn, are summarized (Tables 1A, B).
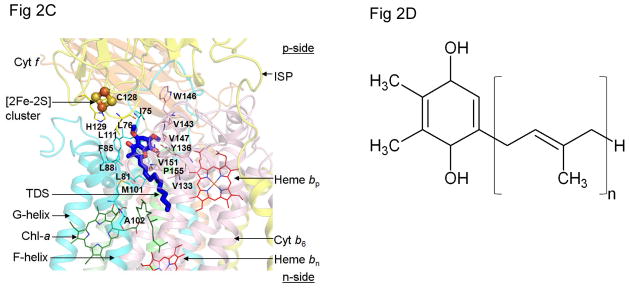
Figure 2.
(A) Crystal structure of dimeric cytochrome b6f complex from the cyanobacterium, M. laminosus [(4) (PDB ID 2E74)], drawn in ribbon format, showing the eight subunits of the complex and five redox prosthetic groups, hemes f, bp, bn, the unique heme cn (59, 60) and the [2Fe-2S] cluster present in each monomer. The two other prosthetic groups in each monomer, are a single chlorophyll a molecule ligated to two H2O molecules (4) and, separated by a distance of 14 Å in each monomer, a single β-carotene molecule (61, 1, 2). Color code: cytochrome f TMH (orange), cytochrome b6 (pink), Iron-Sulfur protein (yellow), subunit IV (cyan), small subunits with single TMH are PetG (wheat), PetL (red), PetM (gray) and PetN (green). (B) p-side quinol/quinone binding site and 11 × 12 Å p-side entry/exit portal (Qp portal) for plastoquinol/plastoquinone; [2Fe-2S] cluster is shown as orange and yellow spheres, orange for Fe, S for sulfur; (C) Quinone/quinol binding site inferred from the crystal structure obtained in the presence of the p-side quinone-analogue inhibitor, tridecyl-stigmatellin (TDS, blue and red) (4) [n. b., at the high concentrations used for crystallization, the TDS was found to also bind in an n-side quinone-binding niche]. C and D helices belong to cyt b6 (pink) and F and G- helices to subunit IV (cyan). (D) Plastoquinol substrate of cyt b6f; number of isoprenoid groups in extended tail of the plastoquinol molecule, n=9.
Table 1A.
Subunit Composition and Molecular Weight of the Subunit Polypeptides of the Cytochrome b6f Complex of the Cyanobacterium, Mastigocladus laminosus
| Subunit | Molecular Weight (kDa) |
|---|---|
| Cytochrome f (1 heme) | 32.3 |
| Cytochrome b6 (3 hemes) | 24.7 |
| Iron Sulfur Protein [2Fe-2S] | 19.3 |
| Subunit IV | 17.5 |
| Pet G | 4.1 |
| Pet M | 3.8 |
| Pet L | 3.5 |
| Pet N | 3.3 |
Table 1B.
Mid-point reduction-oxidation potentials of cyt b6f prosthetic groups
| Prosthetic Group | Mid-point Redox Potential (Em7, mV) |
|---|---|
| Heme f | +350 to +380 |
| [2Fe-2S] cluster | +300 (pH 6.5) to +320 |
| Heme bp | −50 to −150 |
| Heme bn | −50 |
| Heme cn | +100 |
C. p-Side Electron and Proton Transfer Reactions
Oxidation of the quinol on the p-side of the complex can initiate a “Q cycle” (25, 26) through which 2 protons are observed, under conditions of a small trans-membrane electrochemical potential gradient, to be transferred to the p-side aqueous phase for each electron transferred through the high potential segment of the electron transport chain, to the photosystem I reaction center (27). The p-side reaction of the Q cycle involves either consecutive transfer of the H+ and electron or, because of considerations of redox potential and details of the proton-coupled electron transfer, simultaneous transfer of the electron and proton. For the latter case, the redox reaction is:
The [2Fe-2S] protein is protonated through the histidine imidazole of the His129, which is a ligand to the [2Fe-2S] cluster, as seen in the crystal structures of the complex (1–5). The second proton from the reduced quinol, which is associated with the PQ semiquinone, PQH•, is released to the p-side aqueous phase through a different pathway that involves the oxidant-induced reduction (28) of the heme bp (29–32), one of the two bis-histidine coordinated b-hemes in the PetB (cytochrome b) subunit of the b6f complex. A p-side ubisemiquinone species has been detected at an abundance of 0.01–0.10 per bc1 complex from the photosynthetic bacterium, Rb. capsulatus (33). The release of the H+ from the imidazole of the protonated 2Fe-2S protein to the p-side aqueous phase is linked to the reduction of cytochrome f by the iron-sulfur cluster, with an activation energy of 11 ± 1 kcal/mol (34).
Two reactions, charge transfer and conformational change, (a) and (b) below, which are part of the mechanism of the p-side quinol oxidation, or closely coupled to it, have been proposed to determine the rate limitation of overall electron transport in the cytochrome bc1 complex of the purple photosynthetic bacteria or the mitochondrial respiratory chain. Because of the conservation of the core of the cytochrome bc1 and b6f complexes (“bc complexes”) in evolution (35–37, 24), although there are significant differences in the biochemical composition, pathways of electron transport coupled to the complex, and overall structure (24), basic mechanisms of energy transduction that are valid in the cytochrome bc1 complexes should also apply to the b6f complex.
II. The Rate-Limiting Step in Electron Transfer: Structure Aspects (1–3)
1
Under conditions of high light intensity and large Δμ̃H+, there is consensus that the coupling of the redox-coupled trans-membrane proton transfer to the p-side aqueous phase limits the rate of electron transfer through the cytochrome bc complexes. In the purple photosynthetic bacterium, Rb. sphaeroides, it has been proposed that the rate-limitation resides in transfer to the iron-sulfur protein of an electron and a proton from ubiquinol, proceeding by a mechanism of proton-coupled electron transfer (38–42). This can be observed through the kinetics of the post-flash reduction of cytochrome f or c1, respectively, after an oxidizing light flash administered to chloroplasts (34) or chromatophores of a photosynthetic purple bacterium such as Rhodobacter sphaeroides. Based on studies of the latter photosynthetic system, it has been proposed that the rate-limiting step is the proton-coupled electron transfer (43) from ubiquinol, UQH2, associated with its oxidation and deprotonation to the neutral semiquinone, QH•, by the [2Fe-2S] iron sulfur protein (44).
2. Conformational Changes; ISP and Cytochrome f
In the presence of low intensity illumination and/or small Δμ̃H+, from structure considerations alone, the 26 Å distance measured between the [2Fe-2S] cluster and the heme of cytochrome f in the b6f crystal structures (1, 2, 4, 5) (Table 2) would seem to impose a major barrier to electron transfer (45–47), as was recognized in the context of the first crystal structure of the bc1 complex (48). This rate-distance problem was subsequently solved from a crystal structure of the avian mitochondrial bc1 complex that captured crystallographic data in an additional conformational state in which the [2Fe-2S] cluster is sufficiently close (approximately 15 Å) to the heme of cytochrome c1 (6) to allow electron transfer at least as fast as the msec rate-limiting step. This conformational change, apparently redox-linked, involving a 15 Å translation and 60° rotation of the soluble domain of the ISP, provided an answer to the problem of achieving electron transfer from the [2Fe-2S] cluster of the ISP to the cytochrome c1 heme on a physiologically competent millisecond time scale.
Table 2.
Distances between the [2Fe-2S] Cluster and the Cytochrome f Heme
| PDB ID | 2ZT9 | 2E74 | 2E76 | 1Q90 |
|---|---|---|---|---|
| Source | 7120 | M. l. | M. l. | C. r |
| dmin (Å) | 3.0 | 3.0 | 3.4 | 3.1 |
| Qp ligand | -- | -- | TDS | TDS |
| Heme f-[2Fe-2S] cluster (Å) | 25.9 | 25.9 | 27.2 | 27.0 |
| [2Fe-2S] cluster- Heme bp (Å) | 23.6 | 24.4 | 21.6 | 21.9 |
PDB accession codes for crystal structures of the b6f complex are 2ZT9 (native Nostoc sp. PCC 7120), 2E74 (native M. laminosus), 2E76 (M. laminosus with quinone analogue inhibitor, TDS), and 1Q90 (C. reinhardtii with TDS); dmin, resolution of crystal structure;
Termini in luminal domain of cytochrome f for distance measurements: 2ZT9, heme f-methyl group (atom labeled “CMC”) and heme bp- methyl group (atom labeled “CMD”; for2E74, heme f-methyl group (atom labeled “CMC”) and heme bp- methyl group (atom labeled “CMA”); 2E76, heme f- vinyl group (atom labeled “CAB”; not terminal carbon) and heme bp- methyl group (atom labeled “CMA”); 1Q90, heme f- methyl group (atom labeled “CMC”) and heme bp- methyl group (atom labeled “CMD”).
Caveat
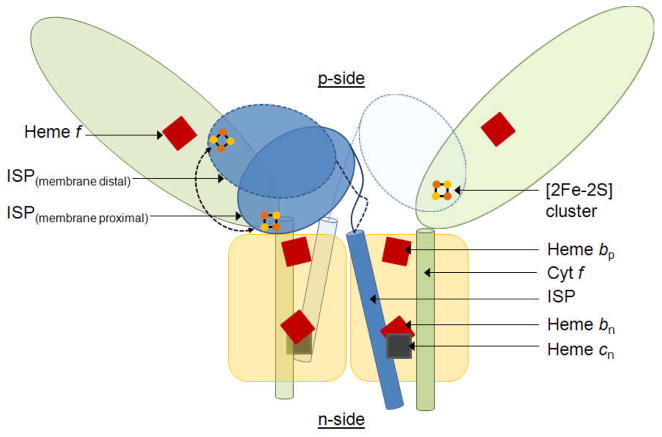
This heme-cluster proximal state has not yet been observed for the photosynthetic bacterial bc1 complex (49), nor for the b6f complex (1–5). On the one hand, the dependence of cyt f turnover on lumen viscosity (7) is consistent with such a dynamic function of the iron-sulfur protein. A model for this motion and dynamic function of the ISP alone is shown (Fig. 3). However, It has been noted (1) that the major differences in structure between the approximately globular cytochrome c1 structure and that of the elongate cytochrome f (50) (Fig. 3) preclude the existence in the b6f complex of the 15 Å translation−60° rotation for the soluble ISP domain that has been determined crystallographically for the avian bc1 complex (6). This inference is consistent with studies (51) that found the function of the b6f complex to be insensitive to changes in the ISP “hinge” region connecting the soluble domain and its trans-membrane helix that theoretically decreased the flexibility of the hinge by substitutions of 4–6 Pro residues, or altered it by hinge shortening or elongation by insertion of 4 residues. The latter change increased sensitivity to Qp inhibitors, whereas deletion of 2 residues resulted in a loss of inhibitor sensitivity and a decrease in activity, indicating a minimum hinge length of 7 residues required for optimum binding of ISP at the Qp site. Thus, in contrast to the bc1 complex, the function of the b6f complex was relatively insensitive to sequence changes in the ISP hinge that altered its length or flexibility. This implies that either the barriers to motion are larger or the amplitude of ISP motion required for function is smaller than in the cytochrome bc1 complex (51). These results on the requirement for flexibility of the inter-monomer loop of the ISP imply that the amplitude of the motion of the ISP soluble domain is smaller in the b6f complex than in bc1. On the other hand, although deletion of one residue and extensions of up to five residues in the flexible hinge had no significant effect on complex accumulation or electron transfer efficiency, deletion of 3 glycine residues dramatically decreased reaction rates by a factor of approximately ten (52).
Fig. 3.
Motion of ISP soluble domain required for productive electron transfer in the cytochrome b6f complex. Crystal structures of the cyt b6f complex show the [2Fe-2S] cluster of the ISP soluble domain at a distance of 25.9 Å – 27.2 Å from heme f (Table 3) in a membrane proximal position. Electron transfer cannot proceed at a millisecond time scale over such a large distance. The ISP soluble domain, and possibly the luminal domain of cytochrome f as well, must undergo a motion to position the [2Fe-2S] cluster in proximity (16–18 Å) to heme f in a membrane distal position. Color scheme: Cyt f, light green; ISP, blue; Cyt b6, subIV, Pet G, L, M, N, yellow; Hemes f, bp, bn, red; heme cn, gray; [2Fe-2S] cluster, brown-yellow.
Bridging the gap: conformational change of cytochrome f
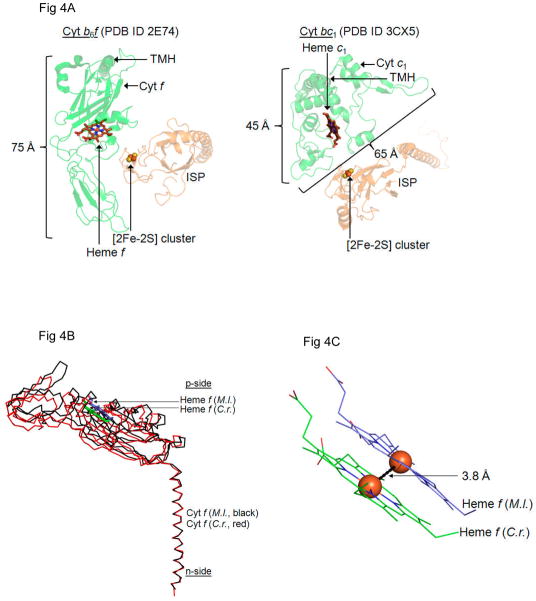
The cytochrome f soluble domain consists of a 75 Å long extended β sheet structure (50, 53), very different from the approximately globular soluble domain of cyt c1 (Fig. 4A), utilizing the structure of cyt b6f from M. laminosus (PDB 2E74) and cyt bc1 from yeast (PDB 3CX5). In this restricted space, the b6f ISP soluble domain has less conformational freedom than does in the cyt bc1 complex. Hence, the b6f ISP may undergo motion on a smaller scale as demonstrated by the relative insensitivity of the ISP hinge to mutations that restrict mobility, discussed above (51, 52). For competent electron transfer from the [2Fe-2S] cluster to the cyt f heme, the cluster-heme f distance must be no longer than 16 Å – 18 Å (45–47). Based on the small but resolved 4 Å difference in position of the cyt f heme between the b6f crystal structure from M. laminosus (black, PDB 2E74) and that of C. reinhardtii (red, PDB 1Q90), with the construct made by superimposing the trans-membrane helices, it is proposed that this involves a conformational change of the cyt f soluble domain as seen in the comparison of the extrinsic domains of cyt f structures (Fig. 4B, C). It is recognized that the conformational change of the cyt f soluble domain shown here is much smaller than required to bridge the heme-cluster distance seen in the crystal structures. Of course, the amplitude of changes in conformation of the cyt f soluble domain that can be seen in crystal structures is limited by the major role of this domain in crystal contacts. Other information in the literature that is relevant to the question of conformation changes of the cyt f soluble domain is seen in differences in the heme orientation in oriented membranes, determined by EPR to be approximately 25° (54) – 30° (55), and by linear dichroism to be approximately 50° (56).
Fig. 4.
Structures of cytochrome f with a displaced heme position. (A) The cyt f soluble domain (left) consists of a 75 Å long extended β sheet structure which is larger than the cyt c1 soluble domain (right). In this restricted space, the cyt b6f ISP soluble domain does not have the same conformational freedom as the cyt bc1 ISP soluble domain. Hence, the ISP of cyt b6f may undergo motion on a smaller scale as demonstrated by the relative insensitivity of the ISP hinge to mutations that restrict mobility (51). (B) For physiologically relevant electron transfer from the [2Fe-2S] cluster of the ISP soluble domain to heme f in cyt b6f, the [2Fe-2S] cluster-heme f distance must be 16 Å – 18 Å. This may involve a small scale movement of the cyt f soluble domain as seen between the cyt b6f crystal structures obtained from M. laminosus (PDB ID 2E74, black) and C. reinhardtii (PDB ID 1Q90, red). Structural superposition performed in PyMol between conserved residues of the cyt f trans-membrane helix (PDB ID 2E74, chain D, residues 258–277; PDB ID 1Q90, chain A, residues 255–274) using a Cα pair fitting algorithm (RMSD=0.84 Å). (C) In the superposed structure of cyt f from M. laminosus and C. reinhardtii, the heme f Fe atoms are separated by 3.8 Å. (M. l., Mastigocladus laminosus, C. r. Chlamydomonas reinhardtii).
3. Rate-limiting step; steric considerations in quinol oxidation-reduction
A second set of molecular events for which the crystal structure of the b6f complex suggests a kinetic limitation under conditions of low light intensity and/or small Δμ̃H+ is the oxidation of the bulky lipophilic quinol that is proposed (24), based on structure data (ribbon diagram, Fig. 2A). To reach its oxidation site at the [2Fe-2S] cluster, the quinol must be transferred from the inter-monomer cavity between the two monomers through a narrow portal to a position within H-bond distance of the His129 imidazole ligand to the [2Fe-2S] cluster (Fe, orange, sulfur atoms yellow). Fig. 2B shows the position of the p-side quinone analogue inhibitor, tridecyl-stigmatellin, as defined in the crystal structure of the complex from M. laminosus (4). The portal is defined by two TMH of the b6f complex: the F trans-membrane helix of subunit IV (subIV) and the C-TMH of the cyt b polypeptide. Fig. 2C shows the amino acids, almost all hydrophobic, with many valines, which line the portal. The role of this portal in restricting the rate of entry and exit of the quinol/quinone to/from the [2Fe-2S] cluster and thereby establishing a rate-limiting step in the electron transport chain can be tested.
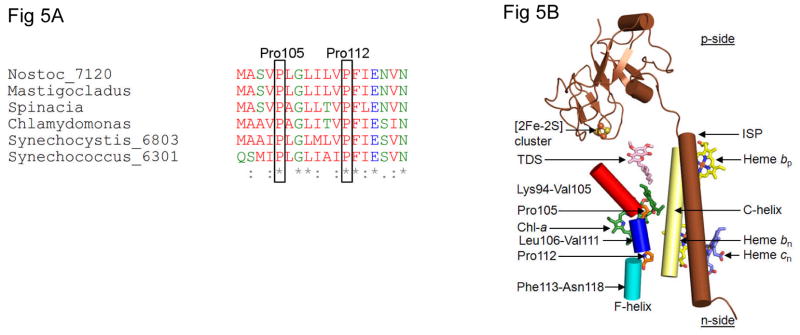
Quinol/quinone (QH2/Q) entry/exit through the p-side portal shown in Figs. 2B, C, which would occur twice in each turnover of the Q-cycle (57, 26), is hypothesized to contribute to rate limitation in the linear electron (H2O → NADP+) transport chain, depending upon the intensity of illumination and CO2 concentration. This is a consequence of the steric problems associated with passage of the large quinol (Fig. 2D) through this narrow portal (Figs. 2B, C). T he structure of the b6f complex. e. g., from the cyanobacterium, M. laminosus (4) (Figs. 2A–C), suggests a limitation on the rate of oxidation of plastoquinol by the [2Fe-2S] cluster that is linked to the entry/exit of the lipophilic quinol/quinone from/to the inter-monomer cavity through a narrow (11–12 Å) portal leading to the [2Fe-2S] cluster. The site of plastoquinol oxidation (Qp site) lies at the end of the narrow portal formed by trans-membrane helix C of the cyt b6 subunit and the F-helix of subunit IV. Two conserved prolines (Figs. 5A, B) are on the p-side of the subunit IV F-helix. These two residues lie on the same side of the helix, proximal to the C-helix (Figs. 5B, 6A). The two prolines cause a bend in the F-helix, away from the C-helix, thereby contributing to the size of the portal that leads into the Qp site for electron/proton donation to the Rieske iron-sulfur protein and, ultimately, to proton donation to the p-side aqueous phase.
Figure 5.
The p-side quinone entry/exit portal. (A) Amino acid sequences of segment of F-helix of subunit IV of cytochrome b6f complex showing conservation of proline residues at positions 105 and 112. (B) Schematic of trans-membrane F- and C-helices that define the p-side entry/exit portal for plastoquinol-plastoquinone transfer proximal to [2Fe-2S] cluster in the b6f complex. Two proline residues, 105 and 112, cause a “bent” conformation of the wild-type trans-membrane F-helix of subunit IV relative to the trans-membrane C-helix of the cyt b subunit.
Figure 6.
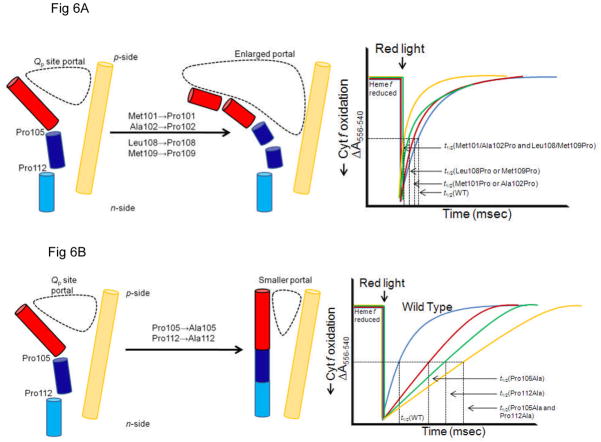
Anticipated effects on the time course of cytochrome f reduction, measured by the absorbance change at 556 nm, the alpha-band peak of the ‘reduced-oxidized’ difference spectrum vs. 540 nm as a reference of the different genetic constructs that are predicted to change the size of the PQH2/PQ portal and thereby the rate-limiting step in the linear electron transport chain that can be assayed by the time course of cytochrome f reduction. (A) Introduction of additional proline residues designed to increase the portal size would increase the rate, i. e., decrease the half-time, of cyt f reduction, as seen in the trend from the blue → red → green → yellow traces that describe the time course of reduction after cytochrome f is oxidized by the red (μsec) light flash. (B) Change of Pro105 and Pro112 to Ala would cause a decrease in the rate of cyt f reduction (red, green traces) relative to the wild type (blue), with the effect predicted to be greater if both Pro→Ala changes are made (yellow trace).
Testing a Putative Rate-Limiting Step; the Quinone Portal
The role of the p-side portal in the rate limitation of the linear electron transport chain can be tested by mutagenesis of the F-helix, measurement of the effect on quinol oxidation by flash kinetic spectroscopy and, if a particular mutational change is implicated by kinetic measurements, purification crystallization, and crystal structure analysis of the mutant b6f complex. It is proposed that introduction of additional proline residues via substitution mutations of other residues that lie on side of the F-helix facing the C-helix would bend the F-helix further away from the C-helix and thus enlarge the Qp site portal (Fig. 6A (left)). Proline residues 105 and 112, which are conserved residues (see arrows, Fig. 5A) define positions of kinks in this helix that result in a change in the aperture of the portal. It is proposed to use site-directed mutagenesis to change the size of this quinol/quinone portal/ channel, in which the quinone (marked by the quinone analog tridecyl-stigmatellin) is shown proximal to the [2Fe-2S] cluster (Fig. 5B), by mutagenesis of residues in the F-helix of subunit IV.
Changes of portal size resulting from mutagenesis of F-helix
It is predicted from the structure considerations that the size of the Q-portal would be (i) increased by inserting additional Pro residues into the F-helix (Fig. 6A, left panel), and (b) decreased by changing the Pro105 and or Pro112 to a small residue (e.g., Ala) that removes the proline induced bending of the F-helix (Fig. 6B, left panel). The effect of these mutations can be assayed by measurement of the rate of cytochrome f reduction after a light flash that oxidizes the cytochrome, shown respectively, in Figs. 6A and B, right panel.
Flexibility of the F-helix
The above mutagenesis strategy assumes that the changes in the degree of bending of the F-helix will not be disruptive to the structure. The basis for this assumption is information on the natural flexibility of the F-helix, as displayed in the comparison of atomic B-factors, compared with those of neighboring trans-membrane helices of subunit IV and the cytochrome b polypeptide. B-factors, determined from crystal structures of the cyanobacterial b6f complex (4, 5), are a measure of local flexibility in the structure (58); the larger the B-factor, the greater the disorder. It can be seen in the comparison of segments of the trans-membrane helices of the cytochrome b subunit (Table 3A) and subunit IV (Table 3B) that the F- and G-helices are more flexible (B-factor, 58–63 Å2) than the more buried A-, B-, C-, and D-helical segments of the cytochrome b subunit and the more buried E-helix of subunit IV.
Table 3.
Backbone B-factors (in Å2, (58)) and helical spans in the crystal structure of b6f complex from the cyanobacterium, M. laminosus (PDB 2E74).
| A. Cytochrome b6 | B. SubIV: |
|---|---|
| A-helix: Tyr34-Tyr58; 36 Å2 | E-helix: Tyr38-Asp58; 42 Å2; |
| B-helix:Trp80-Tyr105; 40 Å2 | F-helix: Leu95-Asn118; 58 Å2; |
| C-helix: Glu115-Tyr136; 38 Å2 | G-helix: Pro127-Phe149; 63 Å2 |
| D-helix: Tyr183-Ile206; 33 Å2 |
Acknowledgments
These studies have been supported by a grant from NIH Institute of General Medical Sciences GM-038323. We thank E. Yamashita, F. Daldal, A. Osyczka, and B. L. Trumpower for helpful discussions.
Abbreviations
- bn.Qn and bp, Qp, b-hemes
quinone/ol on electrochemically negative (n) or positive (p) sides of the membrane, corresponding to stromal and luminal sides of the membrane
- cyt
cytochrome
- ET
electron transport
- ISP
iron-sulfur protein
- PDB
protein data bank
- PQ
plastoquinone
- PQ•
anionic plasto-semiquinone
- PQH2
plastoquinol
- RuBP
ribulose-1,5-bis-phosphate carboxylase-oxygenase
- SubIV
subunit IV
- TDS
tridecyl-stigmatellin
- TMH
trans-membrane α-helix
- Δμ̃H+
trans-membrane electrochemical proton gradient
Bibliography and Literature Cited
- 1.Kurisu G, Zhang H, Smith JL, Cramer WA. Structure of the cytochrome b6f complex of oxygenic photosynthesis: tuning the cavity. Science (New York, NY. 2003;302:1009–1014. doi: 10.1126/science.1090165. [DOI] [PubMed] [Google Scholar]
- 2.Stroebel D, Choquet Y, Popot J-L, Picot D. An atypical heam in the cytochrome b6f complex. Nature. 2003;426:413–418. doi: 10.1038/nature02155. [DOI] [PubMed] [Google Scholar]
- 3.Yan J, Kurisu G, Cramer WA. Intraprotein transfer of the quinone analogue inhibitor 2,5-dibromo-3-methyl-6-isopropyl-p-benzoquinone in the cytochrome b6f complex. Proceedings of the National Academy of Sciences of the United States of America. 2006;103:69–74. doi: 10.1073/pnas.0504909102. [DOI] [PMC free article] [PubMed] [Google Scholar]
- 4.Yamashita E, Zhang H, Cramer WA. Structure of the cytochrome b6f complex: quinone analogue inhibitors as ligands of heme cn. J Mol Biol. 2007;370:39–52. doi: 10.1016/j.jmb.2007.04.011. [DOI] [PMC free article] [PubMed] [Google Scholar]
- 5.Baniulis D, Yamashita E, Whitelegge JP, Zatsman AI, Hendrich MP, Hasan SS, Ryan CM, Cramer WA. Structure-Function, Stability, and Chemical Modification of the Cyanobacterial Cytochrome b6f Complex from Nostoc sp. PCC 7120. J Biol Chem. 2009;284:9861–9869. doi: 10.1074/jbc.M809196200. [DOI] [PMC free article] [PubMed] [Google Scholar]
- 6.Zhang Z, Huang L, Shulmeister VM, Chi YI, Kim KK, Hung LW, Crofts AR, Berry EA, Kim SH. Electron transfer by domain movement in cytochrome bc1. Nature. 1998;392:677–684. doi: 10.1038/33612. [DOI] [PubMed] [Google Scholar]
- 7.Heimann S, Ponamarev MV, Cramer WA. Movement of the Rieske iron-sulfur protein in the p-slide bulk aqueous phase: Effect of lumenal viscosity on redox reactions of the cytochrome b(6)f complex. Biochemistry-Us. 2000;39:2692–2699. doi: 10.1021/bi9921992. [DOI] [PubMed] [Google Scholar]
- 8.Blankenship RE, Tiede DM, Barber J, Brudvig GW, Fleming G, Ghirardi M, Gunner MR, Junge W, Kramer DM, Melis A, Moore TA, Moser CC, Nocera DG, Nozik AJ, Ort DR, Parson WW, Prince RC, Sayre RT. Comparing photosynthetic and photovoltaic efficiencies and recognizing the potential for improvement. Science (New York, NY. 2011;332:805–809. doi: 10.1126/science.1200165. [DOI] [PubMed] [Google Scholar]
- 9.Chen M, Blankenship RE. Expanding the solar spectrum used by photosynthesis. Trends Plant Sci. 2011;16:427–431. doi: 10.1016/j.tplants.2011.03.011. [DOI] [PubMed] [Google Scholar]
- 10.Mielke SP, Kiang NY, Blankenship RE, Gunner MR, Mauzerall D. Efficiency of photosynthesis in a Chl d-utilizing cyanobacterium is comparable to or higher than that in Chl a-utilizing oxygenic species. Biochimica et biophysica acta1. 2011;807:1231–1236. doi: 10.1016/j.bbabio.2011.06.007. [DOI] [PubMed] [Google Scholar]
- 11.Kiss AZ, Ruban AV, Horton P. The PsbS protein controls the organization of the photosystem II antenna in higher plant thylakoid membranes. The Journal of biological chemistry. 2008;283:3972–3978. doi: 10.1074/jbc.M707410200. [DOI] [PubMed] [Google Scholar]
- 12.Gorbunov MY, Kuzminov FI, Fadeev VV, Kim JD, Falkowski PG. A kinetic model of non-photochemical quenching in cyanobacteria. Biochimica et biophysica acta. 2011;1807:1591–1599. doi: 10.1016/j.bbabio.2011.08.009. [DOI] [PubMed] [Google Scholar]
- 13.Murchie EH, Niyogi KK. Manipulation of photoprotection to improve plant photosynthesis. Plant physiology. 2011;155:86–92. doi: 10.1104/pp.110.168831. [DOI] [PMC free article] [PubMed] [Google Scholar]
- 14.Mitchell P. Chemiosmotic coupling in oxidative and photosynthetic phosphorylation. Biol Rev. 1966;41:445–502. doi: 10.1111/j.1469-185x.1966.tb01501.x. [DOI] [PubMed] [Google Scholar]
- 15.Sukenik A, Bennett J, Mortain-Bertrand A, Falkowski PG. Adaptation of the Photosynthetic Apparatus to Irradiance in Dunaliella tertiolecta: A Kinetic Study. Plant physiology. 1990;92:891–898. doi: 10.1104/pp.92.4.891. [DOI] [PMC free article] [PubMed] [Google Scholar]
- 16.Zhu XG, Long SP, Ort DR. Improving photosynthetic efficiency for greater yield. Annu Rev Plant Biol. 2010;61:235–261. doi: 10.1146/annurev-arplant-042809-112206. [DOI] [PubMed] [Google Scholar]
- 17.Long SP, Ort DR. More than taking the heat: crops and global change. Curr Opin Plant Biol. 2010;13:241–248. doi: 10.1016/j.pbi.2010.04.008. [DOI] [PubMed] [Google Scholar]
- 18.Zhu XG, Ort DR, Whitmarsh J, Long SP. The slow reversibility of photosystem II thermal energy dissipation on transfer from high to low light may cause large losses in carbon gain by crop canopies: a theoretical analysis. J Exp Bot. 2004;55:1167–1175. doi: 10.1093/jxb/erh141. [DOI] [PubMed] [Google Scholar]
- 19.Avron M, Chance B. Relation of phosphorylation to electron transport in isolated chloroplasts. Brookhaven Symp Biol. 1966;19:149–160. [PubMed] [Google Scholar]
- 20.Bohme H, Cramer WA. Localization of a site of energy coupling between plastoquinone and cytochrome f in the electron-transport chain of spinach chloroplasts. Biochemistry-Us. 1972;11:1155–1160. doi: 10.1021/bi00757a007. [DOI] [PubMed] [Google Scholar]
- 21.Aird A, Wrachtrup J, Schulten K, Tietz C. Possible pathway for ubiquinone shuttling in Rhodospirillum rubrum revealed bymolecular dynamics simulation. Biophys J. 2007;92:23–33. doi: 10.1529/biophysj.106.084715. [DOI] [PMC free article] [PubMed] [Google Scholar]
- 22.Haumann M, Liebisch P, Muller C, Barra M, Grabolle M, Dau H. Photosynthetic O2 formation tracked by time-resolved x-ray experiments. Science (New York, NY3. 2005;10:1019–1021. doi: 10.1126/science.1117551. [DOI] [PubMed] [Google Scholar]
- 23.Yan J, Kurisu G, Cramer WA. Structure of the cytochrome b6f complex: Binding site and intraprotein transfer of the quinone analogue inhibitor 2,5-dibromo-3-methyl-6-isopropyl-p-benzoquinone. Proc Nat Acad Sci USA. 2006;103:67–74. doi: 10.1073/pnas.0504909102. [DOI] [PMC free article] [PubMed] [Google Scholar]
- 24.Cramer WA, Yamashita E, Hasan SS. The Q cycle of cytochrome bc complexes: a structure perspective. Biochim Biophys Acta/Bioenergetics. 2011;1807:788–802. doi: 10.1016/j.bbabio.2011.02.006. [DOI] [PMC free article] [PubMed] [Google Scholar]
- 25.Mitchell P. Possible molecular mechanisms of the protonmotive function of cytochrome systems. J Theor Biol. 1976;62:327–367. doi: 10.1016/0022-5193(76)90124-7. [DOI] [PubMed] [Google Scholar]
- 26.Crofts AR. The cytochrome bc1 complex: Function in the context of structure. Ann Rev Physiol. 2004;66:689–733. doi: 10.1146/annurev.physiol.66.032102.150251. [DOI] [PubMed] [Google Scholar]
- 27.Graan T, Ort DR. Initial events in the regulation of electron transfer in chloroplasts. J Biol Chem. 1983;258:2831–2836. [PubMed] [Google Scholar]
- 28.Wikström MKF, Berden JA. Oxido-reduction of cytochrome b in the presence of antimycin. Biochim Biophys Acta. 1972;283:403–420. doi: 10.1016/0005-2728(72)90258-7. [DOI] [PubMed] [Google Scholar]
- 29.Girvin ME, Cramer WA. A redox study of the electron transport pathway responsible for generation of the slow electrochromic phase in chloroplasts. Biochim Biophys Acta. 1984;767:29–38. doi: 10.1016/0005-2728(84)90076-8. [DOI] [PubMed] [Google Scholar]
- 30.Joliot P, Joliot A. The low-potential electron-transfer chain in the cytochrome bf complex. Biochim Biophys Acta. 1988;933:319–333. [Google Scholar]
- 31.Furbacher PN, Girvin ME, Cramer WA. On the question of interheme electron transfer in the chloroplast cytochrome b6 in situ. Biochemistry-Us. 1989;28:8990–8998. doi: 10.1021/bi00449a006. [DOI] [PubMed] [Google Scholar]
- 32.Crofts AR, Hong SJ, Ugulava N, Barquera B, Gennis R, Guergova-Kuras M, Berry EA. Pathways for proton release during ubihydroquinone oxidation by the bc1complex. Proc Nat Acad Sci USA. 1999;96:10021–10026. doi: 10.1073/pnas.96.18.10021. [DOI] [PMC free article] [PubMed] [Google Scholar]
- 33.Cape JL, Bowman MK, Kramer DM. A semiquinone intermediate generated at the Qo site of the cytochrome bc1 complex: importance for the Q-cycle and superoxide production. Proc Nat Acad Sci USA. 2007;104:7887–7892. doi: 10.1073/pnas.0702621104. [DOI] [PMC free article] [PubMed] [Google Scholar]
- 34.Whitmarsh J, Cramer WA. Cytochrome f function in photosynthetic electron transport. Biophysical journal. 1979;26:223–234. doi: 10.1016/S0006-3495(79)85246-7. [DOI] [PMC free article] [PubMed] [Google Scholar]
- 35.Widger WR, Cramer WA, Herrmann RG, Trebst A. Sequence homology and structural similarity between the b cytochrome of mitochondrial complex III and the chloroplast b6f complex: position of the cytochrome b hemes in the membrane. Proc Natl Acad Sci, U S A. 1984;81:674–678. doi: 10.1073/pnas.81.3.674. [DOI] [PMC free article] [PubMed] [Google Scholar]
- 36.Furbacher PN, Tae G-S, Cramer WA. Evolution and origins of cytochrome bc1 and b6f complexes. In: Baltscheffsky H, editor. Origin and Evolution of Biological Energy Conversion. VCH Publishers; New York: 1996. pp. 221–253. [Google Scholar]
- 37.Schutz M, Brugna M, Lebrun E, Baymann F, Huber R, Stetter KO, Hauska G, Toci R, Lemesle-Meunier D, Tron P, Schmidt C, Nitschke W. Early evolution of cytochrome bc complexes. J Mol Biol. 2000;300:663–675. doi: 10.1006/jmbi.2000.3915. [DOI] [PubMed] [Google Scholar]
- 38.Crofts AR, Wang Z. How rapid are the internal reactions of the ubiquinol: cytochrome c2 oxidoreductase? Photosynthesis research. 1989;22:69–87. doi: 10.1007/BF00114768. [DOI] [PubMed] [Google Scholar]
- 39.Denke E, Merbitz-Zahradnik T, Hatzfeld OM, Snyder CH, Link TA, Trumpower BL. Alteration of the midpoint potential and catalytic activity of the Rieske iron-sulfur protein by changes of amino acids forming hydrogen bonds to the iron-sulfur cluster. Journal of Biological Chemistry. 1998;273:9085–9093. doi: 10.1074/jbc.273.15.9085. [DOI] [PubMed] [Google Scholar]
- 40.Hong SJ, Ugulava N, Guergova-Kuras M, Crofts AR. The energy landscape for ubihydroquinone oxidation at the Q(o) site of the bc(1) complex in Rhodobacter sphaeroides. Journal of Biological Chemistry. 1999;274:33931–33944. doi: 10.1074/jbc.274.48.33931. [DOI] [PubMed] [Google Scholar]
- 41.Guergova-Kuras M, Kuras R, Ugulava N, Hadad I, Crofts AR. Specific mutagenesis of the Rieske iron-sulfur protein in Rhodobacter sphaeroides shows that both the thermodynamic gradient and the pK of the oxidized form determine the rate of quinol oxidation by the bc(1) complex. Biochemistry-Us. 2000;39:7436–7444. doi: 10.1021/bi992491+. [DOI] [PubMed] [Google Scholar]
- 42.Crofts AR, Holland JT, Victoria D, Kolling DR, Dikanov SA, Gilbreth R, Lhee S, Kuras R, Kuras MG. The Q-cycle reviewed: How well does a monomeric mechanism of the bc1 complex account for the function of a dimeric complex? Biochim Biophys Acta. 2008;1777:1001–1019. doi: 10.1016/j.bbabio.2008.04.037. [DOI] [PMC free article] [PubMed] [Google Scholar]
- 43.Cukier RI, Nocera DG. Proton-coupled electron transfer. Annu Rev Phys Chem. 1998;49:337–369. doi: 10.1146/annurev.physchem.49.1.337. [DOI] [PubMed] [Google Scholar]
- 44.Crofts AR. Proton-coupled electron transfer at the Qo-site of the bc1 complex controls the rate of ubihydroquinone oxidation. Biochim Biophys Acta. 2004;1655:77–92. doi: 10.1016/j.bbabio.2003.10.012. [DOI] [PubMed] [Google Scholar]
- 45.Moser CC, Keske JM, Warncke K, Farid RS, Dutton PL. Nature of biological electron transfer. Nature. 1992;355:796–802. doi: 10.1038/355796a0. [DOI] [PubMed] [Google Scholar]
- 46.Beratan DN, Onuchic JN. The protein bridge between redox centers. In: Bendall DS, editor. Protein Electron Transfer. BIOS Scientific Publishers Ltd; Oxford: 1996. pp. 23–42. [Google Scholar]
- 47.Gray HB, Winkler JR. Electron transfer in proteins. Ann Rev Biochem. 1996;65:537–562. doi: 10.1146/annurev.bi.65.070196.002541. [DOI] [PubMed] [Google Scholar]
- 48.Xia D, Yu C-A, Kim H, Xia J-Z, Kachurin AM, Yu L, Deisenhofer J. Crystal structure of the cytochrome bc1 complex from bovine heart mitochondria. Science (New York, NY. 1997;277:60–66. doi: 10.1126/science.277.5322.60. [DOI] [PubMed] [Google Scholar]
- 49.Esser L, Elberry M, Zhou F, Yu CA, Yu L, Xia D. Inhibitor-complexed structures of the cytochrome bc1 from the photosynthetic bacterium Rhodobacter sphaeroides. J Biol Chem. 2008;283:2846–2857. doi: 10.1074/jbc.M708608200. [DOI] [PubMed] [Google Scholar]
- 50.Martinez SE, Huang D, Szczepaniak A, Cramer WA, Smith JL. Crystal structure of the chloroplast cytochrome f reveals a novel cytochrome fold and unexpected heme ligation. Structure. 1994;2:95–105. doi: 10.1016/s0969-2126(00)00012-5. [DOI] [PubMed] [Google Scholar]
- 51.Yan J, Cramer WA. Functional insensitivity of the cytochrome b6f complex to structure changes in the hinge region of the Rieske iron-sulfur protein. The Journal of biological chemistry. 2003;278:20925–20933. doi: 10.1074/jbc.M212616200. [DOI] [PubMed] [Google Scholar]
- 52.de Vitry C, Ouyang Y, Finazzi G, Wollman FA, Kallas T. The chloroplast Rieske iron-sulfur protein. At the crossroad of electron transport and signal transduction. J Biol Chem. 2004;279:44621–44627. doi: 10.1074/jbc.M406955200. [DOI] [PubMed] [Google Scholar]
- 53.Soriano GM, Smith JL, Cramer WA. Cytochrome f. In: Messerschmidt A, Huber R, Wieghardt K, Poulos T, editors. Handbook of Metalloproteins. Wiley; London: 2001. pp. 172–181. [Google Scholar]
- 54.Bergstrom J, Vanngard T. EPR Signals and Orientation of Cytochromes in the Spinach Chloroplast Thylakoid Membrane. Biochimica et Biophysica Acta. 1982;682:452–456. [Google Scholar]
- 55.Crowder MS, Prince RC, Bearden A. Orientation of Membrane-Bound Cytochromes in Chloroplasts, Detected by Low-Temperature Electron-Paramagnetic-Res Spectroscopy. FEBS letters. 1982;144:204–208. [Google Scholar]
- 56.Schoepp B, Chabaud E, Breyton C, Vermeglio A, Popot J-L. On the Spatial Organization of Hemes and Chlorophyll in Cytochrome b6f. Journal of Biological Chemistry. 2000;275:5275–5283. doi: 10.1074/jbc.275.8.5275. [DOI] [PubMed] [Google Scholar]
- 57.Mitchell P. The protonmotive Q cycle: A general formulation. FEBS letters. 1975;59:137–139. doi: 10.1016/0014-5793(75)80359-0. [DOI] [PubMed] [Google Scholar]
- 58.Blow D. Outline of Crystallography for Biologists. Oxford University Press; Oxford, UK: 2002. [Google Scholar]
- 59.Zatsman AI, Zhang H, Gunderson WA, Cramer WA, Hendrich MP. Heme-heme interactions in the cytochrome b6f complex: EPR spectroscopy and correlation with structure. J Amer Chem Soc. 2006;128:14246–14247. doi: 10.1021/ja065798m. [DOI] [PMC free article] [PubMed] [Google Scholar]
- 60.Twigg AI, Baniulis D, Cramer WA, Hendrich MP. EPR detection of an O2 surrogate bound to heme cn of the cytochrome b6f complex. J Am Chem Soc. 2009;131:12536–12537. doi: 10.1021/ja905171c. [DOI] [PMC free article] [PubMed] [Google Scholar]
- 61.Zhang H, Huang D, Cramer WA. Stoichiometrically bound beta-carotene in the cytochrome b6f complex of oxygenic photosynthesis protects against oxygen damage. J Biol Chem. 1999;274:1581–1587. doi: 10.1074/jbc.274.3.1581. [DOI] [PubMed] [Google Scholar]


