Abstract
Perilymph pharmacokinetics was investigated by a novel approach, in which solutions containing drug or marker were injected from a pipette sealed into the perilymphatic space of the lateral semi-circular canal (LSCC). The cochlear aqueduct provides the outlet for fluid flow so this procedure allows almost the entire perilymph to be exchanged. After wait times of up to 4 h the injection pipette was removed and multiple, sequential samples of perilymph were collected from the LSCC. Fluid efflux at this site results from cerebrospinal fluid (CSF) entry into the basal turn of scala tympani (ST) so the samples allow drug levels from different locations in the ear to be defined. This method allows the rate of elimination of substances from the inner ear to be determined more reliably than with other delivery methods in which drug may only be applied to part of the ear. Results were compared for the markers trimethylphenylammonium (TMPA) and fluorescein and for the drug dexamethasone (Dex). For each substance, the concentration in fluid samples showed a progressive decrease as the delay time between injection and sampling was increased. This is consistent with the elimination of substance from the ear with time. The decline with time was slowest for fluorescein, was fastest for Dex, with TMPA at an intermediate rate. Simulations of the experiments showed that elimination occurred more rapidly from scala tympani (ST) than from scala vestibuli (SV). Calculated elimination half-times from ST averaged 54.1, 24.5 and 22.5 min for fluorescein, TMPA and Dex respectively and from SV 1730, 229 and 111 min respectively. The elimination of Dex from ST occurred considerably faster than previously appreciated. These pharmacokinetic parameters provide an important foundation for understanding of drug treatments of the inner ear.
Keywords: cochlea, perilymph, round window, intratympanic drug delivery, TMPA, trimethylphenylammonium, fluorescein, steroids
Introduction
Pharmacokinetics in the ear is dominated by processes represented by the acronym “LADME”, corresponding to drug “L”iberation, “A”bsorption, “D”istribution, “M”etabolism and “E”limination (Salt and Plontke 2009). For the widely used method of intratympanic drug delivery, the most significant processes are: i) The absorption of drug into the inner ear by entry through the round window membrane (Goycoolea et al. 1988; Salt and Ma 2001), via the stapes (King et al 2011; Salt et al. 2012) or entry by other routes (Mikulec et al. 2009); ii) the distribution of drugs from the sites of entry to other fluids and tissues throughout the ear; and iii) the elimination of drug from the ear to the vascular system. The resulting perilymph drug concentration can be regarded as a balance between the rate of influx from the middle ear (absorption) and the rate of loss to the vasculature (elimination), all made much more complex by the influence of drug distribution through the fluid and tissue spaces of the ear. Distribution is a slow process, dominated by passive diffusion that results in sizeable drug gradients along the scalae when substances are applied locally (Mynatt et al. 2006; Plontke et al. 2007, 2008b).
For a specific delivery protocol, the rate of elimination of substances from the cochlea to the blood plays a major role in the amount of drug present in the ear, and where in the ear the drug is distributed. For intratympanic applications, the spread of drug apically becomes less as the elimination rate increases. This is because the drug may be lost to blood faster than it diffuses. For high rates of elimination drugs may never reach the apex in appreciable concentration. Instead, a steady state gradient of drug along scala tympani is established in which drug entering is balanced by loss to blood along the scala. Although the elimination rate for a specific substance is of major importance to define drug spread and levels achieved, the perilymph elimination rate is remarkably difficult to quantify. For most local drug applications drug levels are changing with time as the drug distributes within the compartment and to other compartments of the ear, as well as by elimination to blood, making it difficult to quantify elimination with any accuracy.
There have been numerous pharmacokinetic studies of locally-applied corticosteroids in animals (Nomura 1984; Parnes et al. 1999; Chandrasekhar et al. 2000; Bachmann et al. 2001; Hahn et al. 2006, 2012; Liu et al. 2006; Plontke et al. 2008b; Yang et al. 2008; Wang et al. 2009; Borden et al. 2011; Salt et al. 2011a) and humans (Bird et al 2007; Bird et al. 2011), but only a subset of these studies has been analyzed quantitatively to derive an elimination rate. Plontke and Salt (2003) analyzed prednisoline data of Bachmann et al. (2001) from guinea pigs and found it to be consistent with an elimination half-time from perilymph of 130 min. An analysis of human methylpresnisolone data from Bird et al (2007) by Plontke et al. (2008a) suggested an elimination half-time of 27 mins. Following intratympanic applications of dexamethsone in guinea pigs, elimination half-time was estimated to be 85 min for samples taken at 6 h after application and 155 min for samples taken at 24 h after application (Salt et al. 2011a). In all the above studies substantial gradients of drug existed in the ear at the time of sampling which could have distorted the estimates of elimination.
The present study was intended to overcome the difficulty associated with distinguishing elimination from distribution. In the study, we used injections into perilymph of the LSCC to completely load the perilymphatic space and adjacent compartments with drug or marker. Injections at a low rate at this location displace perilymph through the cochlear aqueduct in the basal turn of ST with little influence on cochlear function. This allows almost the entire perilymphatic compartment to be reliably loaded with a well-defined drug concentration. The absence of substantial gradients within the fluid spaces means that drug movements associated with distribution are minimized and changes with time are dominated by the rate of elimination to blood. The experiments were designed to load the perilymphatic spaces with drug and then, after a variable delay period of up to 4 h, collect perilymph samples from the lateral canal to establish how much drug remained in perilymph. Data were interpreted with a recently-revised simulation program of the cochlear fluids that includes all the fluid and tissue spaces of the cochlea and vestibular systems of the ear. This approach is expected to provide a measure of elimination rate from perilymph with minimum contamination of other kinetic processes.
Methods
Pharmacokinetic measurements were made in 48 anesthetized pigmented NIH-strain guinea pigs, weighing 400 – 600 g, of both sexes and bred in our own colony. Experiments were conducted in accordance with the policies of the United States Department of Agriculture, the National Institute of Health guidelines for the handling and use of laboratory animals, and under protocol 20070147 approved by the Animal Care Committee of Washington University. Animals were initially anesthetized with 100 mg/kg sodium thiobutabarbital (Inactin, Sigma, St Louis, MO) and maintained on 0.8 to 1.2 % isofluorane in oxygen. Animals were mechanically ventilated through a tracheal cannula. Tidal volume was set to maintain a 5 % end-tidal CO2 level. Heart rate and blood oxygen saturation were monitored with a pulse-oximeter (Surgivet. Waukesha, WI). Body temperature was maintained near 38 °C with a thermistor-controlled heating pad.
Access to the LSCC was obtained with a post-auricular incision and a lateral opening in the auditory bulla. To prepare the LSCC for injection and sampling, the bone over the canal was thinned with a dental burr, where necessary removing a branch of the facial nerve that in some animals runs parallel to the LSCC for a short distance. When the canal was visible through the thinned bone, a layer of thin cyanoacrylate glue was applied to the dry bone followed by layers of two-part silicone adhesive (Kwik-Cast, World Precision Instruments, Sarasota, FL). The silicone was applied thinly over the canal but multiple layers were built up at the periphery to form a hydrophobic cup structure. A 30 – 40 μm fenestration into the canal wall was made through the adhesives and bone using a 30o House stapes pick (N1705 80, Bausch and Lomb Inc.). The pick was sharp at the tip, but rapidly widened so that entry into the canal, and potential damage to the endolymphatic system, was minimized. The glass pipette of the injection system was blunt (i..e. not beveled sharply), broken to 20 – 30 μm tip diameter. The pipette was positioned at the fenestration site, again minimizing insertion depth to avoid damage to the endolymphatic system. The injection pipette was sealed in place using cyanoacrylate glue, after first wicking away any emerging fluid from the hydrophobic surface. With this procedure the injection pipette could be placed in the perilymphatic space of the LSCC with no subsequent fluid leakage at the insertion site.
Drug injection procedures
Injections were performed with a digitally-controlled Ultrapump (World Precision Instruments, Sarasota, FL) mounted on a manipulator. A 100 μL gas-tight syringe (1710TLL Hamilton) was mounted on the motor unit and a plexiglass coupler (MPH6S10, World Precision Instruments, Sarasota, FL) was used to attach a 1 mm diameter glass injection pipette to the syringe. The coupler was permanently sealed to the injection syringe with cyanoacrylate glue to ensure that no fluid leakage could occur at the connection. Injections were performed at a rate of 1 μL/min typically for a 60 min period, although other durations were used as specifically stated. The cochlear pressure increase during injection is estimated to be less than 2 mmHg (Salt and DeMott 1998). Injection solutions were made in a background artificial perilymph containing (in mM) NaCl (125), KCl (3.5), NaHCO3 (25), CaCl2 (1.3), MgCl2 (1.2), NaH2PO4 (0.75) and Dextrose (5). In different experiments the markers 2 mM trimethylphenylammonium chloride (TMPA) or 0.5 – 1 mM sodium fluorescein were added to the solution. Dexamethasone solution with concentration comparable to perilymph concentrations after intratympanic application (Salt et al. 2011a) was made by taking the supernatant of a saturated suspension of micronized dexamethasone (mDex) (pure dexamethasone in a crystalline, powder form; Pfizer Inc., Kalamazoo,Mich., USA) in artificial perilymph and diluting it 1:19 in additional artificial perilymph. The concentration of the injected solution averaged 6.7 μg/ml (SD 3.3, n = 10). In three experiments, 2 mg/ml dexamethasone phosphate (DexP) (Fortecortin 10 mg/ml diluted 1:4 in artificial perilymph) was injected.
Sequential perilymph sampling and assay procedures
At times varied from 15 min to 4 h after the end of injection, multiple perilymph samples were taken from the LSCC. The injection pipette was first removed and the drop of cyanoacrylate glue that sealed it in place was broken up with the pick, taking care to leave the silicone cup intact. The fenestration was widened to 50 – 70 μm to allow perilymph leakage and the emerging perilymph was collected in blunt-tipped capillaries (#53432–706, 5 μL, VWR International, Radnor, PA). Each capillary was marked at a nominal volume of 1 μL. Sixteen to twenty individual 1 μL perilymph samples were collected sequentially, over a 20–30 min time period. The length of each sample was immediately measured with a calibrated dissecting microscope. The specific sample volumes and times were later used to simulate the experiments. Samples were expelled into dilutent, with pairs of samples pooled, resulting in 8 – 10 measurements each representing samples nominally 2 μL in volume. All data are presented as the 8–10 measured samples from each experiment. The dilutents used were 25 μL artificial perilymph for TMPA, 150 μL artificial perilymph for fluorescein, 48 μL of 50:50 methanol/water mixture for mDex, and 25 μL water for DexP.
TMPA was measured in micro-wells with TMPA-selective microelectrodes (as detailed by Mynatt et al. 2006). Fluorescein was measured with a Synergy HT plate reader (Bio-Tek Instruments, Winooski, VT). Dexamethsone was measured by HPLC with mass spectrometry detection as described by Wang et al. (2009) for mDex and Plontke et al. (2008b) for DexP. In the DexP experiments, analysis gave both DexP and Dex-base components, which were summed and analyzed as total Dex distribution.
In each experiment, two or three 1 μL samples of the injection solution were collected from the injection pipette and subjected to the same dilution and assay procedures as the perilymph samples. In most cases, perilymph sample concentrations have been normalized with respect to the injected solution concentration to decrease variation and to simplify comparisons across substances.
In vivo TMPA recording
TMPA-selective microelectrodes were made by procedures that are detailed elsewhere (Salt et al. 2003, 2012). Double-barreled electrodes were pulled, one barrel silanized by exposure to dimethyldichlorisilane vapor, and their tips beveled to a diameter of 3 – 4 μm. The silanized ion barrel was filled with 500 mM KCl, the non-silanized reference barrel was filled with 500 mM NaCl. A column TMPA-selective ion exchanger was drawn into the tip of the ion barrel. Ag/AgCl wires connected each barrel to a high-impedance electrometer. Electrodes were calibrated in standards containing 0, 2, 20, 200 and 2,000 mM TMPA in a background of artificial perilymph, at 39 °C in a custom water circulation chamber. Electrodes were sealed into the basal turns of ST or SV using procedures to prevent fluid leakage at the insertion site. The mucosa covering cochlea was removed, the bony scala wall was thinned with a flap knife. Cyanoacrylate and silicone adhesives were applied to the dry bone as described above. A small (30 – 40 μm) fenestra was made through the adhesives and the bone. The electrode was inserted into the fenestra and a tissue wick was used to remove perilymph as a drop of cyanacrylate glue was applied to seal the electrode in place.
Cochlear sensitivity assessed by compound action potential (CAP) thresholds
In experiments using fluorescein and mDex, and in 3 control experiments (artificial perilymph injection with no perilymph sampling) , sensitivity of the ear was monitored during and following injections from a ball electrode placed on the bony annulus next to the round window membrane. Contact with the round window membrane was avoided to prevent fluid leaks that could compromise the pharmacokinetic purpose of the experiment. Furthermore, we made no attempt to keep the round window niche dry as touching the round window area with wicks could induce leaks or cause failure of the glue seal at the injection site. So part of the measured functional changes may result from fluid accumulation in the niche.
Sound stimuli were delivered in a closed system using an Etymotic ER-10C microphone / speaker system driven by Tucker-Davis System 3 hardware. Stimulus delivery and data acquisition were controlled by custom software. The sound field in each animal was calibrated across the frequency range. CAP responses were obtained in response to 10 tone burst stimuli summed with responses to 10 inverted stimuli. A 10 μV amplitude criterion was used to establish threshold. During injections, thresholds at multiple test frequencies were followed with time using an automated tracking procedure.
Computer simulation of pharmacokinetic data
Our finite-element computer program for simulating solute movements in the cochlear scalae has recently been updated to include the tissue spaces of the ear and the fluid and tissue spaces of the vestibule and semi-circular canals. The latest version of this program (v 3.080) was made available for download at http://oto.wustl.edu/cochlea/ in February 2012. The program allows quantitative simulations of all aspects of the experiments in this study. It replicates the drug injection procedures, including the flow of solution from the lateral canal injection site to the cochlear aqueduct through the perilymphatic spaces, the elimination and movement of drugs over time during the delay period between injection and sampling, and replicates the fluid flows associated with sampling from the lateral canal, with the timing and flow rates defined by the sample collection data from each experiment. Experimental data from the study were fitted by varying just 4 parameters of the simulation. i) the elimination rates from the semi-circular canals; ii) elimination from the combined vestibule and scala vestibuli; iii) elimination from scala tympani; iv) the slow perilymph flow rate, driven by CSF entering the cochlear aqueduct during the entire delay period. This latter flow rate is unrelated to the much higher flow rates during drug injection and perilymph sampling procedures.
Results
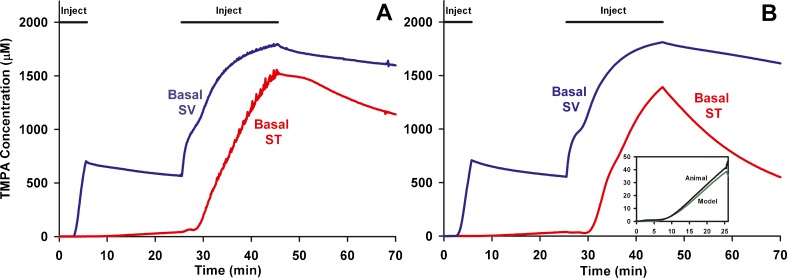
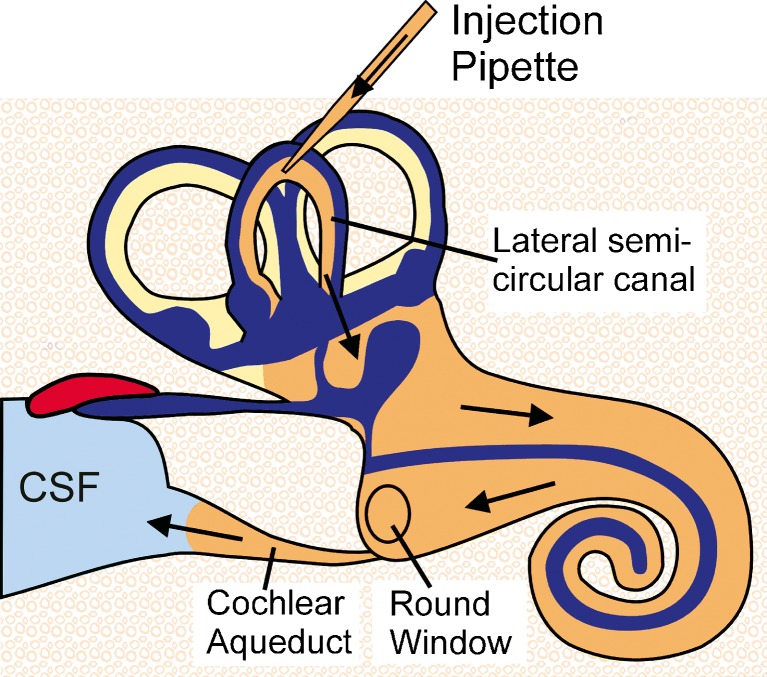
Injection into the perilymphatic space of the lateral semi-circular canal displaces perilymph towards the cochlear aqueduct at the base of ST. This is demonstrated in Fig. 1, in which TMPA concentration changes with time were monitored simultaneously from TMPA-selective electrodes sealed into the basal turns of ST and SV. The initial injection of 7 min duration was used to elevate TMPA concentration only in SV while the subsequent, 20 min injection elevated the concentration at both SV and ST measurement sites. The measured concentrations do not reach the perfused values due to ongoing losses from elimination and distribution. The observations are completely consistent with perilymph being displaced from the ear through the cochlear aqueduct during injection. In a computer simulation of this experiment (Figure 1, right panel) almost identical results were calculated for comparable locations in SV and ST based on the injections inducing flow from the LSCC injection site to the cochlear aqueduct at the base of ST. Injection into the LSCC thus allows most of the perilymphatic spaces to be filled with drug or marker solution. During and following the initial 7 min injection, the small rise detected in ST (Figure 1B, inset) was used to establish the rate at which TMPA could pass from SV to ST through local pathways such as the spiral ligament. The use of lateral canal injections to fill the perilymphatic space with drug is shown schematically in Fig. 2.
FIG. 1.
In vivo recordings of TMPA concentration during lateral semi-circular canal (LSCC) injections. A: TMPA concentration measured simultaneously from ion-selective electrodes sealed into ST and SV of the basal turn during two injections (of 7 min and 20 min duration) of 2 mM TMPA solution into the lateral canal at 1 μL/min. B: Computer simulation of the experiment in an anatomically-based model, with injections driving volume flow from the LSCC injection site towards the cochlear aqueduct through the perilymphatic spaces of the lateral canal, vestibule, scala vestibuli and scala tympani. The inset figure shows the initial measured and calculated time courses in ST shown enlarged. The increase of ST concentration during the initial period when SV concentration was elevated was used to quantify the rate of local cross-communication between ST and SV in the basal turn.
FIG. 2.
Schematic showing how perilymph of the ear can be filled with drug solution by injection from a pipette sealed into the semi-circular canal. During injection, fluid is displaced through the cochlear aqueduct into the cerebrospinal fluid (CSF).
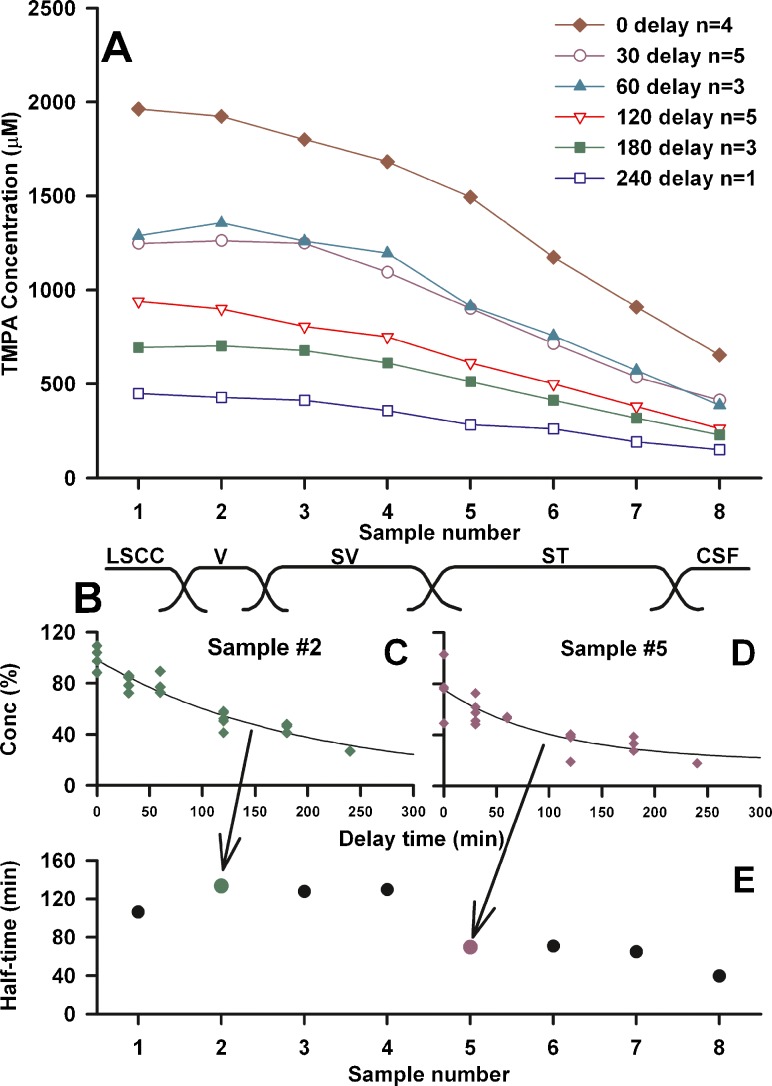
The perilymphatic spaces of the guinea pig have a volume of approximately 16 μL (Shinomori et al. 2001). The measurements in Fig. 1 show that a 20 μL injection was not sufficient to elevate the basal turn ST recording site to an asymptotic value, so that this injected volume does not completely load ST with TMPA. Initial kinetic studies with TMPA therefore used a 30 μL injection (30 min duration) to load the perilymph spaces. The results of filling the ear with 2 mM TMPA, followed by perilymph sampling from the lateral canal after various delay periods are summarized in Fig. 3A. The time to collect the 8 samples in these experiments averaged 21.8 min. The initial samples represent perilymph originating from the LSCC and vestibule, followed in sequence by perilymph from the SV, ST and CSF (schematized in Figure 3B). In each of these curves, there was a slow decline of concentration over the first 4 or 5 samples, followed by a steeper decline in later samples. The decline of specific samples with time was quantified by fitting exponential curves to the concentration of the samples for different delay times. Figs. 3C and D show the curves fitted to sample 2 and sample 5 of each experiment respectively. The half-times of decline of the fitted curves were 132 min and 72 min respectively. The fitted half-times for each of the 8 samples are summarized in Fig. 3E. Samples 2–4 (originating from the vestibule and scala vestibuli) showed longer half-times than samples 5–7 (originating from ST). This analysis gives a preliminary indication that TMPA kinetics is not uniform throughout the perilymphatic spaces.
FIG. 3.
A: Summary of sequentially-collected perilymph sample concentrations at various delay times following a 30 min injection of 2 mM TMPA into the LSCC. Each curve is the average of the number of experiments shown. B: Samples were each nominally 2 μL in volume and represent fluid from different inner ear locations from the LSCC sampling site to the cochlear aqueduct in the base of ST as indicated. C and D: Individual samples for different experiments normalized with respect to the measured injected concentration in each experiment and fitted with exponential curves as a function of delay time. E: Half-times of curves fitted to each sample group. Samples originating from the vestibule and scala vestibuli (samples 2–4) declined at a slower rate (with longer half-times) than those originating from scala tympani (samples 5–7).
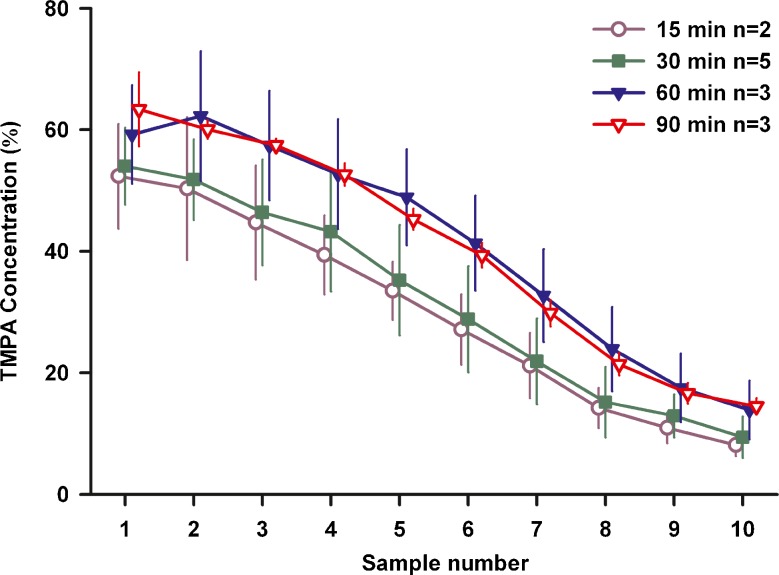
In view of the observed high rate of TMPA loss from ST, we were concerned that even the 30 min injection procedure was possibly insufficient to fully load the perilymph and adjacent tissue spaces. If the ear is not fully loaded with marker, then the decline of concentration after injection could include contributions from distribution processes as well as elimination. We therefore systematically varied the duration of TMPA injections, the results of which are summarized in Fig. 4. A constant delay period between the end of injection and the start of sampling of 120 min was used and 10 samples (each nominally 2 μL in volume) were measured from each animal. The data are shown normalized relative to the measured concentration of solution injected for each experiment (mean 1.81 mM, SD 0.32 mM, n = 13). ANOVA analysis of these data showed there was no significant difference between injections of 15 and 30 or 60 and 90 min, but there was a significant difference between sample levels for 30 and 60 min injections. These data are consistent with calculations showing that a steady state is reached for injections of long duration. They confirm that perilymph was loaded more effectively with an injection of 60 min duration or longer. All subsequent studies in the project used a 60 min loading period.
FIG. 4.
Sample concentration depends on the duration of TMPA injection. In these experiments injection duration was varied from 15 min to 90 min, with sampling taking place 2 h after the injection ended. Bars indicate standard deviation. Concentrations were normalized with respect to the measured concentration of the injected solution in each experiment. For 15 and 30 min injections, lower concentrations were measured than with 60 and 90 min injections, suggesting the perilymph and adjacent tissues was not fully loaded with the briefer injections.
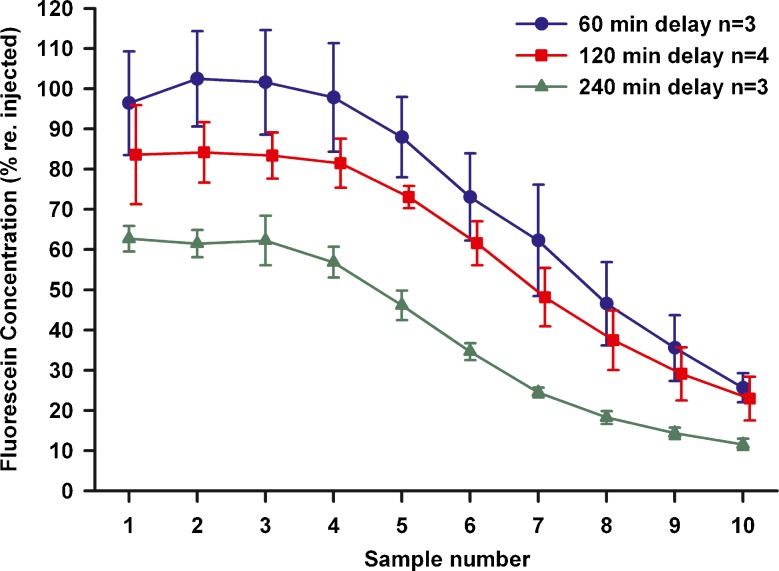
As part of a search for markers that were better retained in the perilymph space, we studied the kinetics of fluorescein, which is summarized in Fig. 5. Concentrations are shown normalized with respect to the injection concentration (mean 0.73 mM, SD 0.17 mM , n = 10) measured in each experiment. The waiting period between injection and sampling was varied up to 4 h. Fluorescein was found to be far better retained in perilymph than TMPA, with initial samples (1 – 3) showing levels over 80 % of the injected concentration at 2 h delay, compared with approximately 60 % for TMPA (from Figure 4).
FIG. 5.
Sequential perilymph samples taken at different delay times after fluorescein injection into the LSCC. Concentrations are shown normalized with respect to the measured concentration injected in each experiment. Fluorescein concentration declines very slowly with time, with initial samples (1–3) showing the vestibule and basal SV retained over 60 % of the injected fluorescent at 4 h (240 min) after injection. Bars indicate SD.
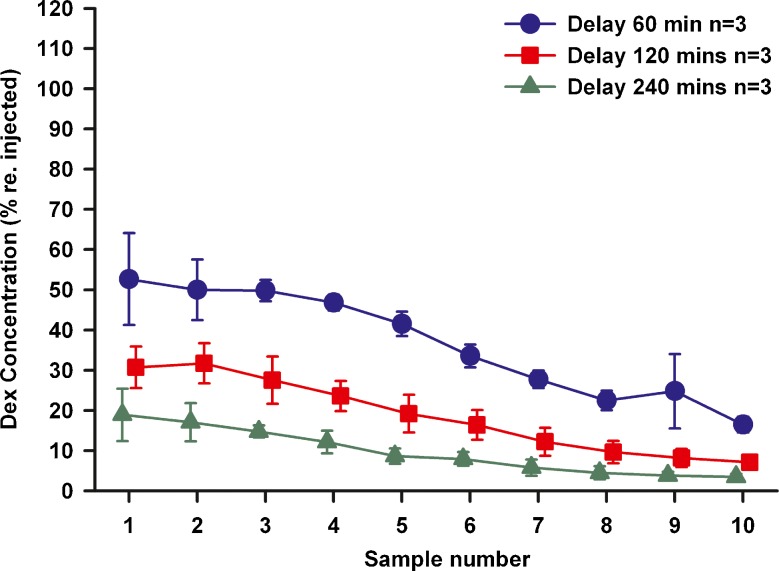
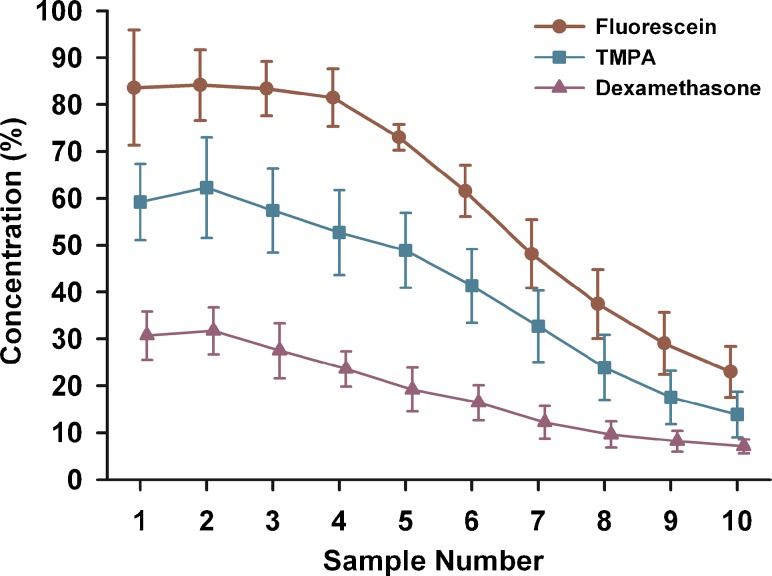
A similar series of experiments was performed using mDex, the results of which are summarized in Fig. 6. The average concentration injected was 6.7 ug/ml. With a 60 min waiting period, mDex levels in the initial samples (1 – 3) were only ~50 % of the injected concentration, falling to less than 20 % of the injected concentration after 240 min. The measured mDex levels were substantially lower than both TMPA and fluorescein. A comparison of sample concentrations with 60 min injections and 2 h delay before sampling for the 3 substances used in this study is shown in Fig. 7. The sample concentration curves for each of the groups were significantly different, with levels falling from fluorescein > TMPA > mDex. These results show that dexamethasone was lost from perilymph substantially faster than either of the marker substances used.
FIG. 6.
Sequential perilymph samples taken at different delay times after dexamethasone injection into the LSCC. Concentrations are shown normalized with respect to the measured concentration injected in each experiment. Dexamethasone concentration declines quickly with time. Initial samples (1–3) show levels near 50 % of the injected concentration at 60 min, falling to below 20 % at 240 min. Bars indicate SD.
FIG. 7.
Mean curves for three substances measured by sequential sampling with a 120 min delay after a 60 min injection into the LSCC. Concentrations were normalized with respect to the measured concentration of the injected solution in each experiment. Fluorescein shows the highest curve, showing it is eliminated most slowly from the cochlea. Dexamethasone (mDex) shows the lowest curve, indicating it is eliminated most rapidly from the cochlea. The TMPA curve falls at an intermediate level.
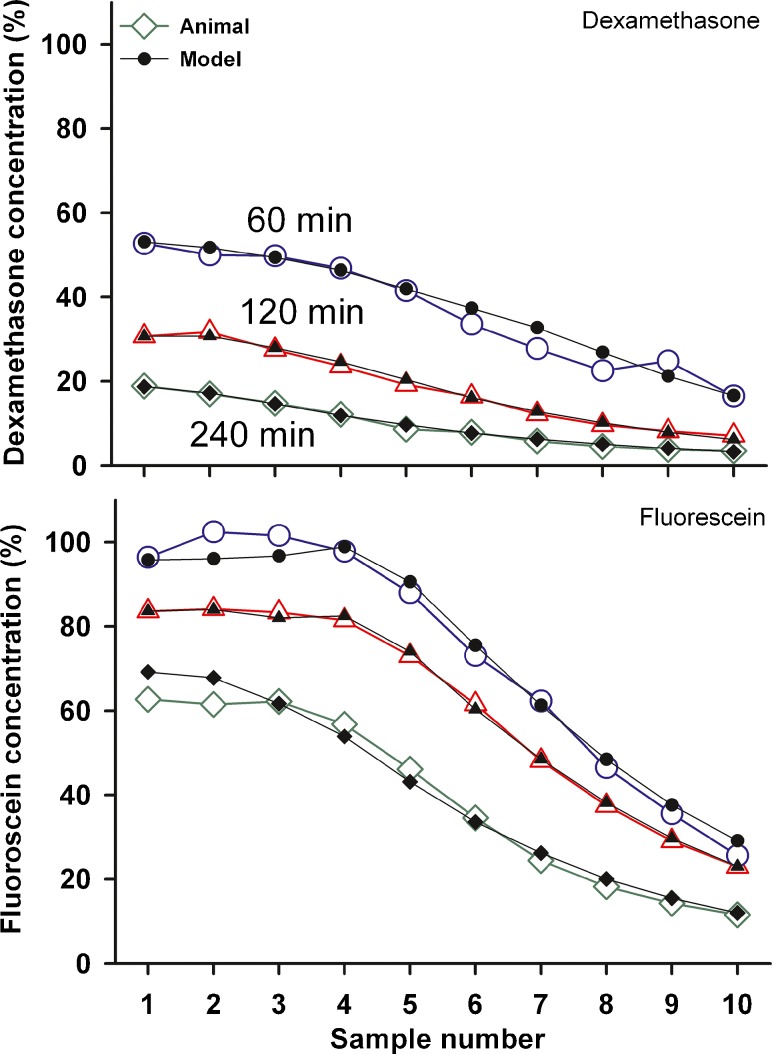
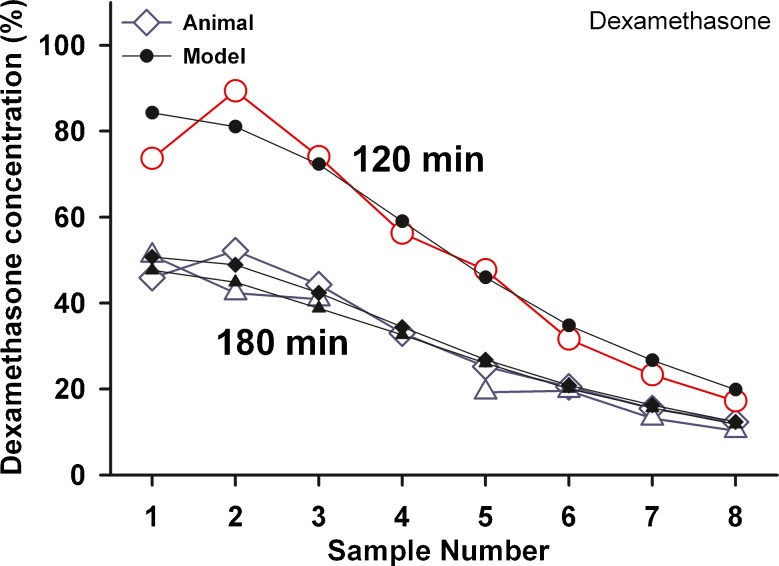
A quantitative analysis of the pharmacokinetic data was provided by computer simulations, which calculated sample concentration values resulting from specific experimental conditions. Elimination rates from the perilymphatic compartments were varied in the model to produce a concentration distribution along the perilymphatic chambers that gave calculated fluid sample concentrations as close as possible to the measured values. The calculated sample curves for mDex and fluorescein are compared with the measured data in Fig. 8. By adjustment of elimination and flow parameters it was possible to reasonably replicate the measured curves, although every detail of the curves could not be replicated for some conditions due to the limited number of parameters used. The parameters that provided a best fit to each data group (calculated to minimize the sum of squares of differences between measured and calculated values) are summarized in Table 1.
FIG. 8.
Determination of kinetic parameters by computer simulations of the experiments. Open symbols: Mean sample curves for mDex (upper panel ) and Fluorescein (lower panel) at three delay times after injection, fitted by computer simulations, shown by solid symbols. The parameters used to fit the curves are given in Table 1.
TABLE 1.
Pharmacokinetic parameters derived by simulation
| Substance | n | Injection Time (min) | Delay Time (min) | ST elimination half-time (min) | SV/ SM elimination Half-time (min) | SCC elimination half-time (min) | CSF influx rate (nl/min) |
|---|---|---|---|---|---|---|---|
| TMPA | 5 | 30 | 120 | 29 | 172 | 170 | 0.058 |
| TMPA | 3 | 60 | 120 | 40 | 620 | 64 | 0.025 |
| TMPA | 3 | 90 | 120 | 38.9 | 188 | 256 | 0.059 |
| TMPA | 5 | 30 | 30 | 14 | 250 | 100 | 0.060 |
| TMPA | 3 | 30 | 60 | 13 | 2200 | 85 | 0.075 |
| TMPA | 3 | 30 | 180 | 36.4 | 241 | 102 | 0.100 |
| TMPA | 1 | 30 | 240 | 39.5 | 175 | 135 | 0.055 |
| Average TMPA | 24.5 | 259 | 109 | 0.062 | |||
| Fluorescein | 3 | 60 | 60 | 55 | None | 600 | 0.070 |
| Fluorescein | 4 | 60 | 120 | 58 | 3800 | 250 | 0.060 |
| Fluorescein | 3 | 60 | 240 | 50 | 680 | 262 | 0.095 |
| Average Fluorescein | 54.1 | 1730 | 316 | 0.075 | |||
| mDex | 3 | 60 | 60 | 33.2 | 90 | 89 | 0.010 |
| mDex | 3 | 60 | 120 | 18.8 | 125 | 55 | 0 |
| mDex | 3 | 60 | 240 | 20.0 | 126 | 130 | 0 |
| Average mDex | 22.5 | 110.9 | 80.8 | 0.003 | |||
| Dex P | 1 | 30 | 120 | 16 | 1250 | 1000 | 0.09 |
| Dex-P | 1 | 30 | 180 | 20 | 212 | 170 | 0.14 |
| Dex-P | 1 | 30 | 180 | 19.5 | 209 | 167 | 0.06 |
| Average DexP | 18.3 | 291.2 | 233 | 0.097 | |||
This analysis shows that elimination rates are different in ST and SV. As half-times are typically not normally distributed, the average half-time shown is calculated as loge(2)/k, where k is the average of the individually-calculated rate constants, each calculated as loge(2)/half-time
The measured and fitted calculated curves for a limited number of experiments in which DexP was injected into the LSCC are shown in Fig. 9. The measured data were the sum of DexP and Dex base components in the samples, normalized with respect to the injected concentration. Measured sample Dex levels were higher than the measurements made with mDex (comparison with Figure 8).
FIG. 9.
Experimental sample data and fitted curves for 3 experiments in which DexP was injected into the LSCC and sampled after a delay of 120 min (n = 1) and 180 min (n = 2). Measured data are the sum of DexP and dex base, normalized with respect to the injected concentration. The parameters used to fit the model curves are given in Table 1.
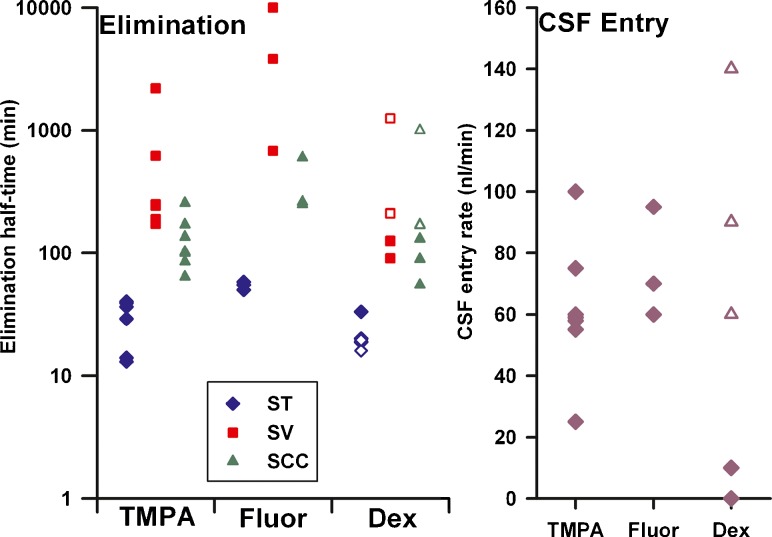
The parameters derived from simulations are shown graphically in Fig. 10. In common for all 3 substances, elimination from ST is shown to occur more rapidly (i.e. with a shorter half-time) than from SV. It was also necessary in many cases to have more rapid elimination from the SCC than SV in order to account for the initial sample data i.e. to account for the rollover of the curve found in many experiments. The elimination half-time of TMPA from ST (average 24.5 min) compared well with prior estimates but the rapid elimination of Dex (both mDex and DexP) from ST was quite unexpected. The elimination half-time from ST was 22.5 min for mDex and 18.3 min for DexP. The difference between findings for mDex and DexP was accounted for by a lower rate of elimination from SV and SCC for DexP and a notable difference in CSF inflow rates. The better retention of fluorescein in perilymph compared to mDex results from the lower rates of elimination at all 3 locations (SCC, SV + Vestibule and ST) for fluorescein compared to mDex. For most experimental groups, the inclusion of a low rate of perilymph flow during the delay period was necessary to obtain the measured curve shape, i.e. to reduce the concentration at the basal part of ST. The exception was mDex, which gave better fits for all 3 delay periods with very low flow rates.
FIG. 10.
Summary of kinetic parameters derived from simulation of LSCC injection / sampling data. The one fluorescein experiment which was fitted with no elimination from SV is shown at the upper limit of the plot. For dexamethasone, solid symbols show parameters for mDex and open symbols show parameters for DexP.
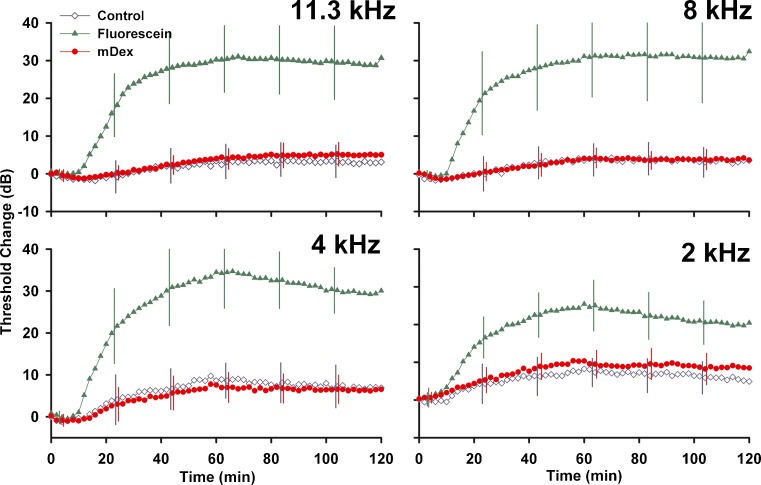
The changes in auditory function resulting from injections into the LSCC are summarized in Fig. 11. Both artificial perilymph injections (control) and mDex solutions produced an initial enhancement of sensitivity at high frequencies, followed by a decline in sensitivity that averaged less than 5 dB at high frequencies but up to 10 dB at lower frequencies. Changes induced by mDex were similar to those induced by control injections. Fluorescein induced substantially more threshold elevation, with threshold increases varying from 25 to 35 dB at different stimulus frequencies.
FIG. 11.
Cochlear sensitivity changes measured during 60 min injections of artificial perilymph (Control, n = 3), of fluorescein (n = 8) or of mDex (n = 9) at the concentrations used in the kinetic studies. Sensitivity was assessed by CAP thresholds at the 4 frequencies indicated using an automated procedure with a criterion of 10 μV. Measurements were made at 2 min intervals but SD error bars are only shown at 20 min intervals for clarity. Threshold changes produced by mDex were almost identical to those induced by control injections. Fluorescein caused substantial elevations of CAP thresholds.
Discussion
There have been numerous experimental studies of the pharmacokinetics of the ear with locally-applied drugs, but only a limited scientific framework is available for interpreting such studies. The ear appears to be unique in the body, with extracellular spaces containing fluids that are not flowing to the same degree as in other organs, such as in kidney tubules or in the ducts of secretory tissues. Movement of substances in the ear has been shown to be dominated by passive diffusion, which occurs slowly over the length of fluid spaces found in the ear (Salt and Ma 2001; Salt and Plontke 2005). This slow distribution results in sizeable gradients of drugs along the scalae following local applications (Saijo and Kimura 1984; Stöver et al. 1999; Salt and Ma 2001; Imamura and Adams 2003; Chen et al. 2005; Mynatt et al. 2006; Plontke et al. 2007, 2008b). In these circumstances, it is difficult to quantify pharmacokinetic parameters when drug levels are being influenced by the interacting processes of distribution and elimination. Lateral canal injections, followed by sequential sampling from the same site, provide a novel tool for the study of perilymph pharmacokinetics. Data analysis from these experiments is substantially simpler, as drug gradients between different regions of the ear are minimized. The LSCC injection method allows the perilymph to be reliably and consistently loaded with drug of known concentration. Sequential sampling from the LSCC allows the drug levels in different parts of the ear to be quantified, allowing differences in elimination rates for different inner ear locations to be demonstrated.
The data presented here confirm that for the three substances used, elimination from ST occurs more quickly than from SV. This has been suspected from prior studies where markers were measured simultaneously in ST and SV (Salt et al. 1991), but has not been conclusively demonstrated previously. This observation is consistent with the view that the main site of perilymph homeostasis may be the vasculature of the spiral ganglion. Anatomic studies have shown the fluid spaces of the spiral ganglion have extensive communication with the perilymph of ST through open channels in the bone in both guinea pigs (Shepherd and Colreavy 2004) and humans (Rask-Andersen et al. 2006). The present sampling studies are consistent with the view that the structures bounding ST play a more prominent role in perilymph homeostasis than do those bounding SV.
Analysis of these data also suggests that the decline of drug levels in the basal turn of ST may partially result from a slow influx of CSF through the cochlear aqueduct. A slow, apically directed flow in ST has been suggested in prior studies (Salt and Ma 2001; Plontke et al. 2007, 2008b). It is notable that all the prior studies were performed with the auditory bulla widely opened by a ventral exposure. This leads to the possibility that the CSF influx and induced perilymph flow could have been non-physiological, possibly resulting from fluid evaporation from the otic capsule under the conditions of the experiment. However, similar flow rates (somewhat higher in some conditions) were derived from the present study which was performed with the ventral bulla closed. The small lateral bulla opening in the present study did not result in drying of the mucosa covering the cochlea so evaporative loss from the bone to the same degree in this experiment is highly unlikely. This supports the view that the low rate of CSF entry is a true physiologic process. For many years the question of whether CSF entry contributes to perilymph homeostasis has been debated. Perilymph sampling studies in rats (reviewed by Sterkers et al. 1988) showed that perilymph and CSF had similar composition and showed similar kinetics for D-glucose (Ferrary et al. 1987), suggesting that a significant proportion of ST perilymph could be derived from CSF. On the other hand, systematic differences in substances such as glycine between CSF and perilymph, and the demonstration that samples became more CSF-like as larger volumes were taken, suggested that the similarity between perilymph and CSF could arise as a perilymph sampling artifact (Hara et al. 1989). An increasing degree of sample contamination with CSF as the volume of sample aspirated from the basal turn of ST was increased was demonstrated by Salt et al. (2003) using a marker ion. As a result, the degree to which CSF inflow contributes to perilymph homeostasis has been uncertain. All sequential sampling studies, previously from the apex (Mynatt et al. 2006; Plontke et al. 2007, 2008b) and here from the SCC, have supported the existence of a low rate of CSF entry into ST through the cochlear aqueduct. On the other hand, we appreciate that samples taken from the LSCC in the current study do not give as good a representation of perilymph from ST, especially that of the basal turn, compared to samples from the cochlear apex. Although there may be distortions, such as inter-animal variations of cochlear scalae volumes that could influence flow rate estimates given here, the results do support the view that a slow rate of CSF entry into ST exists.
Dex was lost from perilymph more rapidly than either fluorescein or TMPA. The derived elimination half-times of 22.5 min (ST) and 111 min (SV) for mDex (n = 9), and 18.3 mins (ST) and 291 min (SV) for DexP (n = 3) are substantially faster than the rates inferred from most prior studies. The analysis by Plontke and Salt (2003) showed that Bachmann et al’s (2001) prednisolone data were best fit by an elimination rate of 130 min. An uncertainty in the analysis of this study of intratympanically-applied drug arises from the unknown time course of drug concentration in the middle ear. As a result, elimination rates for the middle ear and perilymphatic compartments were grouped and assumed identical. Based on our new data, it now appears likely that elimination from perilymph occurs more rapidly than from the middle ear. The high rate of elimination seen here is more compatible with Plontke et al’s (2008a) analysis of methylprednisolone data from humans (Bird et al. 2007), which suggested an elimination half-time of 27 mins (also based on similar elimination rate from ST and the middle ear). Differences between all these studies could also arise from the fact that different glucocorticoids were used and each could exhibit different kinetics. It should also be appreciated that the actual decline of Dex concentration in ST does not occur with a 22 min half-time because of the connection to other compartments, predominantly SV, which declines at a slower rate. This results in a sustained movement of Dex from SV to ST driven by the prevailing concentration gradient. This inter-scala communication was incorporated into the model.
The high rate of Dex elimination from ST has important implications for the clinical administration of the drug. Given this high elimination rate, Dex applied intratympanically would not be expected to distribute far along the cochlear scalae towards the apex. With the new dexamethasone elimination rates, base to apex perilymph concentration gradients in the human are expected to be even more pronounced than previously suggested (Plontke and Salt 2003). Calculations (not shown) suggest that perilymph Dex levels would be reduced by over 3 orders of magnitude relative to the concentration near the RWM in less than 10 mm from the base of ST. An uncertain component in this calculation is the rate of CSF entry into the human cochlea through the aqueduct, which could contribute to an apical distribution of drugs. Even though the human aqueduct is narrower than the guinea pig, it still typically allows enough flow to balance pressure between the ear and the cranium in young adults (Phillips and Marchbanks 1989). But if a sustained flow exists in the human, its rate is currently unknown. Given the larger scala volumes in the human compared to the guinea pig, the influence of flow is expected to be considerably lower in the human.
There is still considerable uncertainty about where in the inner ear Dex may be acting. In cases of endolymphatic hydrops it is possible that modification of fluid transport in one region of the endolymph space may be sufficient to alter the status of all of it (analogous to an entire balloon collapsing when a portion is vented). Pondugula et al. (2004) showed that cation uptake into the semicircular canals was upregulated by Dex. Kim and Marcus (2009) found a similar Dex-induced upregulation of sodium transport into the sacculus. On the basis of these findings it is possible that Dex levels in the basal regions of the ear could influence endolymph or perilymph fluid status. However, for conditions where Dex treatment is required to be present throughout the inner ear, then intratympanic applications may not be effective even when applied as a sustained release delivery (Wang et al 2009).
The suggestion from our analysis that mDex may decrease the rate of CSF entry in the guinea pigs could well be consistent with its influence on ion transport of the vestibular system (Kim and Marcus 2009). We know that CSF is entering ST at the cochlear aqueduct at a low rate but we do not know where the exit site of this fluid volume occurs. An ongoing loss of perilymph volume to the endolymphatic system of the sacculus, or other vestibular organs, could account for our findings. More supporting data for the existence of such processes is needed.
The perilymphatic fluid spaces interact with adjacent fluid and tissue spaces in a manner that can only be partially addressed in the computer simulations. An important consideration is whether drug loss from perilymph caused by drug movement to another compartment in the ear could be interpreted as elimination to the blood. The simulations used here included the tissue spaces of the spiral ligament, spiral ganglion, auditory nerve and organ of Corti. The slow rate of decline in later samples with apical sampling from the cochlea (Salt et al 2011b), due to CSF washing through ST gaining drug from the adjacent spaces, suggests very fast communication between ST and its adjacent spaces, with half-times in the 10–12 min range. Immunochemical studies in the mouse also suggest that Dex very rapidly enters cochlear tissues (Hargunani et al. 2006). With such fast communication, the 60 min loading time used in the experiments would be sufficient to allow the tissue spaces to be loaded with drug so they should not represent major sinks for drug or marker loss during the delay period. The other compartment of sufficient volume to provide a potential sink that needs to be considered is the endolymphatic compartment. Previous studies have shown that TMPA does not readily enter endolymph (Salt et al. 1991). As fluorescein was lost from perilymph considerably more slowly than TMPA, we did not consider fluorescein losses to endolymph in this analysis. The pertinent question is whether the entry of Dex into endolymph could influence the interpretation of findings. Endolymph measurements show that Dex does enter endolymph but measured concentrations were lower than that of basal turn ST perilymph after applications of 6 and 24 h (Salt et al. 2011a), suggesting no major accumulation. In the analysis of the present Dex data we included a communication half-time of 60 min between endolymph and SV and between endolymph and the organ of Corti. This has little influence on the samples, however, because most of the entry into endolymph occurs during the injection period, when drug level is controlled by the injection, and the amount of efflux from endolymph during sampling will be limited by the relatively short time taken to collect samples. The fact that endolymph volume is only ~25 % of perilymph volume also minimizes its potential contribution. In order to substantially influence the perilymph samples a substance would have to both enter and leave endolymph with fast kinetics, which is unlikely for most substances due to the tight cellular barrier between the two fluids. We conclude that any distortion of our analysis of Dex kinetics by its entry into endolymph, or other compartment of the ear, is small.
A similar rationale applies to the binding of Dex to cellular receptors, which could cause accumulation in tissues and loss from perilymph. If the binding occurred rapidly then the receptors would be saturated during the injection period. Indeed, such buffering could even stabilize Dex levels and result in them to fall more slowly over time as elimination occurs. Another possibility that has to be considered is whether the loss of Dex from perilymph could represent metabolism rather than elimination. In the liver and kidney, Dex primarily undergoes 6β-hydroxylation by Cytochrome P450 3A4 (CYP3A4), but may also undergo side-chain cleavage by the hydroxalase CYP17A1 to form 9αfluoro-androsta-1,4-diene-11β-hydroxy-16α-methyl-3,17-dione (9α-F-A) which subsequently also undergoes 6β-hydroxylation (Tomlinson et al. 1997). Lecain et al. (2003) showed that CYP17A1 was expressed in the lateral wall, the organ of Corti and in the modiolus of the rat cochlea, although in situ hybridization experiments failed to detect transcripts. Although it is possible some Dex is being metabolized, there is presently no data indicating the rate that this could occur. Assuming it does not occur to the degree required to account for these data, the sustained decline seen over 4 h in our experiments is consistent with loss to a compartment that does not saturate, most likely representing elimination to blood.
The derived parameters allow the model (the model, including the parameters derived from this study, is available on the internet) to closely replicate the decline of drug concentrations with time found in the present experiments. There are a number of limitations of the model to consider. We have fitted the data using as few parameters as possible, specifically four. Each parameter had a unique influence on the calculated sample curve. The assumption made by this approach is that elimination occurs with a uniform half-time with distance along each compartment, even though the compartment dimensions are changing. We used three elimination rates, one specifying elimination from the SCC, one from the vestibule and SV, and one from ST. We could have obtained better fits using 10 elimination variables, each representing elimination from the segment contributing to each sample. There is no evidence that elimination rate varies markedly with distance along cochlear scalae, so at present the simple, 3-variable approach seems appropriate. The model included communication between ST and the spiral ligament, and SV and the spiral ligament (thereby enabling local cross-communication between ST and SV). The protocol, in which drug concentrations are elevated in both SV and ST, will rapidly load the spiral ligament with drug. As the concentration gradients across the spiral ligament will be very low, solute movements between ST and SV by this pathway will be small and can have only a minor influence on the results. In this respect, the experimental design achieves its intended aim of minimizing the number of processes that need to be considered in detail to replicate the experimental data.
Functional changes measured during lateral canal injections show that function is well-maintained with both control and mDex solutions although minor systematic changes do occur. The changes occur slowly with time, not rapidly at the start and end of injection, so they probably result from fluids composition changes, rather than from injection-induced mechanical disturbance. The initial improvement in function may be accounted for by the normal SV perilymph, which has a higher K+ concentration of that in ST, being displaced into ST by the injection and causing the endocochlear potential to rise. We can conclude that the pharmacokinetic method itself is not damaging to the ear. In contrast, we found that the marker fluorescein had a substantial influence on cochlear function. The 25–35 dB threshold elevations, which varied with test frequency, are consistent with a disturbance of outer hair cell amplification by this anionic marker.
Acknowledgments
This work was supported by research grant DC01368 from NIDCD, NIH. The mDex and analysis of blinded perilymph samples containing mDex was performed in collaboration with investigators at Otonomy, Inc (F.P.) but Otonomy did not otherwise support the study. Dr. Salt is a member of the Scientific Advisory Board of Otonomy, Inc. and may receive income based on equity holdings. Dr. Plontke is a consultant for Otonomy, Inc. F.P. is an employee of Otonomy Inc, and as such has received equity income.
Abbreviations
- CAP
compound action potential
- CSF
cerebrospinal fluid
- Dex
dexamethasone
- DexP
dexamethasone phosphate
- LSCC
lateral semi-circular canal
- mDex
micronized dexamethasone
- ST
scala tympani
- SV
scala vestibuli
- TMPA
trimethylphenylammonium
References
- Bachmann G, Su J, Zumegen C, Wittekindt C, Michel O. Permeabilität der runden Fenstermembran für Prednisolon-21-Hydrogensuccinat. HNO. 2001;49:538–542. doi: 10.1007/s001060170078. [DOI] [PubMed] [Google Scholar]
- Bird PA, Begg EJ, Zhang M, Keast AT, Murray DP, Balkany TJ. Intratympanic versus intravenous delivery of methylprednisolone to cochlear perilymph. Otol Neurotol. 2007;28:1124–1130. doi: 10.1097/MAO.0b013e31815aee21. [DOI] [PubMed] [Google Scholar]
- Bird PA, Murray DP, Zhang M, Begg EJ. Intratympanic versus intravenous delivery of dexamethasone and dexamethasone sodium phosphate to cochlear perilymph. Otol Neurotol. 2011;32:933–936. doi: 10.1097/MAO.0b013e3182255933. [DOI] [PubMed] [Google Scholar]
- Borden RC, Saunders JE, Berryhill WE, et al. Hyaluronic acid hydrogel sustains the delivery of dexamethasone across the round window membrane. Audiol Neurootol. 2011;16:1–11. doi: 10.1159/000313506. [DOI] [PubMed] [Google Scholar]
- Chandrasekhar SS, Rubinstein RY, Kwartler JA, Gatz M, Connelly PE, Huang E, Baredes S. Dexamethasone pharmacokinetics in the inner ear: comparison of route of administration and use of facilitating agents. Otolaryngol Head Neck Surg. 2000;122:521–528. doi: 10.1016/S0194-5998(00)70094-5. [DOI] [PubMed] [Google Scholar]
- Chen Z, Kujawa SG, McKenna MJ, Fiering JO, Mescher MJ, Borenstein JT, Swan EE, Sewell WF. Inner ear drug delivery via a reciprocating perfusion system in the guinea pig. J Control Release. 2005;110:1–19. doi: 10.1016/j.jconrel.2005.09.003. [DOI] [PMC free article] [PubMed] [Google Scholar]
- Ferrary E, Sterkers O, Saumon G, Tran Ba Huy P, Amiel C. Facilitated transfer of glucose from blood into perilymph in the rat cochlea. Am J Physiol. 1987;253:F59–F65. doi: 10.1152/ajprenal.1987.253.1.F59. [DOI] [PubMed] [Google Scholar]
- Goycoolea MV, Muchow D, Schachern P. Experimental studies on round window structure: function and permeability. Laryngoscope. 1988;98(Suppl 44):1–20. doi: 10.1288/00005537-198806001-00002. [DOI] [PubMed] [Google Scholar]
- Hahn H, Kammerer B, DiMauro A, Salt AN, Plontke S. Cochlear microdialysis for quantification of dexamethasone and fluorescein entry into scala tympani during round window administration. Hear Res. 2006;212:236–244. doi: 10.1016/j.heares.2005.12.001. [DOI] [PMC free article] [PubMed] [Google Scholar]
- Hahn H, Salt AN, Biegner T, Kammerer B, Delabar U, Hartsock JJ, Plontke SK. Dexamethasone Levels and Base-to-Apex Concentration Gradients in the Scala Tympani Perilymph After Intracochlear Delivery in the Guinea Pig. Otol Neurotol. 2012;33:660–665. doi: 10.1097/MAO.0b013e318254501b. [DOI] [PMC free article] [PubMed] [Google Scholar]
- Hara A, Salt AN, Thalmann R. Perilymph composition in scala tympani of the cochlea: Influence of cerebrospinal fluid. Hear Res. 1989;42(265):272. doi: 10.1016/0378-5955(89)90150-0. [DOI] [PubMed] [Google Scholar]
- Hargunani CA, Kempton JB, DeGagne JM, Trune DR. Intratympanic injection of dexamethasone: time course of inner ear distribution and conversion to its active form. Otol Neurotol. 2006;27:564–569. doi: 10.1097/00129492-200606000-00021. [DOI] [PubMed] [Google Scholar]
- Imamura S, Adams JC. Distribution of gentamicin in the guinea pig inner ear after local or systemic application. J Assoc Res Otolaryngol. 2003;4:176–195. doi: 10.1007/s10162-002-2036-8. [DOI] [PMC free article] [PubMed] [Google Scholar]
- Kim SH, Marcus DC. Endolymphatic sodium homeostasis by extramacular epithelium of the saccule. J Neurosci. 2009;29:15851–15858. doi: 10.1523/JNEUROSCI.3044-09.2009. [DOI] [PMC free article] [PubMed] [Google Scholar]
- King EB, Salt AN, Eastwood HT, O’Leary SJ. Direct entry of gadolinium into the vestibule following intratympanic applications in Guinea pigs and the influence of cochlear implantation. J Assoc Res Otolaryngol. 2011;12:741–751. doi: 10.1007/s10162-011-0280-5. [DOI] [PMC free article] [PubMed] [Google Scholar]
- Lecain E, Yang TH, Tran Ba Huy P. Steroidogenic enzyme expression in the rat cochlea. Acta Otolaryngol. 2003;123:187–191. doi: 10.1080/0036554021000028106. [DOI] [PubMed] [Google Scholar]
- Liu HJ, Dong MM, Chi FL. Dexamethasone pharmacokinetics in guinea pig inner ear perilymph. ORL J Otorhinolaryngol Relat Spec. 2006;68:93–98. doi: 10.1159/000091210. [DOI] [PubMed] [Google Scholar]
- Mikulec AA, Plontke SK, Hartsock JJ, Salt AN. Entry of substances into perilymph through the bone of the otic capsule following intratympanic applications in guinea pigs: Implications for local drug delivery in humans. Otol Neurotol. 2009;30:131–138. doi: 10.1097/MAO.0b013e318191bff8. [DOI] [PMC free article] [PubMed] [Google Scholar]
- Mynatt R, Hale SA, Gill RM, Plontke SKR, Salt AN. Demonstration of a longitudinal concentration gradient along scala tympani by sequential sampling of perilymph from the cochlear apex. J Assoc Res Otolaryngol. 2006;7:182–193. doi: 10.1007/s10162-006-0034-y. [DOI] [PMC free article] [PubMed] [Google Scholar]
- Nomura Y. Otological significance of the round window. Adv Otorhinolaryngol. 1984;33:66–72. [PubMed] [Google Scholar]
- Parnes LS, Sun AH, Freeman DJ. Corticosteroid pharmacokinetics in the inner ear fluids: an animal study followed by clinical application. Laryngoscope. 1999;109:1–17. doi: 10.1097/00005537-199907001-00001. [DOI] [PubMed] [Google Scholar]
- Phillips AJ, Marchbanks RJ. Effects of posture and age on tympanic membrane displacement measurements. Br J Audiol. 1989;23:279–284. doi: 10.3109/03005368909076515. [DOI] [PubMed] [Google Scholar]
- Plontke SK, Salt AN. Quantitative interpretation of corticosteroid pharmacokinetics in inner ear fluids using computer simulations. Hear Res. 2003;182:34–42. doi: 10.1016/S0378-5955(03)00138-2. [DOI] [PubMed] [Google Scholar]
- Plontke SK, Mynatt R, Gill RM, Salt AN. Concentration gradient along scala tympani following the local application of gentamicin to the round window membrane. Laryngoscope. 2007;117:1191–1198. doi: 10.1097/MLG.0b013e318058a06b. [DOI] [PMC free article] [PubMed] [Google Scholar]
- Plontke SK, Mikulec AA, Salt AN. Rapid clearance of methylprednisolone after intratympanic application in humans. Otol Neurotol. 2008;29:732–733. doi: 10.1097/MAO.0b013e318173fcea. [DOI] [PMC free article] [PubMed] [Google Scholar]
- Plontke SK, Biegner T, Kammerer B, Delabar U, Salt AN. Dexamethasone concentration gradients along scala tympani after application to the round window membrane. Otol Neurotol. 2008;29:401–406. doi: 10.1097/MAO.0b013e318161aaae. [DOI] [PMC free article] [PubMed] [Google Scholar]
- Pondugula SR, Sanneman JD, Wangemann P, Milhaud PG, Marcus DC. Glucocorticoids stimulate cation absorption by semicircular canal duct epithelium via epithelial sodium channel. Am J Physiol Renal Physiol. 2004;286:F1127–F1135. doi: 10.1152/ajprenal.00387.2003. [DOI] [PubMed] [Google Scholar]
- Rask-Andersen H, Schrott-Fischer A, Pfaller K, Glueckert R. Perilymph/modiolar communication routes in the human cochlea. Ear Hear. 2006;27:457–465. doi: 10.1097/01.aud.0000233864.32183.81. [DOI] [PubMed] [Google Scholar]
- Saijo S, Kimura RS. Distribution of HRP in the inner ear after injection into the middle ear cavity. Acta Otolaryngol. 1984;97:593–610. doi: 10.3109/00016488409132937. [DOI] [PubMed] [Google Scholar]
- Salt AN, DeMott JE. Longitudinal endolymph movements induced by perilymphatic injections. Hear Res. 1998;123:137–147. doi: 10.1016/S0378-5955(98)00106-3. [DOI] [PubMed] [Google Scholar]
- Salt AN, Ohyama K, Thalmann R. Radial communication between the perilymphatic scalae of the cochlea. I. Estimation by tracer perfusion. Hear Res. 1991;56:29–36. doi: 10.1016/0378-5955(91)90150-8. [DOI] [PubMed] [Google Scholar]
- Salt AN, Ma Y. Quantification of solute entry into cochlear perilymph through the round window membrane. Hear Res. 2001;154:88–97. doi: 10.1016/S0378-5955(01)00223-4. [DOI] [PubMed] [Google Scholar]
- Salt AN, Kellner C, Hale S. Contamination of perilymph sampled from the basal cochlear turn with cerebrospinal fluid. Hear Res. 2003;182:24–33. doi: 10.1016/S0378-5955(03)00137-0. [DOI] [PubMed] [Google Scholar]
- Salt AN and Plontke SKR (2005) Local Inner ear drug delivery and pharmacokinetics. In: Hearing Research and Drug Discovery : Drug Discov Today. 10:1299–1306 [DOI] [PMC free article] [PubMed]
- Salt AN, Plontke SK. Principles of local drug delivery to the inner ear. Audiol Neurootol. 2009;14:350–360. doi: 10.1159/000241892. [DOI] [PMC free article] [PubMed] [Google Scholar]
- Salt AN, Hartsock JJ, Plontke SK, LeBel C, Piu F. Distribution of dexamethasone and preservation of inner ear function following intratympanic delivery of a gel-based formulation. Audiol Neuro otol. 2011;16:323–335. doi: 10.1159/000322504. [DOI] [PMC free article] [PubMed] [Google Scholar]
- Salt AN, Hartsock J, Bretan M, Gill R (2011b) Evaluation of a Ten-Compartment Computer Model of the Inner Ear Fluid Spaces. 34th Midwinter Research Meeting of the Association for Research In Otolaryngology, Baltimore, (Abstract)
- Salt AN, King EB, Hartsock JJ, Gill RM, O’Leary SJ. Marker entry into vestibular perilymph via the stapes following applications to the round window niche of guinea pigs. Hear Res. 2012;283:14–23. doi: 10.1016/j.heares.2011.11.012. [DOI] [PMC free article] [PubMed] [Google Scholar]
- Shepherd RK, Colreavy MP. Surface microstructure of the perilymphatic space: implications for cochlear implants and cell- or drug-based therapies. Arch Otolaryngol Head Neck Surg. 2004;130:518–523. doi: 10.1001/archotol.130.5.518. [DOI] [PubMed] [Google Scholar]
- Shinomori Y, Spack DS, Jones DD, Kimura RS. Ann Otol Rhinol Laryngol. 2001;110:91–98. doi: 10.1177/000348940111000117. [DOI] [PubMed] [Google Scholar]
- Sterkers O, Ferrary E, Amiel C. Production of inner ear fluids. Physiol Rev. 1988;68:1083–1128. doi: 10.1152/physrev.1988.68.4.1083. [DOI] [PubMed] [Google Scholar]
- Stöver T, Yagi M, Raphael Y. Cochlear gene transfer: round window versus cochleostomy inoculation. Hear Res. 1999;136:124–130. doi: 10.1016/S0378-5955(99)00115-X. [DOI] [PubMed] [Google Scholar]
- Tomlinson ES, Lewis DF, Maggs JL, Kroemer HK, Park BK, Back DJ. In vitro metabolism of dexamethasone (DEX) in human liver and kidney: the involvement of CYP3A4 and CYP17 (17,20 LYASE) and molecular modelling studies. Biochem Pharmacol. 1997;54:605–611. doi: 10.1016/S0006-2952(97)00166-4. [DOI] [PubMed] [Google Scholar]
- Wang X, Dellamary L, Fernandez R, Harrop A, Keithley EM, Harris JP, Ye Q, Lichter J, LeBel C, Piu F. Dose-dependent sustained release of dexamethasone in inner ear cochlear fluids using a novel local delivery approach. Audiol Neuro otol. 2009;14:393–401. doi: 10.1159/000241896. [DOI] [PubMed] [Google Scholar]
- Yang J, Wu H, Zhang P, Hou DM, Chen J, Zhang SG. The pharmacokinetic profiles of dexamethasone and methylprednisolone concentration in perilymph and plasma following systemic and local administration. Acta Otolaryngol. 2008;128:496–504. doi: 10.1080/00016480701558906. [DOI] [PubMed] [Google Scholar]


