Abstract
We recently showed that combination therapy with losartan and pioglitazone provided synergistic effects compared with monotherapy in improving lesions of renal structure and function in Sprague-Dawley rats fed with a high-fat, high-sodium diet and 20% sucrose solution. This study was designed to explore the underlying mechanisms of additive renoprotection provided by combination therapy. Losartan, pioglitazone, and their combination were orally administered for 8 weeks. The increased level of renal malondialdehyde and expression of nicotinamide adenine dinucleotide phosphate oxidase subunit p47phox and nitrotyrosine as well as the decreased total superoxide dismutase activity and copper, zinc-superoxide dismutase expression were tangible evidence for the presence of oxidative and nitrative stress in the kidney of model rats. Treatment with both drugs, individually and in combination, improved these abnormal changes. Combination therapy showed synergistic effects in reducing malondialdehyde level, p47phox, and nitrotyrosine expression to almost the normal level compared with monotherapy. All these results suggest that the additive renoprotection provided by combination therapy might be attributed to a further reduction of oxidative and nitrative stress.
1. Introduction
High fat, sucrose, and sodium chloride intake, an established habit in industrialized nations, is an important risk factor for human health. In fact, chronic consumption of a high-fat, high-sucrose diet induces obesity, insulin resistance, dyslipidemia, and hypertension [1]. However, whether high-fat and high-sucrose diets can lead to renal lesions remains controversial [2, 3]. In addition to this debate, clinical and experimental studies have shown that chronic high-sodium intake induces proteinuria and renal fibrosis and disease progression [4–6]. Indeed, our laboratory has demonstrated that Sprague-Dawley (SD) rats fed with a high-fat, high-sodium diet (HFS) and 20% sucrose solution for 16 weeks could develop relatively early stage of renal lesions, such as albuminuria and focal segmental glomerulosclerosis [7].
In addition, we demonstrated that combination therapy with losartan (angiotensin II receptor blocker, ARB) and pioglitazone (peroxisome proliferator-activated receptor-γ, PPARγ agonist) provided synergistic effects in improving the lesions of renal structure and function [7]. Other clinical and experimental studies also have reported that a PPARγ agonist enhances the renoprotective effects of an ARB in diabetic nephropathy and nondiabetic renal diseases [8–10]. However, to our knowledge, the underlying mechanisms of additive renoprotection provided by combination therapy are still not well understood.
Oxidative and nitrative stress plays a major role in the pathogenesis of endothelial dysfunction, inflammation, and renal dysfunction [11–13]. To date, consumption of a high sodium or high-fat, high-sucrose diet has been demonstrated to cause oxidative and/or nitrative stress in the kidney of normal rats [14, 15]. Several studies have shown that both losartan and pioglitazone improve these stress states in diabetic nephropathy and nondiabetic renal diseases [16–19]. Accordingly, the present study was designed to investigate whether combination therapy with losartan and pioglitazone could provide a synergistic effect in improving renal oxidative and nitrative stress in rats fed with the abnormal diet.
2. Materials and Methods
2.1. Chemicals
Losartan was provided by MSD Pharmaceutical Co. (Hangzhou, China). Pioglitazone was purchased from Takeda Pharmaceutical Co. (Tianjin, China). Total protein, malondialdehyde (MDA), and total superoxide dismutase (T-SOD) activity assay kits were purchased from Jiancheng Institute of Biotechnology (Nanjing, China). Polyclonal rabbit anti-MDA antibody was purchased from Abcam (Cat No.: ab6463, Cambridge, UK). Polyclonal rabbit anticopper, zinc-superoxide dismutase (Cu/Zn-SOD, Cat No.: BA1401), and monoclonal mouse anti-β-actin (Cat No.: BM0627) antibodies were purchased from Boster Biotechnology Inc. (Wuhan, China). Polyclonal rabbit antinicotinamide adenine dinucleotide phosphate (NADPH) oxidase subunit p47phox (Cat No.: sc-14015) and monoclonal mouse anti-nitrotyrosine (Cat No.: sc-32731) antibodies were purchased from Santa Cruz Biotechnology Inc. (Santa Cruz, USA). Glucose assay kit was purchased from Rongsheng Biotechnology Co. (Shanghai, China). Albumin and insulin radioimmunoassay kit was purchased from North Institute of Biotechnology (Beijing, China).
2.2. Animals and Diet
Male SD rats (240 ± 20 g, obtained from Zhejiang Province Experimental Animal Center) were maintained under controlled conditions of light, temperature, and humidity. The investigation conformed to the Guide for the Care and Use of Laboratory Animals published by the U.S. National Institutes of Health (NIH publication No. 85-23, revised 1996). High-fat, high-sodium (HFS) diet was prepared as described in our previous study [7] and composed of 4% sodium chloride, 21.1% protein, 20% fat (containing 15% lard oil and 1% cholesterin), 33% carbohydrate, and standard vitamins and mineral mix.
2.3. Experimental Procedures
After 1-week accommodation to the new environment, rats were fed with the HFS diet and 20% sucrose solution for 16 weeks apart from the control group (C, n = 7, normal diet and water), namely, lasted to the end of study. After 8 weeks of receiving the abnormal diet, the rats (except the control group) were randomly assigned to four groups, namely, model group (n = 7), losartan treatment group (20 mg/kg, n = 6), pioglitazone treatment group (10 mg/kg, n = 6), and combined treatment group (received losartan plus pioglitazone at the doses described above, n = 6). The dosages of losartan [20, 21] and pioglitazone [19, 22] were based on previous studies. The duration of treatment was selected according to previous studies [19, 20]. The drugs were orally administrated at 9:00-10:00 AM everyday by gavage for the next 8 weeks. Untreated groups received an equal volume of distilled water.
During the entire period of the experiment, body weight (BW) was measured weekly. The rats were placed in metabolic cages to collect 24 h urine. At the end of the study, the rats were fasted overnight and anesthetized by an intraperitoneal injection of sodium pentobarbital. Blood samples were drawn from abdominal aorta. Kidneys were removed, decapsulated, and immediately weighed. One kidney was frozen at −80°C until processed, the other was fixed by immersion in 10% formaldehyde for later microscopic examination.
2.4. Biochemical Analysis
Renal MDA content was measured using the thiobarbituric acid method as described in our previous study [11]. Briefly, the samples were treated with thiobarbituric acid, which in the presence of MDA generates a red product with an absorption maximum at 532 nm. The concentration of MDA was calculated by comparing the absorbance to that produced by the control standard 1,1,3,3-tetraethoxypropane and expressed as nmol per milligram protein. T-SOD activity in the kidney was measured using the xanthine oxidase method as described previously [23]. The amount of SOD that caused 50% inhibition of the production of superoxide anion per unit protein in 1 mL reaction volume is defined as 1 unit (U). The rate of inhibition was determined by measuring the absorbance at 550 nm. The results were expressed as U per milligram protein. Serum insulin and urine albumin were measured using a Gamma-counter. Serum glucose was determined by a biochemistry analyzer. Homeostasis model assessment insulin sensitivity index (HOMA-ISI) was calculated as 1/(glucose × serum insulin). Insulin level was the natural logarithm transformed before analysis [24].
2.5. Reverse Transcription-Polymerase Chain Reaction (RT-PCR) Analysis
Total RNA was extracted from the rat kidney using Trizol reagent (Gibco, USA). RNA (2 μg) was reverse transcribed. The sequences of primers used for the amplifications were as follows: p47phox (165 bp), sense: 5′-ATGATGGGACCCGTGATG-3′ and antisense: 5′-GGGACTGCCCGTGAAGAT-3′. Cu/Zn-SOD (387 bp), sense: 5′-GCAGAAGGCAAGCGGTGAAC-3′ and antisense: 5′-GCAGAAGGCAAGCGGTGAAC-3′. GAPDH (339 bp), sense: 5′-TCCCAGAGCTGACGGGAAGCTCACTG-3′ and antisense: 5′-TGGAGGCCATGTAGGCCATGAGGTCCA-3′.
The reaction of PCR was performed in a final volume of 50 μL containing cDNA (2 μL), dNTP Mix (200 μmol/L), Taq DNA polymerase (1.25 U), forward and reverse primers (0.4 μmol/L, resp.), 10× PCR buffer (5 μL), and DEPC water (36.5 μL). The conditions of PCR were as follows: initial denaturation was done at 95°C for 3 min and followed by denaturation at 94°C for 30 s, 30 s of annealing at 53°C for p47phox, 58°C for Cu/Zn-SOD, 60°C for GAPDH, and 1 min for extension at 72°C. Different numbers of PCR cycles were performed to define the range in which the cycle number was linearly related to the amount of PCR-amplified product. The optimal number of cycles was 28 for GAPDH, 30 for Cu/Zn-SOD, and 32 for p47phox. GAPDH was used as an internal control. The gene expression levels were evaluated using image J software and normalized to the optical density of GAPDH in each sample.
2.6. Western Blot Analysis
Proteins (40 μg) of renal homogenates were separated by electrophoresis on a sodium dodecyl sulfate polyacrylamide gel. The proteins were transferred electrophoretically to nitrocellulose membranes, then incubated with the primary antibodies against p47phox (1 : 800), Cu/Zn-SOD (1 : 300) and β-actin (1 : 400) overnight and with the correspondent secondary peroxidase-conjugated anti-rabbit or mouse antibodies. The blots were visualized using enhanced chemiluminescence kit (Pierce, Rockford, IL) and evaluated by densitometry using image J software. The intensity of the bands was normalized to that of β-actin.
2.7. Immunohistochemistry
Sections (5 μm thick) of paraffin-embedded kidney tissues were deparaffinized with three changes of xylene and rehydrated in a series of graded alcohol. Endogenous peroxidase activity was eliminated by treatment with 3% H2O2 for 10 min. After rinsing with phosphate-buffered saline (PBS; pH 7.4), the sections were blocked with 5% BSA for 20 min at room temperature. Primary anti-MDA (1 : 1000) and antinitrotyrosine (1 : 300) antibodies were applied to the sections and left overnight at 4°C. In negative control studies, the antibodies were substituted by PBS and the same concentration of nonimmune mouse or rabbit immunoglobulin G (IgG), respectively. After rinsing with PBS, the kidney sections were incubated with biotinylated second antibody for 20 min at 37°C. They were then incubated with the streptavidin biotin complex (SABC kit, Boster Biotechnology Inc., China) for an additional 30 min at 37°C and rinsed again. Successively, sections were immersed in a solution of 3,3-diaminobenzidine and 0.02% H2O2. Finally, sections were counterstained with hematoxylin, dehydrated, and mounted. The slides were examined under a microscope and were photographed.
For semiquantitative analysis, the sections were evaluated using the Image-Pro Plus 6.0 Software (Media Cybernetics, USA). The mean optical density (result of integrated optical density divided by the sum of detected area) was calculated for arbitrary areas, measuring 10 fields for each sample (immunostaining for MDA and nitrotyrosine were measured in glomeruli and cortical region, resp.). Data were pooled to calculate a mean value, and a statistical analysis was applied to compare the results obtained from different experimental groups.
2.8. Statistical Analysis
Data were expressed as mean ± SD. For statistical analysis, we used one-way ANOVA followed by Newman-Keuls tests. P < 0.05 was considered statistically significant.
3. Results
3.1. Physiological Indices
As shown in Table 1 and Figure 1, BW was similar in all groups at baseline. After the rats continually fed with the HFS diet and 20% sucrose solution over 16 weeks, BW and value of BW gain in the model group were significantly increased and not significantly influenced by any of drug therapies. The serum level of insulin in the model group was significantly increased (P < 0.05 versus control group). The HOMA-ISI was obviously decreased in the model group compared with the control group (P < 0.05). Treatments with pioglitazone alone and with combination of losartan and pioglitazone both resulted in increased HOMA-ISI and decreased insulin level to the similar level (P < 0.05 versus model group). In addition, there were no significant differences in glucose concentration among all experimental groups (data not shown).
Table 1.
Comparison of physiological indices in different experimental groups.
| Groups | BW gain (g) | Obesity index | LN insulin (m IU/mL) |
HOMA-ISI | 24 h UAE (μg/100 g BW) |
|---|---|---|---|---|---|
| Control | 246.7 ± 30.6 | 315.9 ± 15.8 | 3.54 ± 0.26 | 0.054 ± 0.009 | 2.45 ± 0.53 |
| Model | 353.4 ± 29.4† | 347.0 ± 7.3† | 4.38 ± 0.18† | 0.039 ± 0.005† | 6.14 ± 0.89† |
| Losartan (L) | 360.2 ± 62.8† | 347.2 ± 9.4† | 4.44 ± 0.17†# | 0.037 ± 0.007†# | 4.45 ± 0.85∗†# |
| Pioglitazone (P) | 368.8 ± 30.7† | 342.9 ± 13.1† | 3.88 ± 0.33* | 0.051 ± 0.006* | 4.20 ± 0.70∗†# |
| Combination (L + P) | 365.3 ± 46.5† | 345.8 ± 17.7† | 4.05 ± 0.20†∗ | 0.051 ± 0.011* | 3.35 ± 0.55∗† |
Values are expressed as mean ± SD, n = 6-7 per group. *P < 0.05 versus model group. † P < 0.05 versus control group. # P < 0.05 versus L + P group. Body weight (BW) gain was calculated by subtracting the initial weight from the final weight. Obesity index was calculated as the cubic root of BW (g) divided by body length (cm) × 103. LN insulin: natural logarithm-transformed insulin; HOMA-ISI: homeostasis model assessment insulin sensitivity index.
Figure 1.
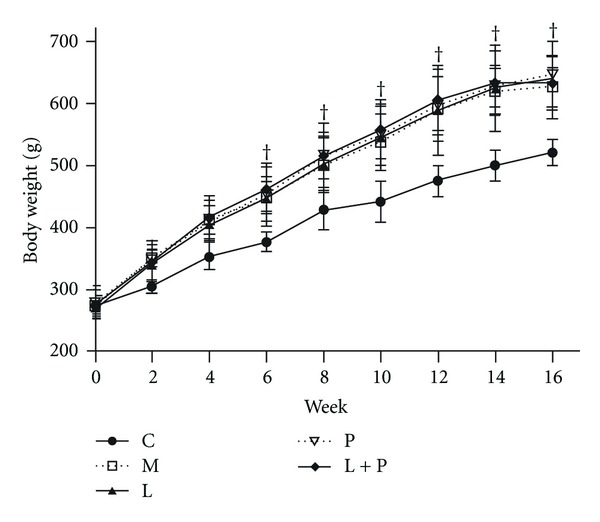
Comparison of body weight in different groups. Values are expressed as mean ± SD, n = 6-7 per group. † P < 0.05 versus control group. C: control; M: model; L: losartan; P: pioglitazone; L + P: losartan and pioglitazone.
As shown in Table 1, rats on the abnormal diet showed increased level of 24 h urinary albumin excretion (UAE) but not urinary protein excretion (data not shown). These findings suggested that the model rats were suffering from relatively early stage of renal lesions. Losartan, pioglitazone, and their combination attenuated the increase of UAE (P < 0.05 versus model group). Treatment with the combination yielded a further reduction in UAE than administration of either drug alone (P < 0.05 versus model group, P < 0.05 versus control group).
3.2. Renal MDA Content and Expression
As shown in Figure 2(a), mild positive staining of MDA, a marker of lipid peroxidation, was observed in some of the glomeruli of control rats. Moderate positive staining was observed in the proximal tubular cells. In the kidneys of model rats, increased immunostaining was seen in the glomeruli (Figure 2(b)), as compared with the control rats. The abnormal diet also caused a consistent increase of renal MDA content in the model rats (Figure 3). Treatment with losartan, pioglitazone, and their combination reduced MDA content and expression (P < 0.05 versus model group). Combination therapy resulted in a further reduction than administration of either drug alone (Figures 2(c)–2(f) and 3).
Figure 2.

Effects of losartan (L), pioglitazone (P), and their combination (L + P) on immunohistochemical staining of malondialdehyde (MDA) in glomeruli. Representative glomerular micrographs from the control (a), model (b), L-treated (c), P-treated (d), and L + P-treated (e) rats. Histogram (f) represents quantitative analysis (mean optical density) of MDA expression in each experimental group. Results are expressed as mean ± SD, n = 6-7 per group. *P < 0.05 versus model group. † P < 0.05 versus control group. # P < 0.05 versus L + P group.
Figure 3.
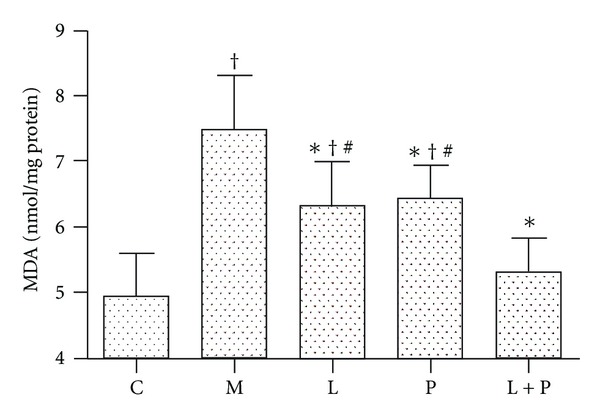
Effects of losartan (L), pioglitazone (P), and their combination (L + P) on renal malondialdehyde (MDA) content. Values are expressed as mean ± SD, n = 6-7 per group. *P < 0.05 versus model group. † P < 0.05 versus control group. # P < 0.05 versus L + P group. C: control; M: model.
3.3. Renal T-SOD Activity
As shown in Figure 4, the T-SOD activity was decreased in the model group compared with the control group (P < 0.05). Treatment with losartan, pioglitazone, and their combination resulted in increased T-SOD activity to the similar level (P < 0.05 versus model group, P > 0.05 versus control group).
Figure 4.
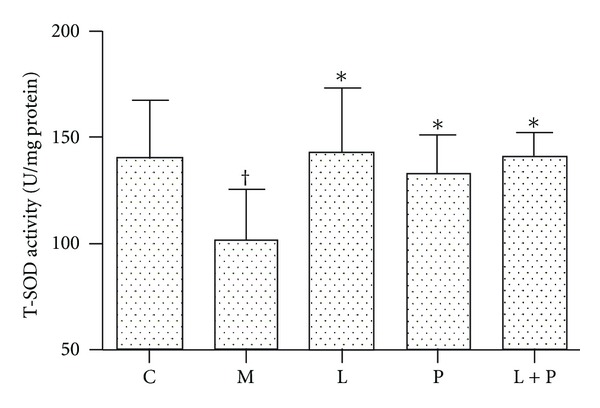
Effects of losartan (L), pioglitazone (P), and their combination (L + P) on renal total superoxide dismutase (T-SOD) activity. Values are expressed as mean ± SD, n = 6-7 per group. *P < 0.05 versus model group. † P < 0.05 versus control group. C: control; M: model.
3.4. Expression of Nitrotyrosine
As shown in Figure 5(a), in the control group, nitrotyrosine expression was seen in some of the proximal and distal tubules of renal cortex. The model rats showed a significant upregulation of nitrotyrosine immunoexpression in the glomeruli as well as cortical proximal and distal tubules (Figure 5(b)). Losartan and pioglitazone treatment significantly decreased renal nitrotyrosine expression (P < 0.05 versus model group, P < 0.05 versus control group). Furthermore, combination therapy resulted in a synergistic effect in reducing renal nitrotyrosine expression to almost the normal level as compared with monotherapy (P < 0.05 versus model group, P > 0.05 versus control group, Figures 5(c)–5(f)).
Figure 5.

Effects of losartan (L), pioglitazone (P), and their combination (L + P) on immunohistochemical staining of nitrotyrosine in renal cortex. Representative micrographs of renal cortex from the control (a), model (b), L-treated (c), P-treated (d), and L + P-treated (e) rats. Histogram represents quantitative analysis (mean optical density) of nitrotyrosine expression (f) in each experimental group. Values are expressed as mean ± SD, n = 6-7 per group. *P < 0.05 versus model group. † P < 0.05 versus control group. # P < 0.05 versus L + P group.
3.5. Expression of Renal p47phox
RT-PCR (Figure 6(a)) and Western blot (Figure 6(b)) analysis demonstrated that mRNA and protein expression levels of p47phox were significantly increased in the kidney of model rats. Losartan and pioglitazone reduced the overexpression of renal p47phox at transcription and translation levels (P < 0.05 versus model group, P < 0.05 versus control group). However, combination therapy further reduced the expression of p47phox to almost the normal level compared with monotherapy (P < 0.05 versus model group, P > 0.05 versus control group).
Figure 6.
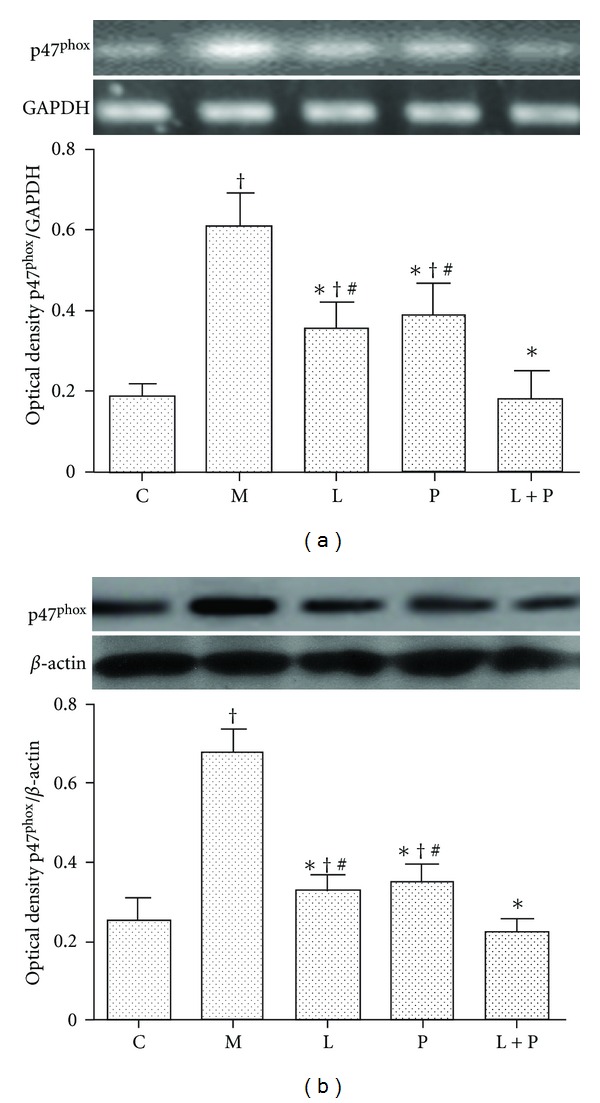
Effects of losartan (L), pioglitazone (P), and their combination (L + P) on expression of p47phox in kidney. NADPH oxidase subunit p47phox mRNA (a) and protein (b) expression was detected by RT-PCR and western blot analysis, respectively. Panels show representative bands and histograms represent optical density values normalized to the corresponding GAPDH or β-actin. Values are expressed as mean ± SD, n = 4-5 per group. *P < 0.05 versus model group. † P < 0.05 versus control group. # P < 0.05 versus L + P group. C: control; M: model.
3.6. Expression of Renal Cu/Zn-SOD
RT-PCR (Figure 7(a)) and Western blot (Figure 7(b)) analysis demonstrated that Cu/Zn-SOD expression was decreased in the model group (P < 0.05 versus control group). Treatment with losartan, pioglitazone, and their combination obviously increased the mRNA and protein expression of Cu/Zn-SOD in the kidney to the similar level (P < 0.05 versus model group, P > 0.05 versus control group).
Figure 7.
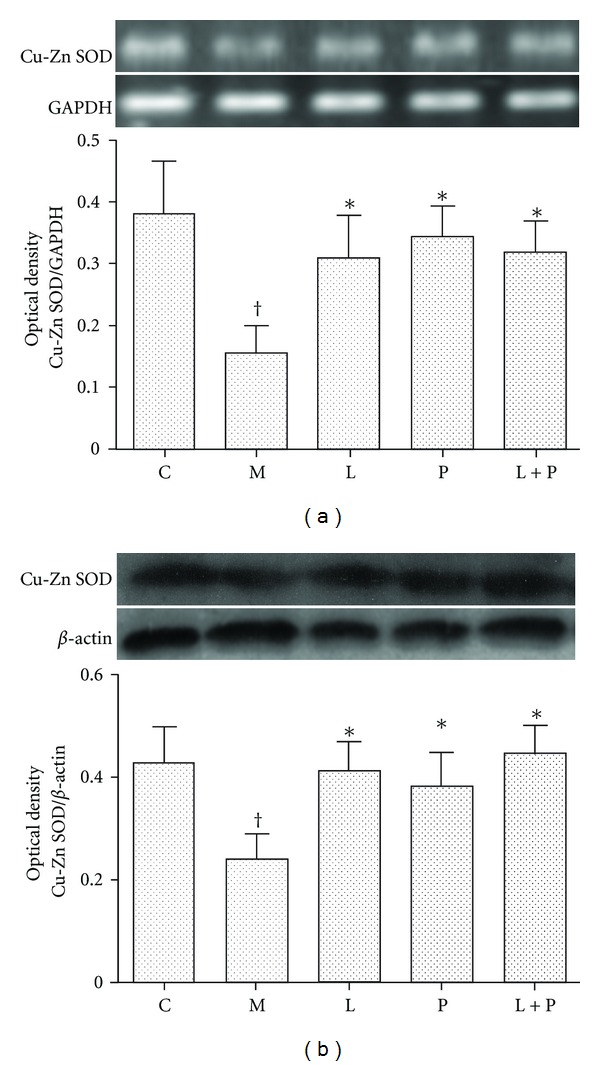
Effects of losartan (L), pioglitazone (P), and their combination (L + P) on expression of Cu/Zn-SOD in kidney. Cu/Zn-SOD mRNA (a) and protein (b) expression was detected by RT-PCR and western blot analysis, respectively. Panels show representative bands and histograms represent optical density values normalized to the corresponding GAPDH or β-actin. Values are expressed as mean ± SD, n = 4-5 per group. *P < 0.05 versus model group. † P < 0.05 versus control group. C: control; M: model.
4. Discussion
In our previous study [7], we demonstrated that SD rats developed abdominal obesity, dyslipidemia, and hypertension after receiving the HFS diet and 20% sucrose solution for 16 weeks. Treatments with pioglitazone and combination of losartan and pioglitazone improved the abdominal obesity and dyslipidemia. Combination therapy provided synergistic effects in reducing the elevated systolic blood pressure and improving renal lesions. However, these effects were not connected with amelioration of the renal vascular endothelial growth factor mRNA and protein expression. Therefore, we could only conclude that the renoprotective effects were partially blood pressure dependent at this time. This study was designed to further explore the underlying mechanisms of additive renoprotection provided by combination therapy.
The major conclusions to be drawn from this study were (1) renal lesions in the HFS diet and 20% sucrose solution induced model rats were associated with and, at least in part, due to oxidative and nitrative stress. The increased MDA level, p47phox (a cytoplasmic subunit of NADPH oxidase), and nitrotyrosine expression as well as the decreased T-SOD activity and Cu/Zn-SOD expression in the kidney were tangible evidence for the presence of oxidative and nitrative stress; (2) these abnormal changes mentioned above were improved by treatment with both drugs, individually and in combination; and (3) combination therapy was associated with lower MDA level, p47phox, and nitrotyrosine expression than monotherapy.
Enhanced levels of reactive oxygen species (ROS), leading to a state of oxidative stress, have been shown to be present in rats with a high-sodium or a high-fat, high-sucrose diet [14, 15]. Excessive ROS, if not controlled by the endogenous antioxidant systems, can lead to lipid peroxidation. In our study, the HFS diet and sucrose solution induced a marked state of oxidative stress in the model rats, directly evidenced by the obviously raised renal MDA (the final product of lipid peroxidation) content and expression. Treatment with losartan and pioglitazone for 8 weeks reduced MDA to the similar level. Interestingly, combination therapy yielded a further decrease in MDA level compared with administration of either drug alone. These data indicate that the synergistic effects in improving the renal lesions provided by combination therapy might be attributed, at least in part, to a further reduction of oxidative stress.
Oxidative stress can result from either excess ROS production and/or deficient antioxidant capacity. NADPH oxidase has recently been characterized in several cell lines and shown to be a major source of superoxide anion (O2 −, the main species of ROS) in the kidney and cardiovascular tissues [25–27]. Cu/Zn-SOD plays an important role in the oxygen defense mechanism. In the present study, we found significantly increased p47phox expression, decreased Cu/Zn-SOD expression, and reduced T-SOD activity in the kidney of model rats. Satoh et al. [16] illustrated that losartan attenuates glomerular ROS production in rats with experimental diabetic nephropathy. De Cavanagh et al. [17] found that losartan significantly prevents renal artery SOD activity reduction in salt-loaded spontaneously hypertensive rats. Furthermore, Toblli et al. [18] reported that pioglitazone reduces renal MDA content in obese Zucker rats. Yang et al. [19] demonstrated that pioglitazone increases Cu/Zn-SOD and decreases NADPH oxidase protein expression in rats with aging-related progressive renal injury. Consistent with these recent reports, in our experimental conditions, losartan and pioglitazone obviously reduced renal p47phox expression, increased Cu/Zn-SOD expression, and enhanced T-SOD activity. Interestingly, combination therapy showed an additive effect on the renal p47phox expression. Taken together, combination therapy provides a synergistic effect in reducing the renal oxidative stress through a further downregulation of NADPH oxidase expression.
Of note, excessive ROS production can lead to nitrative stress. O2 − reacts avidly with nitric oxide to generate peroxynitrite, which reacts with tyrosine residues to produce nitrotyrosine and is frequently used as a stable marker for nitrative stress [28]. In the present study, the increased renal nitrotyrosine expression was the direct evidence for presence of nitrative stress. Thus, oxidative and nitrative stress occurred at the same time in the kidney of our model rats. Losartan and pioglitazone reduced nitrotyrosine expression to the similar level. Interestingly, combination therapy was associated with less renal nitrotyrosine expression than monotherapy. These results suggest that another cause of the additive renoprotection provided by combination therapy is due to its further reduction of nitrative stress. Furthermore, this synergistic antinitrative effect is also made possible through a further downregulation of NADPH oxidase expression.
Acknowledgments
This research was supported by grants from the Program of Natural Science Foundation of Education Department of Anhui Province (no. KJ2010B466). The authors deeply appreciate the helpful assistance of Professor Ji-shou Hou in revising this paper.
Abbreviations
- MDA:
Malondialdehyde
- T-SOD:
Total superoxide dismutase
- Cu/Zn-SOD:
Copper, zinc-superoxide dismutase
- NADPH:
Nicotinamide adenine dinucleotide phosphate
- ROS:
Reactive oxygen species.
References
- 1.Roberts CK, Barnard RJ, Sindhu RK, Jurczak M, Ehdaie A, Vaziri ND. A high-fat, refined-carbohydrate diet induces endothelial dysfunction and oxidant/antioxidant imbalance and depresses NOS protein expression. Journal of Applied Physiology. 2005;98(1):203–210. doi: 10.1152/japplphysiol.00463.2004. [DOI] [PubMed] [Google Scholar]
- 2.Amin KA, Kamel HH, Abd Eltawab MA. Protective effect of garcinia against renal oxidative stress and biomarkers induced by high fat and sucrose diet. Lipids in Health and Disease. 2011;10, article 6 doi: 10.1186/1476-511X-10-6. [DOI] [PMC free article] [PubMed] [Google Scholar]
- 3.Andrews P, Karadaghi PA, Memon S, et al. No effect of high sucrose diets on the kidneys of wister kyoto (WKY) rats. Geriatric Nephrology and Urology. 1992;2(1):35–42. [Google Scholar]
- 4.Cianciaruso B, Bellizzi V, Minutolo R, et al. Salt intake and renal outcome in patients with progressive renal disease. Mineral and Electrolyte Metabolism. 1998;24(4):296–301. doi: 10.1159/000057385. [DOI] [PubMed] [Google Scholar]
- 5.Gu JW, Bailey AP, Tan W, Shparago M, Young E. Long-term high-salt diet causes hypertension and decreases renal expression of vascular endothelial growth factor in sprague-dawley rats. Journal of the American Society of Hypertension. 2008;2(4):275–285. doi: 10.1016/j.jash.2008.03.001. [DOI] [PMC free article] [PubMed] [Google Scholar]
- 6.Fiore MC, Jimenez PM, Cremonezzi D, Juncos LI, García NH. Statins reverse renal inflammation and endothelial dysfunction induced by chronic high salt intake. The American Journal of Physiology. 2011;301(2):F263–F270. doi: 10.1152/ajprenal.00109.2010. [DOI] [PubMed] [Google Scholar]
- 7.Kong X, Zhang DY, Wu HB, Li FX. Losartan and pioglitazone ameliorate nephropathy in experimental metabolic syndrome rats. Biological and Pharmaceutical Bulletin. 2011;34(5):693–699. doi: 10.1248/bpb.34.693. [DOI] [PubMed] [Google Scholar]
- 8.Jin HM, Pan Y. Renoprotection provided by losartan in combination with pioglitazone is superior to renoprotection provided by losartan alone in patients with type 2 diabetic nephropathy. Kidney and Blood Pressure Research. 2007;30(4):203–211. doi: 10.1159/000104089. [DOI] [PubMed] [Google Scholar]
- 9.Namikoshi T, Tomita N, Satoh M, et al. Pioglitazone enhances the antihypertensive and renoprotective effects of candesartan in zucker obese rats fed a high-protein diet. Hypertension Research. 2008;31(4):745–755. doi: 10.1291/hypres.31.745. [DOI] [PubMed] [Google Scholar]
- 10.Lai KN, Chan LYY, Guo H, Tang SCW, Leung JCK. Additive effect of PPAR-γ agonist and ARB in treatment of experimental IgA nephropathy. Pediatric Nephrology. 2011;26(2):257–266. doi: 10.1007/s00467-010-1703-y. [DOI] [PubMed] [Google Scholar]
- 11.Kong X, Yang JR, Guo LQ, et al. Sesamin improves endothelial dysfunction in renovascular hypertensive rats fed with a high-fat, high-sucrose diet. European Journal of Pharmacology. 2009;620(1–3):84–89. doi: 10.1016/j.ejphar.2009.08.023. [DOI] [PubMed] [Google Scholar]
- 12.Salvemini D, Doyle TM, Cuzzocrea S. Superoxide, peroxynitrite and oxidative/nitrative stress in inflammation. Biochemical Society Transactions. 2006;34(5):965–970. doi: 10.1042/BST0340965. [DOI] [PubMed] [Google Scholar]
- 13.Schnackenberg CG. Physiological and pathophysiological roles of oxygen radicals in the renal microvasculature. The American Journal of Physiology. 2002;282(2):R335–R342. doi: 10.1152/ajpregu.00605.2001. [DOI] [PubMed] [Google Scholar]
- 14.Roberts CK, Vaziri ND, Sindhu RK, Barnard RJ. A high-fat, refined-carbohydrate diet affects renal NO synthase protein expression and salt sensitivity. Journal of Applied Physiology. 2003;94(3):941–946. doi: 10.1152/japplphysiol.00536.2002. [DOI] [PubMed] [Google Scholar]
- 15.Kitiyakara C, Chabrashvili T, Chen Y, et al. Salt intake, oxidative stress, and renal expression of NADPH oxidase and superoxide dismutase. Journal of the American Society of Nephrology. 2003;14(11):2775–2782. doi: 10.1097/01.asn.0000092145.90389.65. [DOI] [PubMed] [Google Scholar]
- 16.Satoh M, Fujimoto S, Arakawa S, et al. Angiotensin II type 1 receptor blocker ameliorates uncoupled endothelial nitric oxide synthase in rats with experimental diabetic nephropathy. Nephrology Dialysis Transplantation. 2008;23(12):3806–3813. doi: 10.1093/ndt/gfn357. [DOI] [PMC free article] [PubMed] [Google Scholar]
- 17.de Cavanagh EM, Ferder LF, Ferder MD, Stella IY, Toblli JE, Inserra F. Vascular structure and oxidative stress in salt-loaded spontaneously hypertensive rats: effects of losartan and atenolol. The American Journal of Hypertension. 2010;23(12):1318–1325. doi: 10.1038/ajh.2010.167. [DOI] [PubMed] [Google Scholar]
- 18.Toblli JE, Ferrini MG, Cao G, Vernet D, Angerosa M, Gonzalez-Cadavid NF. Antifibrotic effects of pioglitazone on the kidney in a rat model of type 2 diabetes mellitus. Nephrology Dialysis Transplantation. 2009;24(8):2384–2391. doi: 10.1093/ndt/gfp103. [DOI] [PMC free article] [PubMed] [Google Scholar]
- 19.Yang HC, Deleuze S, Zuo Y, Potthoff SA, Ma LJ, Fogo AB. The PPARgamma agonist pioglitazone ameliorates aging-related progressive renal injury. Journal of the American Society of Nephrology. 2009;20(11):2380–2388. doi: 10.1681/ASN.2008111138. [DOI] [PMC free article] [PubMed] [Google Scholar]
- 20.Qin J, Zhang Z, Liu J, et al. Effects of the combination of an angiotensin II antagonist with an HMG-CoA reductase inhibitor in experimental diabetes. Kidney International. 2003;64(2):565–571. doi: 10.1046/j.1523-1755.2003.00127.x. [DOI] [PubMed] [Google Scholar]
- 21.Kööbi P, Kalliovalkama J, Jolma P, et al. AT1 receptor blockade improves vasorelaxation in experimental renal failure. Hypertension. 2003;41(6):1364–1371. doi: 10.1161/01.HYP.0000073782.30879.16. [DOI] [PubMed] [Google Scholar]
- 22.Benigni A, Zoja C, Tomasoni S, et al. Transcriptional regulation of nephrin gene by peroxisome proliferator-activated receptor-γ agonist: molecular mechanism of the antiproteinuric effect of pioglitazone. Journal of the American Society of Nephrology. 2006;17(6):1624–1632. doi: 10.1681/ASN.2005090983. [DOI] [PubMed] [Google Scholar]
- 23.He Z, Yu S, Mei G, et al. Maternally transmitted milk containing recombinant human catalase provides protection against oxidation for mouse offspring during lactation. Free Radical Biology and Medicine. 2008;45(8):1135–1142. doi: 10.1016/j.freeradbiomed.2008.07.019. [DOI] [PubMed] [Google Scholar]
- 24.Fang H, Li Y, Du S, et al. Variant rs9939609 in the FTO gene is associated with body mass index among Chinese children. BMC Medical Genetics. 2010;11(1, article 136) doi: 10.1186/1471-2350-11-136. [DOI] [PMC free article] [PubMed] [Google Scholar]
- 25.Vaziri ND. Roles of oxidative stress and antioxidant therapy in chronic kidney disease and hypertension. Current Opinion in Nephrology and Hypertension. 2004;13(1):93–99. doi: 10.1097/00041552-200401000-00013. [DOI] [PubMed] [Google Scholar]
- 26.Chabrashvili T, Tojo A, Onozato ML, et al. Expression and cellular localization of classic NADPH oxidase subunits in the spontaneously hypertensive rat kidney. Hypertension. 2002;39(2):269–274. doi: 10.1161/hy0202.103264. [DOI] [PubMed] [Google Scholar]
- 27.Taniyama Y, Griendling KK. Reactive oxygen species in the vasculature: molecular and cellular mechanisms. Hypertension. 2003;42(6):1075–1081. doi: 10.1161/01.HYP.0000100443.09293.4F. [DOI] [PubMed] [Google Scholar]
- 28.Halliwell B. What nitrates tyrosine? Is nitrotyrosine specific as a biomarker of peroxynitrite formation in vivo. FEBS Letters. 1997;411(2-3):157–160. doi: 10.1016/s0014-5793(97)00469-9. [DOI] [PubMed] [Google Scholar]


