Abstract
Nanoparticle delivery into solid tumors is affected by vessel density, interstitial fluid pressure (IFP) and collagen, as shown here by contrasting the in vivo macroscopic quantitative uptake of 40 nm fluorescent beads in three tumor types. The fluorescence uptake was quantified on individual animals by normalization with the transmitted light and thennormalized to normal tissue uptake in each mouse. Mean data for uptake in individual tumor lines then showed expected trends with the largest uptake in the most vascularized tumor line. Tumor lines with increased collagen were also consistent with highest interstitial fluid pressure, and correlated with lowest uptake of nanoparticles. The data is consistent with a delivery model indicating that while vascular permeability is maximized by neovascular growth, it is inhibited by collagen content and the resulting interstitial pressure. Imaging of these parameters in vivo can lead to better individual non-invasive methods to assess drug penetration in situ.
Keywords: fluorescence, pressure, collagen, cancer, microenvironment
1.0 Introduction
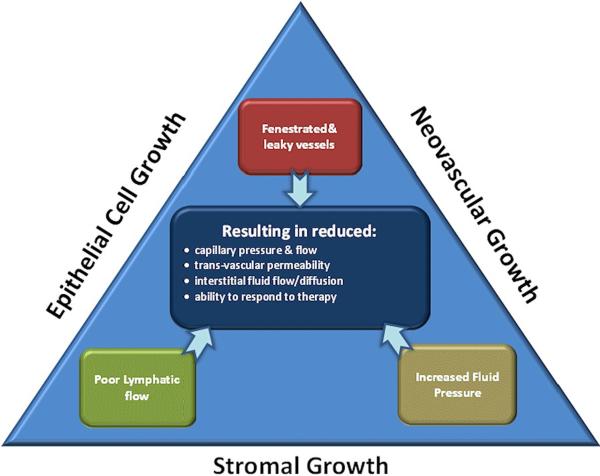
The use of nanoparticlesas a vehicle for delivering anti-cancer therapeutics, or as therapeutic agents themselves, has been widely explored in recent years[1–3]. The promise of nanoparticle mediated imaging or therapy is to increase the delivered payload of imaging or therapeutic agents, or to take advantage of their specialized properties which can have biochemical or cell surface functionalization otherwise not available [4][5]. One of the key elusive challenges in this area is to fully understand and exploit the delivery within tumors, because the biomechanical dynamics of delivery are complex and heterogeneous on a microscopic scale. Nanoparticles of appropriate size and surface protection can have high bioavailability for circulation in the plasmaand accumulate in tumors via leaky vasculature [6]. However, nanoparticles appear to face greater physical challenges in penetrating tumors, as compared to small molecules. Infact, the effectiveness of nanoparticle delivery may be fundamentally limited if the impact of pathophysiological barriers on nanoparticle drug delivery is not better understood and tools to image the pertinent factors are not developed[7]. While individual studies attribute the penetration limitation to either interstitial pressure or stromal barriers, these can just be symptoms of the underlying factors in the tumor. Epithelial, neovascular and stromal growth can lead to increased vascular leakage, increased interstitial pressure, reduced lymphatic function and reduced blood flow, as illustrated in Figure 1. Each of these latter effects reduce nanoparticle penetration to some degree, and yet while connected, the approach to solving these issues may vary depending upon the effect and cause. The research presented hereattempts to correlate quantitative fluorescence molecular spectroscopy measurements of nanoparticle uptake in vivo with pathophysiological factors limiting their delivery. The measurements are collected from three tumor linesthat present a systematically varying range of vascular densities, collagen densities and interstitial pressures to try and interpret the relative contributions of each to limiting particle delivery.
Figure 1.
Tumor transport dynamics are influenced by the physical growth of tumor epithelial cells, neovasculature and stroma in the tumor. These contribute to the internal effects of lymphatic flow constriction, leaky vessels and increased interstitial fluid pressure. These effects are all observed by imaging as reduction in capillary pressure, permeability, flow/diffusion into the tumor, and inability to respond to therapy.
A key determinant in the delivery of therapeutic agents to solid tumors is interstitial fluid pressure (IFP) [5], because it is the driving component in transvascular permeability (see Figure 1). Neovasculature growth and has features of vessel fenestration and flow heterogeneity resulting in leakiness, and the lack of functional lymphatic outflow in tumors is well documented[8]. The net result of these three factors is increased IFP, resulting from increased fluid flux into tumors [9–13]. Elevated IFP is hypothesized to be a major barrier in the transport of macromolecules and nanoparticles because convection out of the blood vessels requires a pressure gradient to cause the flow[14–15]. Transport of small molecules in the tumor interstitial space still occursby diffusion, which is concentration-driven, whereas transport of larger molecules is more dominated by convection [16][5]. In tumors the net static convection flow is outward from the core of the tumor, preventing effective penetration of macromolecules inside the solid mass [17][18].
Much research focus is devoted to epithelial cell growth since this plays an important role in the tumorigenesis of many solid tumors, where increased levels of collagen in tumors can increase the observed stiffness of tumors[19][20]. The signaling of fibroblasts within the tumor epithelium is complex and leads to increased synthesis of extracellular matrix proteins (ECM), which contribute to the tensile rigidity[21]. A high collagen level in tumor ECM is responsible for the observed stiffness in some incurable tumors, such as pancreatic adenocarcinoma[22]. Elevated levels of collagen are correlated with poor prognosis andmetastasis in a number of tumors[22–24] and is documented to be a barrier in the transport of a variety of therapeutics, ranging from small-molecular-weight drugs to nanoparticles [25–27]. There has been a peak of interest in therapeutics designed to reduce the collagen density, which has the collateral effect of decreasing interstitial fluid pressure and thereby allowing increased drug penetration[18][28].
To study the complex dynamics of nanoparticle delivery in tumors, independent of charge or biochemical binding, intravital imaging has perhaps given the most mechanistic information [29]. In this and earlier work, an ultrasound-coupled handheld-probe-based optical fluorescence molecular tomography (FMT) system was developed to perform quantification of fluorescence in vivo. The design couples fiber-based spectral optical fluorescence samplingwith high frequency ultrasound imaging for sequential imaging of uptake[30][31]. The value of this system in studying tumors of various tissue properties such as vascular and collagen density is that there is potential to combine elastography[32][33] imaging with drug uptake imaging, if the added information has diagnostic value when interpreted together. This study tested for correlations between nanoparticle with vascular volume, collagen fraction, and interstitial pressure using three tumors in vivo of varying stiffness and vascular volume.
2.0 Material and Methods
2.1Xenograft Tumors in Animals
All animal procedures done under a protocol approved by the Dartmouth Institutional Animal Care and Use Committee (IACUC). The tumor lines used included pancreatic adenocarcinoma, AsPC-1, rat glioscarcoma tumor cells, 9L and the human epithelial cancer, A431. A total of 21 female athymic nude mice were used for each tumor line, implanted via injection of 1×10⁶ cells, in 50% Matrigel® (BD Biosciences, San Jose, CA), and 50% complete media, subcutaneously into the right flank. Tumors were allowed to grow for a period of two to three weeks, until reaching average diameter 4–10 mm.
2.3 Fluorescence Measurement of Nanoparticles
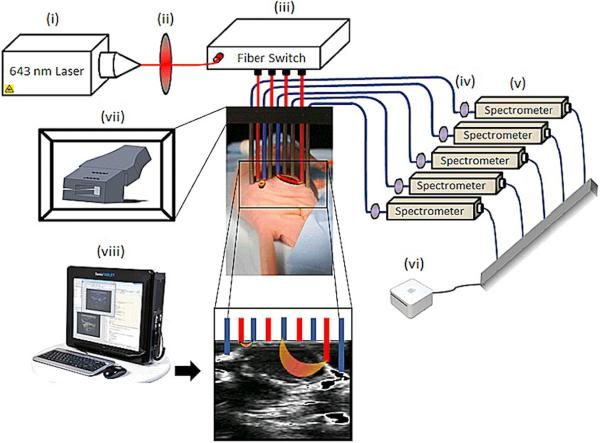
The mice were injected with 200 μl of 5% FluoSpheres® Carboxylate-Modified microsphere solution (Invitrogen) [34], having 0.04 μm diameter size, with the excitation peak at 660 nm and emission peak at 680 nm. Ultrasound guidance was used to determine location of fluorescence measurements obtained from the tumor and normal tissues of the mice. The apparatus is shown in Figure 2, composed of four sources and five detectors interspersed linearly and held in a fiber probe holder placed above the tumor. Source laser light at 643 nm wavelength, going through 600-μm diameter fibersand through a short pass interference filter removing light above 650 nm. The excitation light went through a fiber switch (Piezosystemjena, Hopedale, MA) to route to different fibers. The fluorescent emission was detected in parallel by five USB-coupled spectrometers (Ocean Optics, Dunedin, Florida, model USB2000+). This configuration allows light to be detected through multiple path lengths of tissue under electronic control. The detection light was filtered through a 650 nm long pass filter. Ambient dark baseline data were collected prior and subtracted from each emission spectra. The area under the curve of the calibrated fluorescence was integrated to produce final fluorescence data, and this was normalized by the integrated transmittance data at the excitation wavelength for the same fiber. The ratio of fluorescence to transmittance is known to be largely independent of the tissue optical properties and allows superior quantitative comparison of longitudinal data and also averaging of data between animals [35–37].
Figure 2.
Instrumentation: Schematics of an Ultrasound coupled FMT imaging setup. Light from a 643 nm laser diode (i) is routed through a short pass filter (ii) to a 1×4 fiber switch (iii) to illuminate the target sequentially in each of 4 possible locations. Emitted fluorescent light is subsequently routed through one or two (transmission mode or fluorescence mode) long pass filters (iv) to a separate spectrometer for each pick up fiber (v). The computer (vi) acquires and analyzes the data from spectrometers, removing background autofluorescence. Ultrasound (viii) is coupled to the optical probes via a fiber holder (vii) to localize the fiber positioning in this study.
2.4 Interstitial Fluid Pressure (IFP)
The interstitial fluid pressure was measured using an optical fiber-coupled pressure sensor (model FOP-M260m, Evolution, QC, Canada)with 0.2MHz sampling rate [38]. The tumor was punctured with a 25 gauge needle, and the IFP probe inserted halfway into the tumor. After insertion, the optical fiber connected to the probe was gently released so that the pressure stabilized asymptotically to the value recorded.
2.5 Staining forVascular Density&Collagen Content
Endothelial cell surface receptor CD31 was used as a marker for tumor vasculature, using immunostaining for antiCD31 on frozen sections. To quantify collagen content, tumor sections were subsequently paraffin embedded; thin sectioned (4μM) and stained with Masson's trichrome stain. Sections were viewed at 20× and color images captured. Images were converted to HSV (Hue-Saturation-Value) space and thresholded based upon the blue stain hue, average saturation, and average value were applied to isolate stromal content. The area ratio of blue stain relative to the entire field was then calculated to determine the percent collagen content for each image. The vascular density was quantified through thresholding of the CD31 immunostained slides.
3.0 Results
3.1 Fluorescence nanoparticle uptake
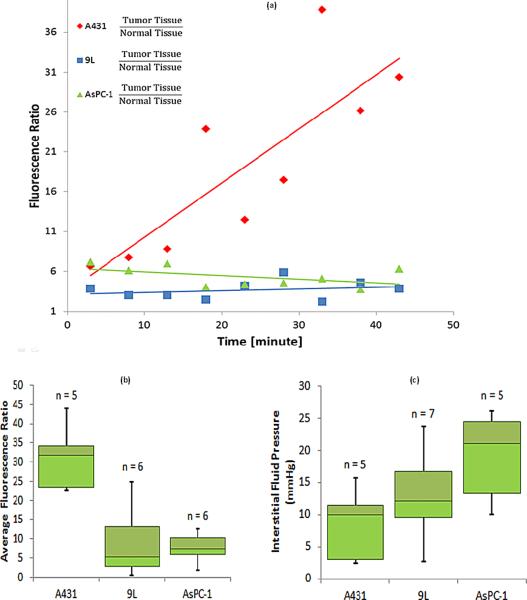
Average fluorescence ratio data (tumor to normal tissue for each mouse)was measured; this normalization was used to account for potential intra-mouse discrepancies in the injected dose. For each mouse, the temporal fluorescence ratio data of tumor to normal tissue was recorded, and the median for each tumor line are shown in Figure 3a. Data was acquired after the nanoparticle injections, at five minute intervals for forty five minutes. The initial 3 minutes where plasma redistribution largely dominates the transient (rapid increase and decrease) was not presented here. The data after the first three minutes was monotonic on average for all mice, but the data in Figure 3a illustrates how A431 tumors had increasing uptake over time, whereas the AsPC-1 and 9L tumors haverespectively decreasing and flat uptake over time. Figure 3b, shows the average of the temporal nanoparticle uptake for each tumor line, again emphasizing the difference between the A431 tumor line and the 9L and AsPC-1 tumor lines.
Figure 3.
Drug uptake is plotted for individual mice (a), using the median normalized fluorescence measurements with respect to healthy tissue. Average fluorescence ratio values are shown in (b) summarizing the temporal average presence of fluorescent nanoparticles in tumor lines. The interstitial fluid pressure measurements are summarized (c) for each tumor line. The number of animals is denoted above each bar.
3.2 Interstitial Fluid Pressure
Interstitial fluid pressure (IFP) was recorded for each tumor immediately after fluorescence imaging studies, and the average for each tumor was used to pool with the others of the same tumor line. The average numbers for each of the three tumor lines is presented in Figure 3c. The values of the measurements for all the tumor lines were reasonable, and higher than known IFP values of normal tissue [5]. Using a two tailed student's t-test, the IFP values of the A431 tumor line were significantly higher than those of the AsPC-1 tumor line, but no other significant differences were observed(Table 1).
Table 1.
Tabulated P-values from the standard student's t-test validating the difference in pathophysiology and drug uptake between each of tumor lines. The tumor lines with statistically significant difference are highlighted in green.
| Vascular Density | Interstitial Fluid Pressure | Collagen Density | Fluorescence Uptake | |
|---|---|---|---|---|
| A431 vs. 9L | 0.14 | 0.25 | 0.01 | 0.003 |
| A431 vs. AsPC-1 | 6.2×10⁻⁵ | 0.03 | 4×10⁻⁴ | 0.002 |
| 9L vs. AsPC-1 | 0.01 | 0.17 | 0.52 | 0.77 |
3.3 Vascular Density
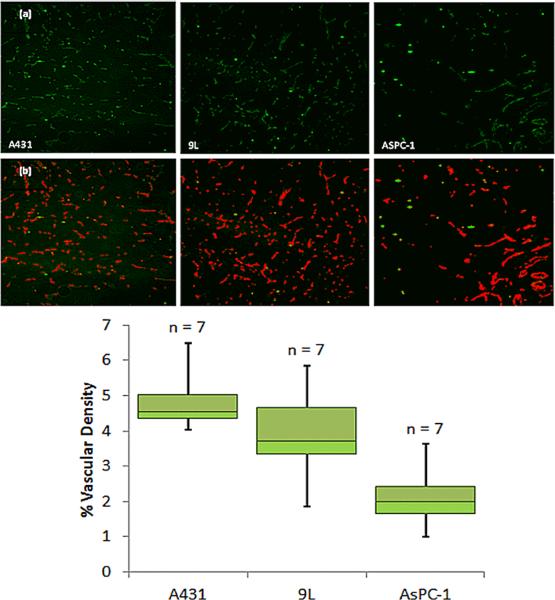
The first row of images in Figure 4 shows representative slides of the CD31 antibody stained tumor sections for A431 (left) 9L tumor (middle) and AsPC-1 (right). The vasculature appears in green, with artifacts appearing as bright green. A representative slide of the thresholded results is shown below each in Figure 4b, with pseudo-color red vessels and the artifacts remain in green. The summary numbers of vascular density as an area ratio for each tumor line is presented in the boxplot in Figure 4c. There are significant differences between the A431 tumor and the 9L and AsPC-1 tumor, while there is no significant difference between the 9L and AsPC-1 tumor (Table 1).
Figure 4.
Immunohistochemical images used to estimate vasculature area is shown in (a) with representative images of CD31 staining for each tumor line. In (b) the blood vessel density is calculated by thresholding raw data and dividing the number of pixels indicating vasculature (Red) by the total number of pixels. This results in (c) a summary of calculated percent vasculature area values for the three tumor lines. Again number of animals is reported above each bar.
3.4 Collagen fraction
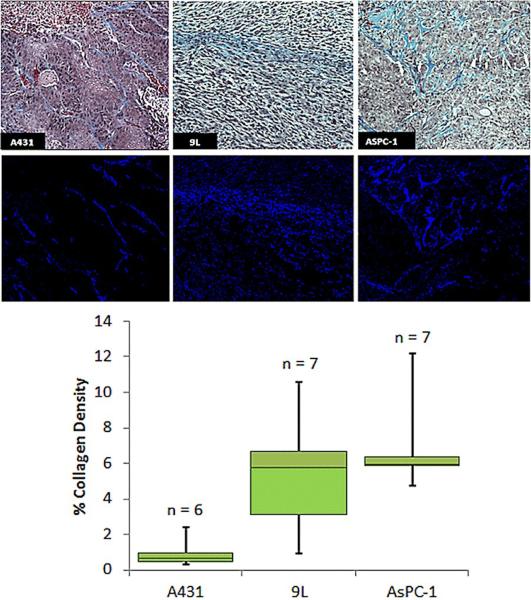
The first row of images in Figure 5a shows representative slides of the Masson'strichrome stained tumor sections for the three tumors. The collagen content appears light blue in color. A representative, slide of the output of the thresholding algorithm is shown below these pseudocolored blue, in Figure 5b, isolating just the collagen. The summary of the result for each tumor line is presented in the boxplot Figure 5c.
Figure 5.
Histochemical analyses of collagen area. (a) Representative images of Masson's Trichrome staining for each tumor line. Collagen Density is calculated by thresholdingof the data to binary images (b) and dividing the number of pixels indicating collagen (dark blue) by the total number of pixels in the image. A summary of the calculated percent collagen area is shown in (c).
There were significant differences between the A431 and the 9L tumor lines, and between A431 and AsPC-1 tumor lines, but not between the AsPC-1 and the 9L tumor lines as shown in Table 1.
4.0 Discussion
The major focus of this study was to quantitatively interpret the uptake of fluorescent nanoparticles in three different tumor lines and to determine which correlates are most important for driving the permeability of the tumor. Each of the relative fluorescence uptake values reported in Figure 3 were normalized by normal tissue values from the same mouse. Ratiometricdata interpretation allows comparison of the signals between animals. The data in Figure 3 shows thatall measurements had a median value higher than unity, indicating thatfluorescence nanoparticles always entermore into the tumor relative to normal tissue, as would be expected for permeability-based delivery in the tumor.
The rate of uptake of nanoparticles, indicated by the slope of the line in Figure 3a, shows increasing fluorescence over time for the A431 tumorand relatively flat uptake for 9L and with a decreasing slope for AsPC-1 tumors. These tumors were again chosen for their disparate vascular and collagen content values, and the difference in uptake kinetics indicates the existence of a dissimilar drug delivery dynamics in these tumor lines. The differences in uptake observed would be driven by the vascular permeability, but uptake over several minutes would also be driven by the interstitial pressure, which would in turn be affected by the vascular density and collagen density. So these major driving factors were assessed for their correlation with the uptake value, using both individual tumor data as well as average tumor line data.
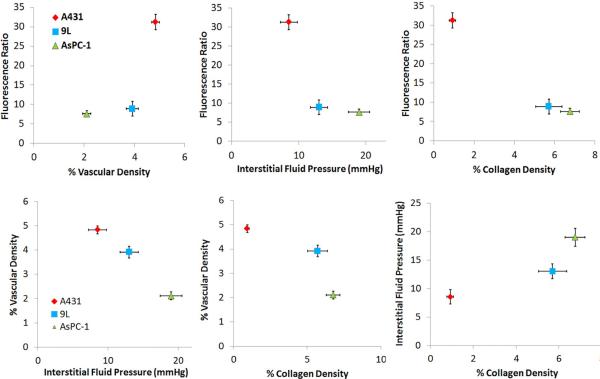
A key part of this study is the illustration that relationships between the driving forces for drug delivery are not well interpreted with a single tumor line, but rather are better elucidated by comparing data between tumor lines. These results are seen in Figure 6, showing that most of the parameters are at least partially correlated to each other. The observed drug dynamics for subcutaneous tumor lines A431 and AsPC-1 are the most different of the three, and the effects seem to be well interpreted from the pathophysiological parameters measured here. The 9L tumor line is moderate in comparison to the extremes of AsPC-1 and A431 for vascular density and collagen content. Higher vessel density in A431 tumors relative to AsPC-1 is correlated to a more pronounced drug accumulation, and the lower fraction of collagen content of A431 tumors likely pose a significantly weaker barrier to the penetration of the nanoparticles into the tumor and lead to the lower interstitial pressure values observed. Just based upon these two tumor lines, one might guess that the impact of vascular area dominates drug accumulation; however, further inspection shows that the 9L tumor line, despite the comparable vessel density, has significantly smaller drug accumulation than the A431 tumor. This observation, together with the comparable collagen densities of the 9L and AsPC-1, suggests that the elevated collagen expression in the 9L tumor acts as either a barrier to nanoparticle delivery or as a booster of IFP, which itself is known to be a prominent barrier to nanoparticle delivery.
Figure 6.
Dependence of the fluorescence is plotted with respect to the analyzed pathophysiological parameters (a) vascular density, (b) interstitial pressure, and (c) collagen density. The data from each tumor type grouped as a single point with the standard error bars shown. Then in (d), (e) and (f) the three pathophysiological parameters are plotted against each other to show their interdependence. Table 2 shows a measure of the strength of this dependence, through the square of the Pearson's correlation coefficient.
IFP is thought to limit vascular permeability because the pressure difference from within the vessel to outside the vessel drives the convection process across the endothelium. In the past few decades there have been several ways to attempt interstitial pressure measurement of tumors, including: 1) “wick-in-needle” (WIN) measurement, 2) micropipettes, 3) micropore chambers for average IFP[14], and 4) fiber optic pressure sensing devices. Each of these methods has its advantages and limitations [40][14], and all are invasive with arguably high variability due to systematic bias from placement errors. Thus, accurately measuring IFPis controversial. The absence of significant difference between the recorded IFP values of A431 and 9L could be attributed to the general controversy that surrounds measuring IFP values, regardless of methods used [41]. All the methods currently used in measuring IFP, involve invasive punctures that can potentially alter the tumor[41][42]. Despite these measurement limitations, the finding that tumors with highest IFP had lowest drug penetrance is convincing
One of the most confounding factors in this type of analysis is the fact that the parameters are all likely interrelated. A linear correlation test aimed at showing the dependence of the drug uptake on any one of the given parameters, regardless of tumor type, failed to verify the existence of any significant correlation, although statistically significant values are observed when the tumor data is interpreted as average numbers, as presented here in Figure 6. This result is attributed to inherently complex simultaneous dependence of drug delivery in each tumor on multiple pathophysiological parameters. However, once the tumors were binned according to tumor type, as shown in Figure 6, a very strong linear correlation with R2=0.98 between the observed means of the average temporal fluorescence ratio and percent collagen content was seen, Figure 6c. Additionally, the correlation was strong, R2 =0.71, for means of the average temporal fluorescence ratio and IFP, Figure 6b. The correlation was not as strong for means of the average temporal fluorescence ratio and percent vascular density, Figure 6a. These values are summarized in Table 2.
Table 2.
Tabulated R2-values from correlation test, summarizing the strength of the dependence of the drug uptake on the pathophysiological parameters, and the functional dependence of theparameterson each other, when the data is binned with respect to tumor type.
| Vascular Density | Interstitial Fluid Pressure | Collagen Density | |
|---|---|---|---|
| Vascular Density | 0.98 | 0.73 | |
| Interstitial Fluid Pressure | 0.82 | ||
| Fluorescence Uptake | 0.62 | 0.71 | 0.98 |
As discussed in the introduction section and illustrated in Figure 1, the complex interplay in tumor growth is inter-related, but one general model for this is that neovascular growth, epidermal growth and stromal growth all together contribute to a number of the features observed. As tumors grow interstitial pressure increases, and this relationship would be consistent with the significant trends of Figure 6d and 6f. This pressure then ultimately limits drug penetration, consistent with the data in Figure 6b.
In this paperbulk uptake of nanoparticles relative to the pathophysiological parameters was assessed through correlation analysis, and while individual tumor lines did not exhibit significant trends, summary average values between tumor lines show expected model trends. Overall, a high presence of collagen appears to pose the most prominent barrier to drug delivery, although it is not clear if it is the collagen itself or the collagen controlled interstitial pressure that imposes the real barrier, or even if there are other inter-related factors related to this. Additionally; high interstitial fluid pressure strongly correlated with the decrease in average drug uptake in tumor lines. It was further shown that barriers to drug delivery can prevent the penetration of nanoparticles even to the tumor line, 9L, with relatively high vasculature. Generally, the data is consistent with a model in which the permeability into the tumor is inhibited by higher interstitial pressure, which in turn shuts down the vasculature and is controlled by collagen growth. These effects are correlative, but appear to be interrelated and further elucidation would require larger numbers of tumor models for better correlation analysis, or through mechanistic interventions to test the role of the individual parameters in drug penetration.
Nanoparticle delivery into solid tumors is affected by vascular density, interstitial fluid pressure (IFP) and collagen content, as studied here through in vivo uptake measurement of 40 nm fluorescent beads into three different tumor types. Tumor lines with increased collagen consistently had the highest interstitial fluid pressure, and correlated with lowest uptake of nanoparticles. A delivery model which explains the results is that while vascular permeability is maximized by neovascular growth, it is inhibited by collagen content and the resulting interstitial pressure.
Acknowledgments
Sources of Support: This work has been financially supported by NIH research grants PO1CA084203, RO1CA109558, RO1CA156177 and R01CA10998.
Footnotes
Publisher's Disclaimer: This is a PDF file of an unedited manuscript that has been accepted for publication. As a service to our customers we are providing this early version of the manuscript. The manuscript will undergo copyediting, typesetting, and review of the resulting proof before it is published in its final citable form. Please note that during the production process errors may be discovered which could affect the content, and all legal disclaimers that apply to the journal pertain.
No conflicts of interest exist for any of the authors.
7.0 References
- [1].Giustini AJ, Ivkov R, Hoopes PJ. Magnetic nanoparticle biodistribution following intratumoral administration. Nanotechnology. 2011;22(34):345101. doi: 10.1088/0957-4484/22/34/345101. [DOI] [PMC free article] [PubMed] [Google Scholar]
- [2].I H, R H, R H. Thermal Ablation of Tumors Using Magnetic Nanoparticles An In Vivo Feasibility Study. Investigative Radiology. 2002;37:580–586. doi: 10.1097/00004424-200210000-00008. [DOI] [PubMed] [Google Scholar]
- [3].Cho K, Wang X, Nie S, Cho K, Wang X, Nie S, Chen ZG, Shin DM. Therapeutic Nanoparticles for Drug Delivery in Cancer Therapeutic Nanoparticles for Drug Delivery in Cancer. Clinical Cancer Research. 2008:1310–1316. doi: 10.1158/1078-0432.CCR-07-1441. [DOI] [PubMed] [Google Scholar]
- [4].Petros RA, Desimone JM. Strategies in the design of nanoparticles for therapeutic applications. Nature Reviews Drug Discovery. 2010;9(8):615–627. doi: 10.1038/nrd2591. [DOI] [PubMed] [Google Scholar]
- [5].Holback H, Yeo Y. Intratumoral drug delivery with nanoparticulatecarriers. Pharmaceutical research. 2011;28:1819–1830. doi: 10.1007/s11095-010-0360-y. [DOI] [PMC free article] [PubMed] [Google Scholar]
- [6].Maeda H. The enhanced permeability and retention (EPR) effect in tumor vasculature: the key role of tumor-selective macromolecular drug targeting. Advances in enzyme regulation. 2001;41:189–207. doi: 10.1016/s0065-2571(00)00013-3. [DOI] [PubMed] [Google Scholar]
- [7].Jain RK, Stylianopoulos T. Delivering Nanomedicine to Solid Tumors. Nature Reviews Clinical Oncology. 2011:653–664. doi: 10.1038/nrclinonc.2010.139. [DOI] [PMC free article] [PubMed] [Google Scholar]
- [8].Matsumura Y, Maeda H. A New Concept for Macromolecular Therapeutics in Cancer Chemotherapy : Mechanism of Tumoritropic Accumulation of Proteins and the Antitumor Agent Smancs A New Concept for Macromolecular Therapeutics in Cancer Chemotherapy : Mechanism of Tumoritropic Accum. Cancer Research. 1986:6387–6392. [PubMed] [Google Scholar]
- [9].Boucher Y, Baxter LT, Jain RK. Interstitial Pressure Gradients in Tissue-isolated and Subcutaneous Tumors : Implications for Therapy Interstitial Pressure Gradients in Tissue-isolated and Subcutaneous Tumors : Implications for Therapy1. Cancer Research. 1990:4478–4484. [PubMed] [Google Scholar]
- [10].Boucher Y, Kirkwood JM, Opacic D, Desantis M, Jain RK. Interstitial Hypertension in Superficial Metastatic Melanomas in Humans Interstitial Hypertension in Superficial Metastatic Melanomas in Humans1. Cancer Research. 1991:6691–6694. [PubMed] [Google Scholar]
- [11].Gutmann R, Leunig M, Feyh J, Goetz AE, Messmer K, Kastenbauer E, Jain RK. Advances in Brief Interstitial Hypertension in Head and Neck Tumors in Patients : Correlation with Tumor Size1. Cancer Research. 1992;52(7):1993–5. [PubMed] [Google Scholar]
- [12].Nathanson SD, Nelson L. Interstitial fluid pressure in breast cancer, benign breast conditions, and breast parenchyma. Annals of surgical oncology. 1994;1:333–338. doi: 10.1007/BF03187139. [DOI] [PubMed] [Google Scholar]
- [13].Roh HD, Boucher Y, Kalnicki S, Kainicki S, Buchsbaum R, Bloomer WD, Jain RK. Interstitial Hypertension in Carcinoma of Uterine Cervix in Patients : Possible Correlation with Tumor Oxygenation and Radiation Response. Cancer Research. 1991;51(24):6695–6698. [PubMed] [Google Scholar]
- [14].Baxter LT, Jain RK. Transport of fluid and macromolecules in tumors. I. Role of interstitial pressure and convection. Microvascular research. 1989;37:77–104. doi: 10.1016/0026-2862(89)90074-5. [DOI] [PubMed] [Google Scholar]
- [15].Jain RK. Barriers to drug delivery in solid tumors. Scientific American. 1994;271:58–65. doi: 10.1038/scientificamerican0794-58. [DOI] [PubMed] [Google Scholar]
- [16].Xenografts HT, Rofstad EK, Gaustad J.-vidar, Brurberg KG, Mathiesen B, Galappathi K, Simonsen TG. Radiocurability Is Associated with Interstitial Fluid Pressure in. Neoplasia. 2009;11:1243–1251. doi: 10.1593/neo.91152. [DOI] [PMC free article] [PubMed] [Google Scholar]
- [17].Ozerdem M. Measuring intersititial fluid pressure with fiberoptic pressure transducers. Microvascular Research. 2009;77(2):226–229. doi: 10.1016/j.mvr.2008.08.002. [DOI] [PMC free article] [PubMed] [Google Scholar]
- [18].Jang SH, Wientjes MG, Lu D, Au JLS. Drug delivery and transport to solid tumors. Pharmaceutical research. 2003;20:1337–1350. doi: 10.1023/a:1025785505977. [DOI] [PubMed] [Google Scholar]
- [19].Krtolica A, Parrinello S, Lockett S, Desprez P.-yves, Campisi J. Senescent fibroblasts promote epithelial cell growth and tumorigenesis : A link between cancer and aging. Proceedings of the National Academy of Sciences USA. 2001;98(21):12072–7. doi: 10.1073/pnas.211053698. [DOI] [PMC free article] [PubMed] [Google Scholar]
- [20].Yan G. Heparin-Binding Keratinocyte Growth Factor Is a Candidate Stromal to Epithelial Cell Andromedin. Molecular Endocrinology. 2:2123–2128. doi: 10.1210/mend.6.12.1491693. [DOI] [PubMed] [Google Scholar]
- [21].Kolácná L, Bakesová J, Varga F, Kostáková E, Plánka L, a Necas, Lukás D, Amler E, Pelouch V. Biochemical and biophysical aspects of collagen nanostructure in the extracellular matrix. Physiological research / Academia Scientiarum Bohemoslovaca. 2007;56:S1, S51–S60. doi: 10.33549/physiolres.931302. [DOI] [PubMed] [Google Scholar]
- [22].Barkan D, Green Jeffrey E., Chambers Ann F. Extracellular matrix: A gatekeeper in the transition from dormancy to metastatic growth. European Journal of Cancer. 2010;46(7):1181–1188. doi: 10.1016/j.ejca.2010.02.027. [DOI] [PMC free article] [PubMed] [Google Scholar]
- [23].Ramaswamy S, Ross KN, Lander ES, Golub TR. A molecular signature of metastasis in primary solid tumors. Nature genetics. 2003;33:49–54. doi: 10.1038/ng1060. [DOI] [PubMed] [Google Scholar]
- [24].Feng Y, Sun B, Li X, Zhang L, Niu Y, Xiao C, Ning L, Fang Z, Wang Y, et al. Differentially expressed genes between primary cancer and paired lymph node metastases predict clinical outcome of node-positive breast cancer patients. Breast cancer research and treatment. 2007;103:319–329. doi: 10.1007/s10549-006-9385-7. [DOI] [PubMed] [Google Scholar]
- [25].Levental KR, Yu H, Kass L, Lakins JN, Egeblad M, Erler JT, Fong SFT, Csiszar K, Giaccia A, et al. Matrix crosslinking forces tumor progression by enhancing integrin signaling. Cell. 2009;139:891–906. doi: 10.1016/j.cell.2009.10.027. [DOI] [PMC free article] [PubMed] [Google Scholar]
- [26].a Liotta L, Rao CN. Role of the Extracellular Matrix in Cancer. Annals of the New York Academy of Sciences. 1985;460:333–344. doi: 10.1111/j.1749-6632.1985.tb51180.x. [DOI] [PubMed] [Google Scholar]
- [27].Netti PA, Berk DA, Swartz MA, Grodzinsky AJ, Jain RK. Role of Extracellular Matrix Assembly in Interstitial Transport in Solid Tumors Role of Extracellular Matrix Assembly in Interstitial Transport in Solid Tumors 1. Cancer. 2000:2497–2503. [PubMed] [Google Scholar]
- [28].Ramanujan S, Pluen A, Mckee TD, Brown EB, Boucher Y, Jain RK. Diffusion and Convection in Collagen Gels : Implications for Transport in the Tumor Interstitium. Biophysical Journal. 2002;83:1650–1660. doi: 10.1016/S0006-3495(02)73933-7. [DOI] [PMC free article] [PubMed] [Google Scholar]
- [29].Fukumura D, Duda DG, Munn LL, Jain RK. Tumor Microvasculature and Microenvironment: Novel Insights Through Intravital Imaging in Pre-Clinical Models. Microcirculation. 2010;17:206–225. doi: 10.1111/j.1549-8719.2010.00029.x. [DOI] [PMC free article] [PubMed] [Google Scholar]
- [30].Gruber JD, Paliwal A, Krishnaswamy V, Ghadyani H, Jermyn M, a O'Hara J, Davis SC, Kerley-Hamilton JS, Shworak NW, et al. System development for high frequency ultrasound-guided fluorescence quantification of skin layers. Journal of biomedical optics. 2011;15:026028. doi: 10.1117/1.3374040. [DOI] [PMC free article] [PubMed] [Google Scholar]
- [31].Paliwal A, Torosean S, Gruber J, O'Hara J, Hasan T, Pogue B, Maytin EV. In vivo validation of high frequency ultrasound-guided fluorescence tomography system to improve delivery of photodynamic therapy. Therapy. 2011;7886:788610–788610-8. [Google Scholar]
- [32].Palmeri ML, Wang MH, Dahl JJ, Frinkley KD, Nightingale KR. Quantifying Hepatic Shear Modulus In Vivo Using Acoustic Radiation Force. Ultrasound in Medicine & Biology. 2008;34(4):546–558. doi: 10.1016/j.ultrasmedbio.2007.10.009. [DOI] [PMC free article] [PubMed] [Google Scholar]
- [33].Taylor K, O'Keeffe S, Britton PD, Wallis MG, Treece GM, Housden J, Parashar D, Bond S, Sinnatamby R. Ultrasound elastography as an adjuvant to conventional ultrasound in the preoperative assessment of axillary lymph nodes in suspected breast cancer: A pilot study. Clinical Radiology. 2011;66:1064–1071. doi: 10.1016/j.crad.2011.05.015. [DOI] [PubMed] [Google Scholar]
- [34].Facts Q. FluoSpheres ® Fluorescent Microspheres Quick Facts Ex / Em. 2005 http://probes.invitrogen.com/media/pis/mp05000.pdf.
- [35].Soubret A, Ripoll J, Ntziachristos V. Accuracy of fluorescent tomography in the presence of heterogeneities: study of the normalized Born ratio. IEEE transactions on medical imaging. 2005;24:1377–1386. doi: 10.1109/tmi.2005.857213. [DOI] [PubMed] [Google Scholar]
- [36].Mansfield JR, Gossage KW, Hoyt CC, Levenson RM. Autofluorescence removal, multiplexing, and automated analysis methods for in-vivo fluorescence imaging. Journal of biomedical optics. 2011;10:41207. doi: 10.1117/1.2032458. [DOI] [PubMed] [Google Scholar]
- [37].Davis SC, Pogue BW, Springett R, Leussler C, Mazurkewitz P, Tuttle SB, Gibbs-Strauss SL, Jiang SS, Dehghani H, et al. Magnetic resonance-coupled fluorescence tomography scanner for molecular imaging of tissue. The Review of scientific instruments. 2008;79:064302. doi: 10.1063/1.2919131. [DOI] [PMC free article] [PubMed] [Google Scholar]
- [38].Pinet E. Pressure measurement with fiber-optic sensors: commercial technologies and applications. Changes. 2011;7753:775304–775304-4. [Google Scholar]
- [39].Pinet É. Fabry-Pérot Fiber-Optic Sensors for Physical Parameters Measurement in Challenging Conditions. Journal of Sensors. 2009;2009:1–9. [Google Scholar]
- [40].Wiig H. Comparison of methods for measurement of interstitial fluid pressure in cat skin/subcutis and muscle. The American journal of physiology. 1985;249:H929–H944. doi: 10.1152/ajpheart.1985.249.5.H929. [DOI] [PubMed] [Google Scholar]
- [41].Jain RK. Transport of Molecules in the Tumor Interstitium : A Review Transport of Molecules in the Tumor Interstitium : A Review1. Cancer Research. 1987:3039–3051. [PubMed] [Google Scholar]
- [42].Wiig H, Reed RK, Aukland K. Measurement of interstitial fluid pressure: comparison of methods. Physiology. 1986;14:139–151. doi: 10.1007/BF02584264. [DOI] [PubMed] [Google Scholar]


