Summary
Molecular dynamics simulations can aid studies of the structural and physico-chemical properties of proteins, by predicting their dynamics, energetics, and interactions with their local environment at the atomistic level. We argue that non-standard protocols are needed to realistically model collagen proteins because in their biological state these aggregate to form collagen fibrils, and so they should not be treated as fully solvated molecules. A new modelling approach is presented that can account for the local environment of collagen molecules within a fibril, and which therefore simulates aspects of their behaviour that would not otherwise be distinguished. This modelling approach exploits periodic boundaries to replicate the supermolecular arrangement of collagen proteins within the fibril, in an approach that is more commonly associated with modelling crystalline solids rather than mesoscopic protein aggregates. Initial simulations show agreement with experimental observations and corroborate theories of the fibril’s structure.
1 Introduction
Collagen is a natural protein used by the human body as a building material for many different structures such as bones, teeth, tendons and corneas. Molecular dynamics (MD) simulations have often been used to investigate various aspects of collagen’s dynamic behaviour, by calculating the movement and energetics of collagen molecules on an atom by atom basis.1-6 In the majority of these previous studies, the modelled system consisted only of a short collagen-like molecule in a fully solvated state. These previous computational studies were generally successful in revealing new information regarding the structure of individual collagen molecules, but the simplicity of the models meant that they were limited in their ability to predict the behaviour of collagen as a macroscopic material when it is packed into a high density protein environment.
The aim of the present work is to develop and exploit an MD modelling procedure that allows a study collagen molecules under the specific conditions in which they are tightly packed together, as in biological tissues. These simulations are notably different from conventional MD simulations of proteins, which generally only treat individual protein molecules (or possibly small protein complexes) in isolation as though they are fully solvated. We demonstrate that these simulations can be used to investigate features of this material that could not have been observed had we used a more conventional simulation model of a single isolated collagen molecule.
The collagen protein, known as a tropocollagen, is a rope-like macromolecule comprising three polypeptide strands twisted into a continuous triple helix. The tropocollagen is approximately 300 nm in length and 1.5 nm in diameter, and it is flanked at both termini by short non-helical telopeptides.7 Tropocollagens are secreted by human cells into the extracellular matrix, whereupon they bundle together tightly to form hydrated collagen fibrils. These fibrils are the underlying structural units of connective tissues, and they typically have a diameter in the range 20–500 nm.8
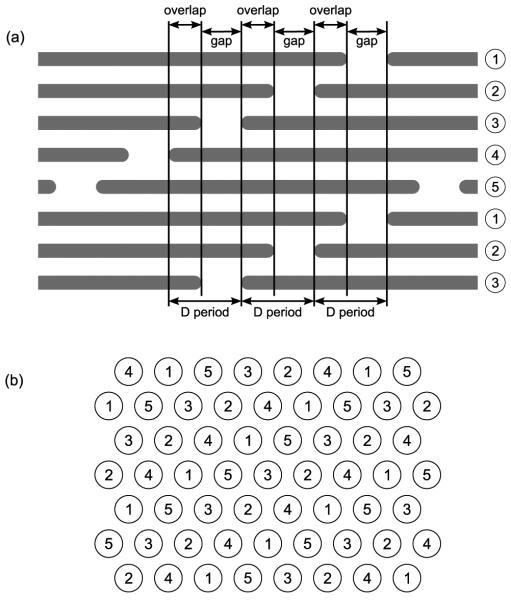
Figure 1 illustrates the supramolecular arrangement of collagen proteins within the fibril. It can be seen that they aggregate with a degree of order: the rope-like molecules all lie parallel to each other, and they have a regular staggered arrangement in the axial direction. The axial periodicity is referred to as a D period, and its length as measured by x-ray diffraction is 67.8 nm.9 Because the length of a tropocollagen is not a multiple of 67.8 nm, each D period correspondingly has both an “overlap” and a “gap” region, corresponding to regions of higher and lower density, respectively. Figure 1a is, of course, only a two-dimensional representation of the fibril; in three dimensions the arrangement of proteins is analogous to Figure 1a in the axial direction, but they also have a specific arrangement with respect to the fibril’s cross section, as shown in Figure 1b.
Figure 1.
Schematic of the supramolecular arrangement of proteins in the collagen fibril. (a) The staggered axial alignment in the fibril, with each tropocollagen represented as a long straight rod. (b) A cross section through a fibril in the overlap region, with each tropocollagen represented as a circle. In both (a) and (b) the numbers represent the five possible axial alignments of the proteins.
It is generally found that the structure and performance of any protein is sensitive to the nature of its local environment. As tropocollagen molecules assemble into fibrils, they find themselves in a high-density protein environment, and their close-packing results in direct interactions with their neighbours in all directions. Collagen is therefore unusual amongst proteins in that its functional state cannot be well described by modelling a single instance of the protein immersed in a large quantity of explicit water molecules to replicate the effects of solvation. Although collagen fibrils can have a high water content, individual collagen molecules within the fibril certainly cannot be described as fully solvated in the same way that most globular proteins are. Furthermore, treating collagen in this way would be to disregard the purpose of its amino acid sequence, which has evolved in such a way that the proteins directly self-assemble into their aggregated structures with an ordered arrangement.10
Some previous molecular dynamics studies have used a direct approach to modelling a collagen fibril, by using a model system in which a small bundle of multiple collagen proteins is entirely surrounded by water molecules.11,12 However, this method is limited in its scope because as the size of the bundle of molecules increases (corresponding to larger fibrils), the computational requirements for the simulation eventually become unattainable.
The MD simulations we describe in this paper take a different approach to achieving simulations of the densely packed environment within a collagen fibril. We take advantage of the regularly repeating arrangement of tropocollagen proteins, and use a densely packed unit cell to represent the larger structure. This unit cell contains all of the atoms required to describe the bulk phase of the fibril when tessellated in all directions. Periodic boundary conditions are applied at the faces of the unit cell, such that atoms passing through one boundary will reappear at the far opposite face of the cell with the same velocity. Moreover, atoms near a periodic boundary will interact strongly with atoms at the far opposite face, as if they were neighbouring atoms.
We note that the use of periodic boundary conditions in MD simulations is not in itself a novel concept. For example, the principles of using a densely packed unit cell are commonly used for simulating materials with a highly ordered structure, such as inorganic crystalline solids,13 or even biological molecules in a truly crystalline phase.14 However, the collagen system modelled in the present paper is not in a crystalline phase, despite the regular supramolecular arrangement of the proteins. Rather, the tropocollagens are highly mobile and flexible within their fibrillar positions, and their movement is lubricated by the relatively high intrafibrillar water content of 0.75 g water per g collagen. MD simulations of fully solvated biomolecules also routinely use periodic boundary conditions so as to avoid any solvent surface effects. However, these boundaries are generally not used to allow direct interaction between proteins from neighbouring unit cells; rather, the boundaries are set at such a distance from the protein surface that there is no significant interaction. The MD simulations we describe in this paper should therefore be considered novel, because the technique of using a unit cell and periodic boundary conditions is not typically used to model complex materials consisting of large proteins in a close packed environment. Indeed, collagen is one of the few large biomaterials which aggregate in a manner that is conducive for this simulation approach.
2 Methods
The protocols described in this section are for an all-atom molecular dynamics simulation of type I collagen proteins and water molecules packed into a fibril.
2.1 Constructing the model
An initial approximation to a low-energy conformation of a type I tropocollagen was generated using the programme THeBuScr (Triple Helical collagen Building Script).15 THeBuScr uses data from previously reported high-resolution x-ray structures of short collagen-mimetic peptides, and it applies an algorithm that accounts for differences in helical propensity along the length of the collagen molecule depending on local amino acid sequence. The input for this programme was the amino acid sequences of the α1 and α2 chains of type I collagen, which are the sequences that have been translated from the genes COL1A1 and COL1A2, and are available on the UniProt website.16 The tropocollagen generated at this stage was a perfectly straight triple helix; THeBuScr makes no attempt to predict the larger fibrillar structure, or the presence of any bends or kinks in the molecule.
The details of the supramolecular structure were obtained from entry 1Y0F in the Protein Data Bank (PDB),17 which was calculated from a lower resolution x-ray diffraction experiment of a collagen fibril.9 This PDB entry contains the Cα atomic coordinates of each amino acid in collagen to indicate the shape of the molecule, and its orientation with respect to a triclinic unit cell. However, we did not directly use these atomic coordinates because they were not measured directly from the x-ray diffraction pattern due to the low resolution of that experiment.
A script was written to combine the atomistic-resolution conformation generated by THeBuScr and the fibrillar arrangement taken from the PDB entry. Specifically, the script translated the coordinates of each atom such that the local helical conformation was that given THeBuScr, but the overall shape of the molecule and its orientation relative the periodic box was that given in the PDB file. Finally, the programme Leap, which is part of the Amber Tools software, was used to add the collagen’s telopeptides and the side chain atoms of each amino acid. This system configuration then served as the input structure for the molecular dynamics simulations.
The programme Leap was also used to add explicit water molecules to the simulation model, to fill the interstitial gaps between neighbouring collagen molecules. The amount of water added was adjusted via a trial and error approach, until a constant pressure MD simulation led to very little change in the size of the unit cell compared to the crystallographic dimensions; too much water caused an increase in the periodic box dimensions, and too little water the converse.
The unit cell dimensions came from the lower resolution x-ray diffraction experiment of the collagen fibril.9 The triclinic cell is illustrated in Figure 2, not to scale. Its lengths are given by a = 39.97 Å, b = 26.95Å and c = 677.90Å and its angles are α = 89.24°, β =94.59° and γ = 105.58°. The modelled system contained one tropocollagen molecule and 11980 water molecules per unit cell.
Figure 2.
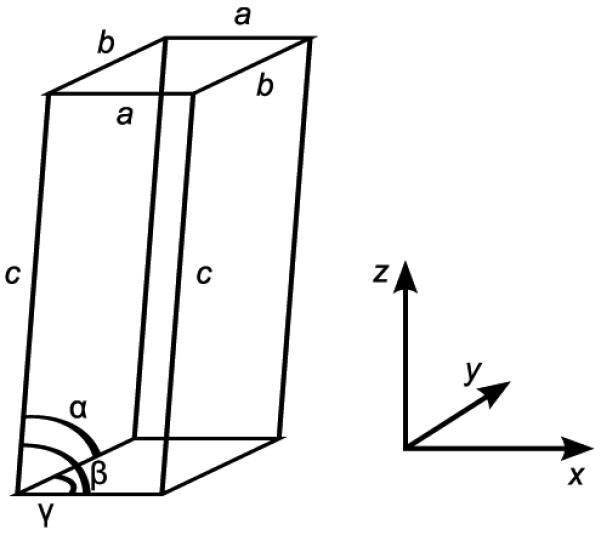
The triclinic unit cell and its orientation relative to the cartesian axes. Its edges are described by the lengths a = 39.97 Å, b = 26.95Å and c = 677.90Å (not shown to scale), and its angles are α= 89.24°, β = 94.59° and γ = 105.58°. The shorter edges labelled a and b lie in the x,y-plane. The collagen proteins (not shown) lie approximately parallel both to the z-axis and to the edge labelled c.
2.2 Simulation protocol
Molecular dynamics simulations were performed on the all-atom fibrillar system using the programme SANDER, which is part of the Amber 9 software.18 Periodic boundary conditions were applied at the faces of the unit cell in order to simulate the densely packed environment of the collagen fibril. The simulations used the ff99SB force field, which was parameterised specifically for biological molecules such as proteins,19 and the water molecules were described by the TIP3P model. The ff99SB force field contains intramolecular potential terms for bond stretching, bending and torsion, and non-bonded interactions are represented by Coulomb and Lennard-Jones 6-12 pairwise additive potentials. The Coulombic potential was calculated using the particle-mesh Ewald summation with a cut-off radius of 8.0 Å. 20
An energy minimisation procedure was first used to reduce any excessive instabilities in the starting conformation. Next, the system was heated and equilibrated using the NVT ensemble for 120 ps. Finally, the production MD simulation was run for 60 ns using the NPT ensemble at a temperature of 310 K, which is a typical temperature for a collagen fibril in vivo. For all MD simulations, the SHAKE algorithm was used to constrain bonds involving hydrogen,21 and an integration time step of Δt = 2 fs was used. Constant temperature and pressure were maintained with the Berendsen algorithm,22,23 using a barostatic time constant of τp = 5.0 ps atm−1 and a thermostatic time constant of τt = 1.0 ps.
2.3 Modification to the Amber code
This section describes a change that was made to the Amber 9 source code in order to generate a molecular dynamics trajectory for this system. The reasons that this change was necessary are discussed in section 3.2
In the standard Amber molecular dynamics code for isotropic external pressure, a coordinate rescaling factor, μ, is calculated after each time step:22,23
| 1 |
where P0 is the applied external pressure, P is the internal system pressure, Δt is the size of the MD time increment, and τp is a time constant. The unit cell is rescaled after each time step of molecular dynamics so that the lengths of its edges, a, b and c (Figure 2), become μa, μb and μc, respectively, and correspondingly each atom is moved from position r to position μr. However, for the present work, the Amber code was changed so that the unit cell edges a and b (which lie in the x,y-plane) were scaled by μ as before, but the longest edge c, which lies approximately parallel to the collagen molecule, was not rescaled. Similarly, the x and y components of each atom’s position vector were scaled by μ, but its z coordinate was not rescaled. Note that this modification only applied to the barostatic rescaling of coordinates; it did not prevent the collagen molecule from increasing in overall size in the z direction due to the inherent dynamics of its constituent atoms. In effect, the simulation became a constant pressure simulation with respect to the x- and y-coordinates, and a constant volume simulation with respect to the z-coordinate. The periodic box angles, α, β and γ, were not allowed to vary from their crystallographic values.
The internal system pressure was also calculated slightly differently to be consistent with the modified method of coordinate rescaling. The instantaneous pressure in the system is a tensor, P, and it is calculated by the Amber MD software from the kinetic energy and the forces acting upon each atom:23
| 2 |
where V is the volume of the periodic box, m is an atomic mass, v is an atomic velocity vector, r is the vector between two atoms, and F is the force between two atoms. The superscript T represents the transpose of a column vector to a row vector, and the sum is over all atoms in a unit cell. When the external pressure is isotropic, the internal system pressure may also be approximated as isotropic, and its scalar value P may be approximated from the elements of the matrix P. In the unmodified version of the Amber code, the internal system pressure is given by P = (Pxx+Pyy+Pzz)/3, where the subscripts refer to the elements of the matrix P. That is to say, the scalar pressure is the average of the main diagonal elements of the pressure tensor. However, for the system described in this paper, for which coordinates are scaled only in the x and y directions, the Amber code was modified so that the internal system pressure was taken to be P = (Pxx+Pyy)/2; that is to say the matrix element Pzz was not used.
3 Results and Discussion
3.1 Features of the modelled system
The structure of the collagen fibril modelled in these simulations was closely based on the measurements made by x-ray diffraction experiments of collagen, as described in section 2.1. In particular, the supramolecular arrangement of the proteins within the fibril came from a low resolution x-ray diffraction experiment that told us the overall shape of the collagen proteins, and their orientation relative to a regularly repeating crystallographic unit cell. The details of this supramolecular arrangement were discussed in the original experimental paper,9 and they are worth describing here because there are some aspects of this fibrillar structure that make the molecular dynamics simulations particularly unusual compared to most other biomolecular simulations.
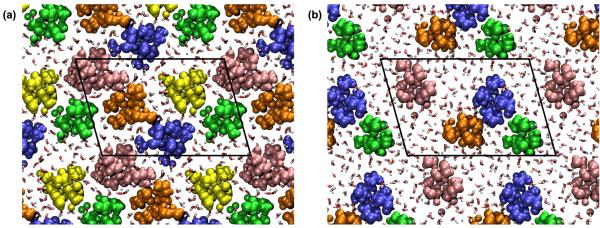
The modelled collagen fibril has a periodic structure described by a triclinic unit cell that is 677.9Å along its longest edge, but only 39.97Å and 26.95Å along its other two edges. For each unit cell there is one complete collagen protein, and it lies roughly parallel to the long edge, as shown in Figure 3. Because the rope-like tropocollagen is approximately 3000Å in length, it is much longer than the unit cell, and it therefore extends well beyond the confines of the periodic boundaries. The result of this discrepancy in lengths is that the tropocollagens have the parallel staggered arrangement presented schematically in Figure 1a. Therefore, in a cross sectional slice through the overlap region of the fibril there are five collagen proteins per unit cell. Similarly, in a cross sectional slice through the gap region there are four tropocollagens per unit cell. Figure 4 shows some examples of these cross-sectional slices of the modelled system, including the position of the periodic boundaries. It can be seen that in the overlap region of the fibril the tropocollagens have the quasi-hexagonal lateral packing shown schematically in Figure 1b.
Figure 3.
An atomistic representation of a tropocollagen protein (red) and its unit cell (blue).
Figure 4.
Cross-sectional images of the collagen fibril taken from the molecular dynamics simulations. All atoms within a 5Å thick slice are shown, including proteins (pink, orange, blue, yellow, green) and water molecules (red and white). The collagen proteins lie perpendicular to the cross-sectional plane, and therefore appear as small clusters of atoms. (a) The ‘overlap’ region of the fibril in which five different collagen proteins pass through the cross section of the unit cell (white quadrangle). (b) The ‘gap’ region of the fibril in which only four collagen proteins pass through the cross section. Water molecules fill all of the fibril’s interstices, and in many places form water bridges between neighbouring proteins.
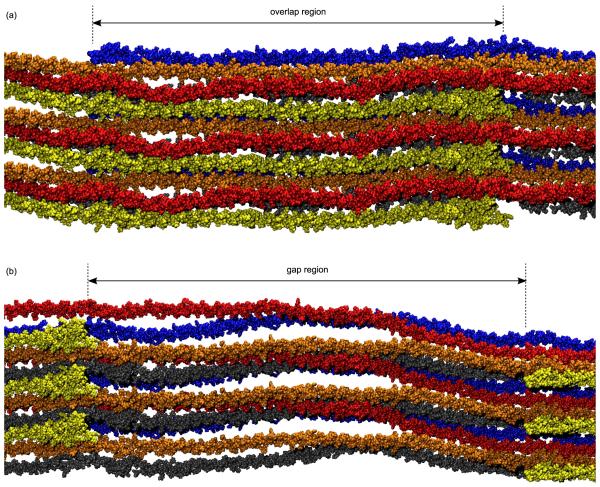
Figure 5 shows images of the axial allignment of tropocollagens in the modelled system, equivalent to the schematic diagram in Figure 1a. Water has been omitted from Figure 5, and the tropocollagens are far too long to be viewed in their entirety. For clarity, each image shows only three adjacent periodic units in the x and y directions, but in the MD simulations these repeating units extended indefinitely in all directions; i.e. each tropocollagen was surrounded on all sides by densely packed neighbours.
Figure 5.
Images of the modelled system taken after 15 ns of simulation. Each image shows three adjacent unit cells; each protein that passes through the unit cell has a different colour. Intrafibrillar water molecules are not shown.
In contrast to the collagen model described here, conventional biomolecular MD simulations usually model a single protein that easily fits within its periodic box, with plenty of distance between the protein surface and the periodic boundaries. The unit cell would not normally have such a long thin shape as the one that describes a collagen fibril. The unconventional features of the collagen system arise because collagen is one of the few proteins whose biological function requires it to aggregate into mesoscopic structures. Molecular dynamics simulations of collagen fibrils are necessarily complicated because these structures are so large, and yet their behaviour and material properties are controlled by inter-molecular interactions that can only be interpreted by considering atomistic length-scales.
Another unusual feature of this collagen system is in the relative quantity of water molecules in the unit cell. The system has 11980 interfacial water molecules per collagen molecule, which is equivalent to 0.75 g water / g collagen. This quantity was chosen using a trial and error method, as described in section 2.1, to reproduce the experimental structure. Note thatif we were to simulate a collagen protein in a fully solvated state using the standard MD approach, this would be too few water molecules. For example, to surround a complete collagen protein with a 10Å thick shell of solvent would require over 58,000 water molecules. The paucity of water molecules in our model is beneficial from a practical point of view in that it reduces the CPU time of the MD simulations.
3.2 Efficacy of the MD software
The MD simulations reported in this paper were performed using the software Amber 9, which was designed specifically for atomistic simulations of large biological molecules.18 However, we found that in order to perform all of the simulations we required of the collagen fibril, a small modification to the Amber source code was needed. Without this modification, the molecular dynamics algorithm would not proceed beyond the first time step of a constant pressure simulation (although no such problem was found in constant volume simulations). The problem occurred during the resizing of the unit cell and the rescaling of the atomic coordinates, which is part of the Berendsen barostat algorithm for maintaining constant pressure.23
These simulation problems were attributed to the highly unusual features of the collagen system, as described in section 3.1. It appeared that the barostat algorithm in Amber was not compatible with such an extremely long molecule, such a long thin periodic box, or in particular the way that the tropocollagen was more than four times longer than the periodic box. The modification made to the Amber source code is described in section 2.3. The effect of the modification was that the barostat algorithm only allowed rescaling of the atomic coordinates in the directions perpendicular to the tropocollagen, but did not allow rescaling in the direction parallel to the tropocollagen. Having made this modification, the constant pressure simulations ran successfully and continuously. The system volume and density were found to stabilise at constant values approximately 40 ps after starting a constant pressure simulation, which is consistent with the behaviour observed on regular constant pressure simulations, i.e. without this modification to the Amber code.
We would emphasise that in practical terms it is an important achievement to use only standard protein MD software to model this highly unusual system, albeit with a small modification to the code. We note that there are many other molecular dynamics software packages that could, in principle, be used to model a collagen fibril. However, we have no reason to think that any other package would be any more suited to this challenging geometry.
3.3 System relaxation
The 60 ns trajectory of the collagen fibril was first analysed visually, in order to qualitatively identify the molecular behaviour that typifies the system. Throughout the entire simulation the tropocollagen remained in a triple helix conformation, indicating stability of this local level of the protein’s conformation. Furthermore, the fibrillar arrangement of the tropocollagens was preserved throughout and was consistent with the overall molecular topology inferred from x-ray diffraction experiments.9 In particular, the proteins retained their staggered axial alignment and their quasi-hexagonal close packing in the overlap region. The total volume of the unit cell fluctuated slightly due to instantaneous pressure variations, but it never deviated by more than 0.3% from its crystallographic dimensions.
At intermediate length scales the system was more dynamic: the rope-like tropocollagen proteins gyrated and fluctuated within their positions, despite retaining the same overall fibrillar packing arrangement. The precise molecular shape inferred from the x-ray diffraction structure was therefore not strictly retained: some subtle bends and twists were introduced to the tropocollagen’s overall shape, whilst some of the bends and twists that were present in the initial structure straightened themselves out.
The total energy of the system gradually decreased for the first 35 ns of the calculated trajectory, indicating that the mobility of the molecules during this time period corresponded to a slow structural relaxation of the fibril. The system energy was more stable for the final 25 ns of the trajectory; any further systematic relaxation was negligible compared to instantaneous fluctuations in energy. It is no surprise that this system took so long to equilibrate, given that collagen proteins are so large and therefore slow-moving, and that the starting conformation did not come directly from a single experimental atomistic structure. We also note that the relaxed conformation achieved in this simulation may still not be a true global minimum, and that the system could possibly optimise its intermolecular interactions even further if only the trajectory could be calculated for a much longer time period. For example, there could be further twisting, lengthening or rotating of the proteins within their fibrillar positions, all of which are likely to be slow processes. For this reason, care should be taken when using this model to comment on any specific feature of the fibril. For example, the model should not be used to state that two specific amino acids in neighbouring tropocollagens form an interprotein hydrogen bond; such an interaction may well have disappeared if the system had been able to relax further. However, the model can be used to make statements regarding average properties of the system provided that they do not depend on the exact conformation; i.e. provided that the measured feature remains constant as a the conformation of tropocollagens fluctuate. An example of this latter type of measured feature is the distribution of water molecules throughout the fibril, which we discuss in section 3.4.
Because the collagen proteins were fairly flexible during the MD simulations, it is informative to consider the extent to which the relaxed structure agrees with the experimental structure of the fibril.9 Our motivation for developing this collagen model was that it should allow a study of intermolecular interactions within the fibril. Therefore, it is most important that the simulated and experimental structures agree on the relative positioning of nearby tropocollagens, at least on a local level. Consequently, we evaluated the agreement between structures by comparing cross sectional slices of the fibril. Figure 6 shows two examples of the agreement between a cross section taken from the MD model and the equivalent cross section from the experimental structure. The circles represent the centres of the collagen proteins, calculated by averaging the coordinates of the three Cα atoms in a triple helix triad. We are limited to comparing just the centres of the proteins because the x-ray diffraction experiment that determined the supramolecular arrangement could not identify individual atoms due to low resolution.
Figure 6.
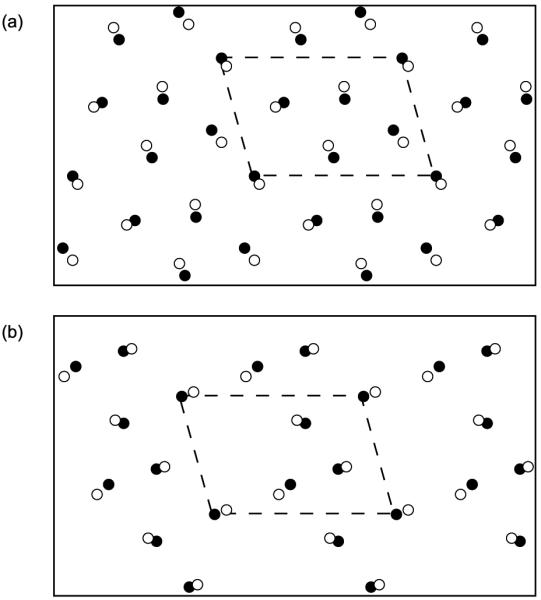
A comparison of the supramolecular arrangement of the fibril in the experimental x-ray structure (white circles) and the relaxed MD structure sampled at t = 60 ns (black circles). (a) cross section through the overlap region. (b) cross section through the gap region. The circles represent the centres of the tropocollagens. The periodic unit cell is highlighted with a dashed line.
The ‘disagreement’ between the experimental and relaxed structures shown in Figure 6 was defined to be the average distance between corresponding circles in the cross section. Note that the cross sections in Figure 6 have been intentionally aligned to minimise the value of this ‘disagreement’. Cross sections such as the ones in Figure 6 were studied at ten equally spaced axial positions throughout the D period, and for 20 different time steps from the MD trajectory, spanning the time period 35 < t < 60 ns. Over this complete set of cross sections, the ‘disagreement’ between the experimental and model structures had an average value of 2.48Å and was always less than 3.90 Å By contrast, the corresponding x-ray diffraction experiment had a resolution of 5.16Å in the axial direction and 11.1Å in the equatorial direction.9 The cross sectional slices of the modelled fibril are therefore in good agreement with the experimental structure, at least within the limits of the available resolution.
The preceding analysis focused on the supramolecular arrangement at a local level only;i.e. each calculated value of ‘disagreement’ considered just a single cross sectional slice of the fibril, and each time the cross sections from the two structures were aligned for the best agreement. Conversely, when an entire tropocollagen protein from the model was directly aligned with its counterpart from the experimental structure, there appeared to be relatively poor agreement in terms of their conformations. This is because the collagen protein is extremely long (3000 Å), and so for these rope-like molecules just a small disagreement in shape at one position can lead to very poor agreement in terms of the overall alignment. We argue that the good agreement seen in the purely local supramolecular arrangement is a vindication of this modelling procedure, at least as a method for studying intermolecular interactions at a local level.
3.4 Water distribution
In this section we present an analysis of how water molecules were distributed within the fibril in the relaxed structure. The distribution of water is a good example of a feature that crucially depends on the fibril’s supramolecular organisation, because the water molecules fill all of the remaining spaces between neighbouring tropocollagens. This feature could therefore not have been investigated using a more conventional model of just an individual collagen protein. It is, however, appropriate to study the water distribution using the present MD simulations, because it was confirmed in the previous section that on a local level the arrangement of tropocollagens were consistent with the experimental structure. The data presented in this section have been averaged over all recorded sets of coordinates from the MD trajectory over the time period 35 < t < 60 ns. It was found that these data were invariant to the precise conformation of the collagen proteins as they flexed and gyrated within their fibrillar positions. The general trends observed are therefore expected to be valid and indicative of the fibril’s true nature, even if the modelled system had not quite reached it’s global energy minimum.
Spectroscopic and computational studies have shown that proteins affect the structure and behaviour of nearby water, just as water affects the structure and behaviour of the protein.24 Specifically, water molecules in the first one to two hydration shells of a protein surface have slower rotational and translational dynamics compared to bulk water. The packing of water molecules around the tropocollagens is therefore likely to have a profound effect on the mobility and fluidity of the fibrillar structure, as well as its ability to withstand external stress.12 The dynamic behaviour of water will also affect the formation of hydroxyapatite crystals, which are nucleated in the hydrated spaces within a collagen fibril, and is an important process for mineralised tissues such as bone and dentine.25
Figure 7 shows how the water molecules in our MD simulations were distributed throughout the fibril in the axial direction. The abscissa in Figure 7 represents a single D period of the fibril; the overlap region lies approximately in the range 0 < x < 305Å and the gap region approximately in the range 305 < x < 678 Å This plot is therefore a periodic function that repeats itself for each D period along the length of a collagen fibril. It can be seen that the “concentration” of water (measured as number of water molecules per unit volume of the fibril) in the gap region is over 20% higher than in the overlap region. In the regions of both the C-terminal and N-terminal telopeptides, the water content dips to a much lower value than in the rest of the overlap region. This indicates how the non-helical telopeptides take up more volume than a helical portion of the protein, thus allowing less space for water molecules.
Figure 7.
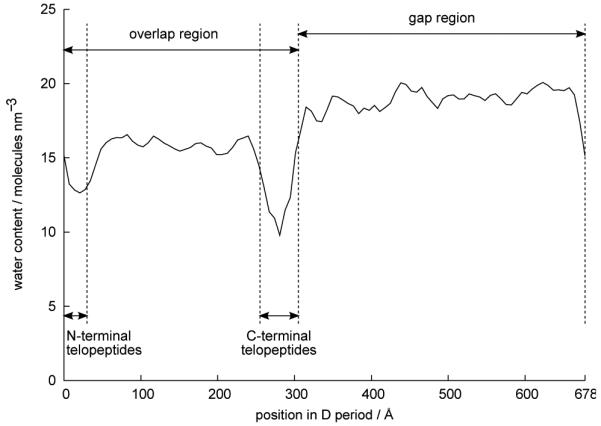
The variation of intrafibrillar water content throughout a D period, calculated from the MD simulations and averaged over time.
Figure 8 shows an analysis of the local environment of the intrafibrillar water molecules in the simulated collagen fibril. For each water molecule in the fibril, the distance to its nearest protein heavy atom was calculated; i.e. hydrogen atoms were not considered. The data is presented as a probability distribution function, and so this plot is approximately equivalent to a pair correlation function for a hydrated interface.26 However, the water distribution in Figure 8 tails off to zero after a short distance, and so it differs from a typical pair correlation distribution at a fully solvated protein, which slowly approaches a non-zero value corresponding to bulk water. In a collagen fibril, as a water molecule retreats away from one protein, it immediately approaches another nearby protein, and so the distribution is skewed towards higher values at smaller distances. In particular, a large portion of the intrafibrillar water constitutes the first hydration shell of the collagen proteins: 54.7% of water molecules in the overlap region and 36.4% of water molecules in the gap region are found within 3.2Å of their nearest protein heavy atom. Compared to the more densely packed overlap region, the gap region has more water molecules at larger distances from a collagen protein. For example, 21.0% of water molecules in the gap region are more than 5.0Å from their nearest protein, compared with only 2.9% of water molecules in the overlap region.
Figure 8.
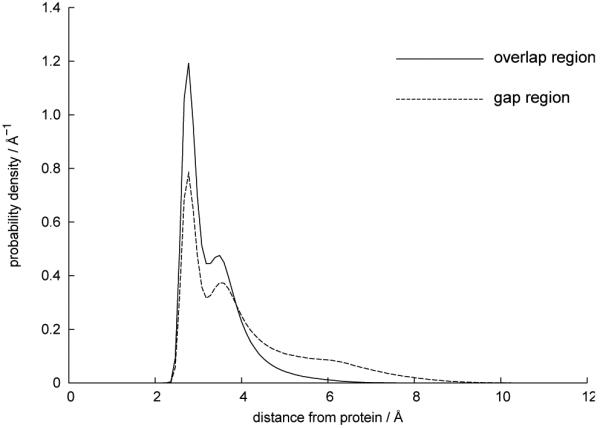
Probability distribution of the distance from the oxygen of a water molecule to the nearest (non-hydrogen) protein atom. Data is calculated from the MD simulations and averaged over time.
Experimental studies of collagen fibrils show that approximately 0.5 g of intrafibrillar water per gram of collagen is tightly bound to the protein phase, whilst any water in excess of this 0.5 g/g is “free” water, and more similar to the bulk liquid phase.27-29 Using the data in Figure 8, this value of 0.5 g water / g collagen corresponds to water molecules within 3.8Å of a protein, using the approximation that the partition in water behaviour is based solely on this distance. It has also been suggested based on computational studies that a collagen peptide distorts the structure of water up to a distance of 6Å away from its surface.3 This latter value, combined with the data in Figure 8, suggests that only 7.3% of intrafibrillar waters behave as if in the bulk phase. Note, however, that these calculations refer to our specific model fibril with a water content of 0.75 g water / g collagen. The water content of fibrils can vary, and values have been reported ranging from 0.75 g/g to 1.33 g/g.30 The current study is therfore likely to predict a lower bound for the fraction of intrafibrillar water that behaves as if in the bulk phase.
4 Conclusions
There is a great impetus to study and to understand the behaviour of collagen proteins. Not only is collagen the most abundant protein in the human body, but it also has great importance in the field of tissue engineering, where it is used as a material for constructing artificial tissue scaffolds. However, it is also a highly complex material, and progress with its use in tissue engineering is limited in part by an incomplete understanding of the fibril’s microscopic behaviour.31
The most important conclusion of this work is that it is now possible to accurately simulate collagen in its fibrillar state whilst retaining atomistic resolution, provided one takes advantage of the periodic unit cell as revealed by x-ray diffraction. This is an important step forward that takes us away from modelling single collagen molecules, and brings us towards models that give us a better understanding of larger scale collagen structures. The simulation calculations are not trivial due to the unusual geometry of the unit cell and, at least with Amber, a small modification must be made to the MD software.
This modelling procedure is able to reveal aspects of collagen’s behaviour that could not be seen by modelling a single isolated protein. For example, in Section 3.4 we used the model to show that the fibril contains significant amounts of water both tightly bound states and in a bulk phase state, and to quantify the relative amounts. Intrafibrillar water is reported to vary in quantity across different tissues,32 and is known to be critical in determining collagen’s material properties, such as its ability to withstand stress. The modelling procedure described here could also be used to investigate further chemical processes of the collagen fibril, such as intrafibrillar hydroxyapatite crystallisation, or the process of fibrillogenesis, which is controlled and directed by a balance of inter-protein hydrophillic and hydrophobic forces.10,33
References
- [1].Klein TE, Huang CC. Biopolymers. 1999;49:167–183. doi: 10.1002/(SICI)1097-0282(199902)49:2<167::AID-BIP5>3.0.CO;2-5. [DOI] [PubMed] [Google Scholar]
- [2].Lorenzo AC, Caffarena ER. J. Biomech. 2005;38:1527–1533. doi: 10.1016/j.jbiomech.2004.07.011. [DOI] [PubMed] [Google Scholar]
- [3].Handgraaf JW, Zerbetto F. Proteins: Struct. Funct. Bioinf. 2006;64:711–718. doi: 10.1002/prot.21019. [DOI] [PubMed] [Google Scholar]
- [4].Bhowmik R, Katti KS, Katti DR. J. Mater. Sci. 2007;42:8795–8803. [Google Scholar]
- [5].Sundar Raman S, Parthasarathi R, Subramanian V, Ramasami T. J. Phys. Chem. B. 2008;112:1533–1539. doi: 10.1021/jp0728297. [DOI] [PubMed] [Google Scholar]
- [6].Gautieri A, Buehler MJ, Redaelli A. J. Mech. Behav. Biomed. Mater. 2009;2:130–137. doi: 10.1016/j.jmbbm.2008.03.001. [DOI] [PubMed] [Google Scholar]
- [7].Bhattacharjee A, Bansal M. IUBMB Life. 2005;57:161–172. doi: 10.1080/15216540500090710. [DOI] [PubMed] [Google Scholar]
- [8].Parry DAD, Craig AS. Nature. 1979;282:213–215. doi: 10.1038/282213a0. [DOI] [PubMed] [Google Scholar]
- [9].Orgel JPRO, Irving TC, Miller A, Wess TJ. Proc. Natl. Acad. Sci. USA. 2006;103:9001–9005. doi: 10.1073/pnas.0502718103. [DOI] [PMC free article] [PubMed] [Google Scholar]
- [10].Hulmes DJS, Miller A, Parry D. a. D., Piez KA, Woohead-Galloway J. J. Mol. Biol. 1973;79:137–148. doi: 10.1016/0022-2836(73)90275-1. [DOI] [PubMed] [Google Scholar]
- [11].Monti S, Bronco S, Cappelli C. J. Phys. Chem. B. 2005;109:11389–11398. doi: 10.1021/jp0440941. [DOI] [PubMed] [Google Scholar]
- [12].Zhang D, Chippada U, Jordan K. Ann. Biomed. Eng. 2007;35:1216–1230. doi: 10.1007/s10439-007-9296-8. [DOI] [PubMed] [Google Scholar]
- [13].Catlow CRA. Computer Modeling in Inorganic Crystallography. Academic Press; London: 1997. [Google Scholar]
- [14].MacKerell AD, Wiórkiewicz-Kuczera J, Karplus M. J. Am. Chem. Soc. 1995;117:11946–11975. [Google Scholar]
- [15].Rainey JK, Goh MC. Bioinformatics. 2004;20:2458–2459. doi: 10.1093/bioinformatics/bth247. [DOI] [PubMed] [Google Scholar]
- [16]. www.ebi.ac.uk/uniprot/
- [17]. www.pdb.org.
- [18].Case DA, Cheatham TE, Darden T, Gohlke H, Luo R, Merz KM, Onufriev A, Simmerling C, Wang B, Woods RJ. J. Comput. Chem. 2005;26:1668–1688. doi: 10.1002/jcc.20290. [DOI] [PMC free article] [PubMed] [Google Scholar]
- [19].Hornak V, Abel R, Okur A, Strockbine B, Roitberg A, Simmerling C. Proteins: Struct. Funct. Bioinf. 2006;65:712–725. doi: 10.1002/prot.21123. [DOI] [PMC free article] [PubMed] [Google Scholar]
- [20].Darden T, York D, Pedersen L. J. Chem. Phys. 1993;98:10089–10092. [Google Scholar]
- [21].Ryckaert JP, Ciccotti G, Berendsen HJC. J. Comput. Phys. 1977;23:327–341. [Google Scholar]
- [22].Case DA, Darden TA, Cheatham TE, III, Simmerling CL, Wang J, Duke RE, Luo R, Merz KM, Pearlman DA, Crowley M, Walker RC, Zhang W, Wang B, Hayik S, Roitberg A, Seabra G, Wong KF, Paesani F, Wu X, Brozell S, Tsui V, Gohlke H, Yang L, Tan C, Mongan J, Hornak V, Cui G, Beroza P, Mathews DH, Schafmeister C, Ross WS, Kollman PA. 2006 [Google Scholar]
- [23].Berendsen HJC, Postma JPM, van Gunsteren WF, DiNola A, Haak JR. J. Chem. Phys. 1984;81:3684–3690. [Google Scholar]
- [24].Raschke TM. Curr. Opin. Struct. Biol. 2006;16:152–159. doi: 10.1016/j.sbi.2006.03.002. [DOI] [PubMed] [Google Scholar]
- [25].Arnold S, Plate U, Wiesmann HP, Kohl H, Höhling HJ. Cell Tissue Res. 1997;288:185–190. doi: 10.1007/s004410050805. [DOI] [PubMed] [Google Scholar]
- [26].Merzel F, Smith JC. Proc. Natl. Acad. Sci. USA. 2002;99:5378–5383. doi: 10.1073/pnas.082335099. [DOI] [PMC free article] [PubMed] [Google Scholar]
- [27].Nomura S, Hiltner A, Lando JB, Baer E. Biopolymers. 1977;16:231–246. doi: 10.1002/bip.1977.360160202. [DOI] [PubMed] [Google Scholar]
- [28].Pineri MH, Escoubes M, Roche G. Biopolymers. 1978;17:2799–2815. doi: 10.1002/bip.1978.360171205. [DOI] [PubMed] [Google Scholar]
- [29].Price RI, Lees S, Kirschner DA. Int. J. Biol. Macromol. 1997;20:23–33. doi: 10.1016/s0141-8130(97)01148-3. [DOI] [PubMed] [Google Scholar]
- [30].Urban JPG, McMullen JF. Biorheology. 1985;22:145. doi: 10.3233/bir-1985-22205. [DOI] [PubMed] [Google Scholar]
- [31].Cen L, Liu W, Cui L, Zhang W, Cao Y. Pediatr. Res. 2008;63:492–496. doi: 10.1203/PDR.0b013e31816c5bc3. [DOI] [PubMed] [Google Scholar]
- [32].Sivan S, Merkher Y, Wachtel E, Ehrlich S, Maroudas A. J. Orthop. Res. 2006;24:1292–1298. doi: 10.1002/jor.20144. [DOI] [PubMed] [Google Scholar]
- [33].Steplewski A, Hintze V, Fertala A. J. Struct. Biol. 2007;157:297–307. doi: 10.1016/j.jsb.2006.10.009. [DOI] [PubMed] [Google Scholar]


