Abstract
This study addresses the neuronal representation of aversive sounds that are perceived as unpleasant. Functional magnetic resonance imaging in humans demonstrated responses in the amygdala and auditory cortex to aversive sounds. We show that the amygdala encodes both the acoustic features of a stimulus and its valence (perceived unpleasantness). Dynamic causal modeling of this system revealed that evoked responses to sounds are relayed to the amygdala via auditory cortex. While acoustic features modulate effective connectivity from auditory cortex to the amygdala, the valence modulates the effective connectivity from amygdala to the auditory cortex. These results support a complex (recurrent) interaction between the auditory cortex and amygdala based on object-level analysis in the auditory cortex that portends the assignment of emotional valence in amygdala that in turn influences the representation of salient information in auditory cortex.
Introduction
Certain sounds, such as scraping sounds (e.g., finger nails on a blackboard) are perceived as highly unpleasant. A number of studies in humans have shown higher activation in the amygdala (Mirz et al., 2000; Zald and Pardo, 2002) and auditory cortex (Fecteau et al., 2007; Viinikainen et al., 2011) in response to unpleasant sounds relative to neutral sounds. In the present work, we address the following three key questions: (1) What does the activity in the amygdala and auditory cortex represent in response to unpleasant sounds? (2) Does the amygdala receive direct subcortical auditory inputs or are they relayed through the auditory cortex? (3) How do acoustic features and valence modulate the coupling between the amygdala and the auditory cortex?
In emotional stimuli, the acoustic features of stimuli covary with the emotional valence: spectrotemporal complexity of a stimulus with negative (or positive) valence is different from that of a neutral stimulus. It is therefore not clear whether the observed response in the amygdala corresponds to the acoustic features, the valence per se, or both. In this work, by explicitly modeling the spectrotemporal features of sounds and using these and the valence of sounds as explanatory variables, we disambiguate the two dimensions of the response by decomposing it into two components that are uniquely explained by the acoustic features and valence.
Using a classical conditioning paradigm in rodents, LeDoux and colleagues (1984, 1990b) have argued that the conditioned aversive stimulus (typically a pure tone) reaches the amygdala via a fast “second” auditory pathway from the auditory thalamus to the amygdala. Whether the processing of complex aversive sounds might follow the subcortical route to the amygdala is not known. Although it has been argued that “more complex (aversive) stimuli would require cortical processing” (Phelps and LeDoux, 2005), empirical evidence for the route followed by complex aversive stimuli in humans is lacking.
Converging evidence from both the visual (Lane et al., 1997; Lang et al., 1998) and auditory (Plichta et al., 2011) domains shows that the activity of sensory cortex is modulated by emotional stimuli. The source of these modulations in the sensory cortex is thought to be the amygdala (Morris et al., 1998; Pessoa et al., 2002). This is based on the observations that activity in the amygdala correlates with cortical responses (Morris et al., 1998) and that the amygdala projects extensively to the sensory cortex (Amaral and Price, 1984). However, the observed correlation does not establish a causal influence of the amygdala. Moreover, the way in which the coupling between the amygdala and auditory cortex is influenced by low-level acoustic features and valence is not known.
In this study, we used event-related functional magnetic resonance imaging (fMRI) to measure neuronal responses to sounds that varied over a large range in the degree of their unpleasantness. By using conventional general linear model (GLM) analysis and analysis of causal interactions between the amygdala and the auditory cortex using dynamic causal modeling (DCM) and Bayesian model selection, we show the following: (1) the amygdala encodes both the acoustic features and valence of aversive sounds, (2) information is relayed to the amygdala via the auditory cortex, and (3) while the acoustic features modulate the forward coupling (from auditory cortex to the amygdala), valence modulates backward connectivity from the amygdala to the auditory cortex.
Materials and Methods
Participants.
Sixteen healthy subjects (7 females, age range 22–35 years) with no prior history of neurological or psychiatric disorder participated in the study. All subjects completed a consent form and were paid for their participation. Subjects were informed that they would be listening to unpleasant sounds in the MRI scanner but were not told about the type of unpleasant sounds or the overall aim of the study.
Sound stimuli and extraction of acoustic features.
The stimuli consisted a set of 74 sounds (each ∼2 s duration). The choice of sounds was based on our previous work (Kumar et al., 2008) in which a group of 50 subjects rated the unpleasantness of these sounds. These sounds, which were also analyzed to determine acoustic features relevant to perceived unpleasantness, were not categorically aversive or nonaversive but their perceived unpleasantness varied continuously from high to low. The sounds included highly unpleasant sounds [scraping sounds (chalk scratched on blackboard, knife scraped over bottle) and animal cries] and less unpleasant sounds (e.g., bubbling water).
To identify the features of the sounds that may be salient for perceived unpleasantness, we used a model of the auditory system to determine the spectrotemporal representations that correspond to the representation in the auditory cortex. The model of the auditory system includes (1) peripheral processing, which decomposes time domain sound signals into a two-dimensional time–frequency representation; and (2) central processing, which decomposes the two-dimensional representation into ripples with different spectral and temporal modulation frequencies (for a detailed description of the model, see Shamma, 2003; Kumar et al., 2008). In our previous study, we found that such a representation of sounds in the spectral frequency (F) and temporal modulation frequency (f) space can predict the perceived unpleasantness of sounds. To determine how the perceived unpleasantness and the BOLD signal vary with spectrotemporal features, we evaluated (for each sound) the value of spectral frequency and temporal modulation frequency that corresponds to maximum energy in the F–f space.
MRI data collection.
All imaging data were collected on Siemens 3 tesla Allegra head-only MRI scanner. Stimuli were presented in an event-related paradigm with interstimulus intervals jittered between 1.0 and 1.6 s. Each sound was repeated four times during the experiment. The experiment also included 90 null-events. In the scanner, subjects rated each sound on a scale from 1 (least unpleasant) to 5 (highly unpleasant). Ratings were recorded via button-presses on a five-button box. MRI images were acquired continuously (3 tesla; TR, 2.73 s; TE, 30 ms; 42 slices covering the whole brain; flip angle, 90°; isotropic voxel size, 2 mm with 1 mm gap; matrix size, 128 × 128) with a sequence optimized for the amygdala (Weiskopf et al., 2006). After the fMRI run, a high resolution (1 × 1 × 1 mm) T1-weighted structural MRI scan was acquired for each subject.
MRI data analysis.
Data for three subjects had to be discarded because of technical problems in registering the ratings given by the subjects. MRI data were analyzed using SPM8 (http://www.fil.ion.ucl.ac.uk/spm). After discarding the first two dummy images to allow for T1 relaxation effects, images were first realigned to the first volume. The realigned images were normalized to stereotactic space and smoothed by an isotropic Gaussian kernel of 8 mm full-width at half maximum. After preprocessing, statistical analysis used general linear (convolution) model (GLM). The design matrix for this analysis consisted of stimulus functions encoding the stimulus onsets convolved with a hemodynamic response function and four parametric regressors, in which the stimulus onsets were modulated by (1) spectral frequency (F), (2) temporal modulation frequency (f), (3) the interaction between the spectral frequency and temporal modulation frequency (F × f), and (4) rating of perceived unpleasantness (valence). The regressors were orthogonalized such that variance explained by valence was orthogonal to that explained by the acoustic features. A high-pass filter with a cutoff frequency of 1/128 Hz was applied to remove low-frequency variations in the BOLD signal. The GLM for each subject was estimated and the contrasts of parameter estimates for individual subjects were entered into second-level t tests to form statistical parametric maps, implementing a whole-brain random-effect analysis. The (display) threshold in the amygdala was lowered to p < 0.005 (uncorrected) to highlight the patterns of activity in the amygdala that correlate with acoustic features and rating of unpleasantness. These responses were overlaid on the amygdala maps from the anatomy toolbox (Eickhoff et al., 2005), available in SPM8.
Connectivity analysis: dynamic causal modeling.
The central idea behind DCM (Friston et al., 2003) is to identify causal interactions between two or more brain areas. The term “causal” in DCM refers to how the activity of one brain area changes the response of another area (Friston, 2009). A distinctive feature of DCM, in contrast to other methods (e.g., Granger causality) of connectivity analysis, is that it employs a generative or forward model of how the observed data (BOLD response in the present case) were generated. The generative model used in DCM for fMRI has two parts. The first part models the dynamics of neural activity by the following bilinear differential equation:
 |
where z is an n-dimensional state vector (with one state variable per region), t is continuous time, and uj is the j-th experimental input (i.e., stimulus functions above).
The above equation has three sets of parameters. The first set of parameters, matrix A of size (n × n), models the average connection strengths between the regions. These parameters represent the influence that one region has over the other in the absence of any external manipulation. The second set of parameters, matrix Bj (n × n), is known as modulatory parameters and model the change in connection strength induced by the j-th stimulus function. These parameters are therefore input-specific and are also referred to as bilinear parameters. The third set of parameters, matrix C (n × 1), models the direct influence of a stimulus function on a given region. The conventional general linear model analysis is based on the assumption that any stimulus has a direct influence on a region. DCM, therefore, can also be regarded as more general, with the general linear model analysis being a specific situation in which the coupling parameters (first and second sets, A and B) are assumed to be zero.
The second part of the generative model converts neural activity to BOLD responses. This is done by using a hemodynamic model (Friston et al., 2000) of the neurovascular coupling. The combined set of parameters of both parts are then estimated using variational Bayes (Friston et al., 2003) to give the posterior density over parameters and model evidence. The model evidence is used to select the best model/s from a set of models.
The relative evidence for two models—or a set of models—is generally computed using a Bayes factor (BF) (Kaas and Raftery, 1995):
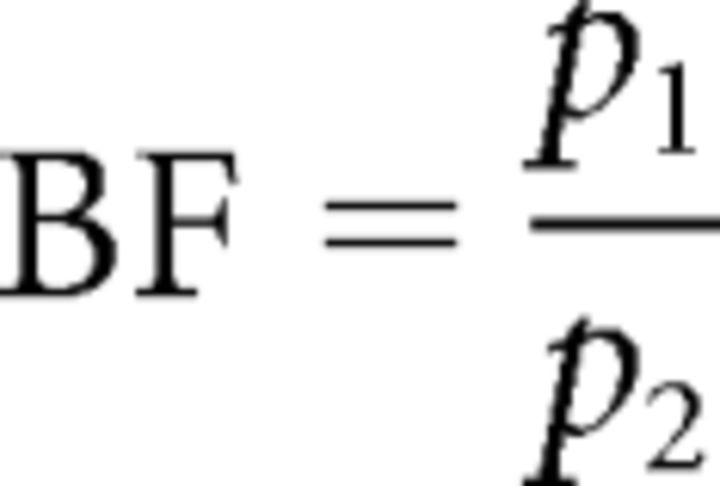 |
where p1 and p2 are the posterior probability of models 1 and 2, respectively (under uninformative priors over models). Kass and Raftery (1995) proposed the following rules for assessing these odds ratios: BF 1–3, weak evidence for model 1 compared to model 2; BF 2–3, positive evidence; BF 20–150, strong evidence; and BF >150, very strong evidence.
Volumes of interest for DCM analysis.
We chose four volumes of interest for the DCM analysis: right amygdala (38, −6, −24), left amygdala (−22, −2, 12), right auditory cortex (48, −14, −12), and left auditory cortex (−50, 6, −6). These areas and their coordinates were based on the group (random-effect) level GLM analysis. The BOLD activities in the right amygdala and the left auditory cortex were positively correlated with ratings of unpleasantness. BOLD responses in the left amygdala and the right auditory cortex were correlated with the interaction between the spectral frequency and temporal modulation frequency. For each subject, we chose subject specific maxima that were closest to and fell within the same anatomical region as the group-level maxima. Time series of activity for different regions were summarized by the first principal component of all voxels lying within 4 mm of the subject-specific maxima. For a group-level model comparison, we used a random-effects analysis (Stephan et al., 2009) as implemented in SPM8.
Results
Relationship between acoustic features and perceived unpleasantness
The set of 74 sounds that were presented during the experiment were analyzed for their acoustic features using a biologically realistic model of the auditory system (see Materials and Methods, above). Figure 1 shows examples of the spectrotemporal representation for six of the 74 sounds. This representation is in a space with dimensions of spectral frequency (F, y-axis) and temporal modulation frequency (f, x-axis). The mean unpleasantness rating for these sounds is also shown (in the top right corner of each plot). It can be seen that sounds with high unpleasantness have high spectral frequencies and low temporal modulation frequencies.
Figure 1.
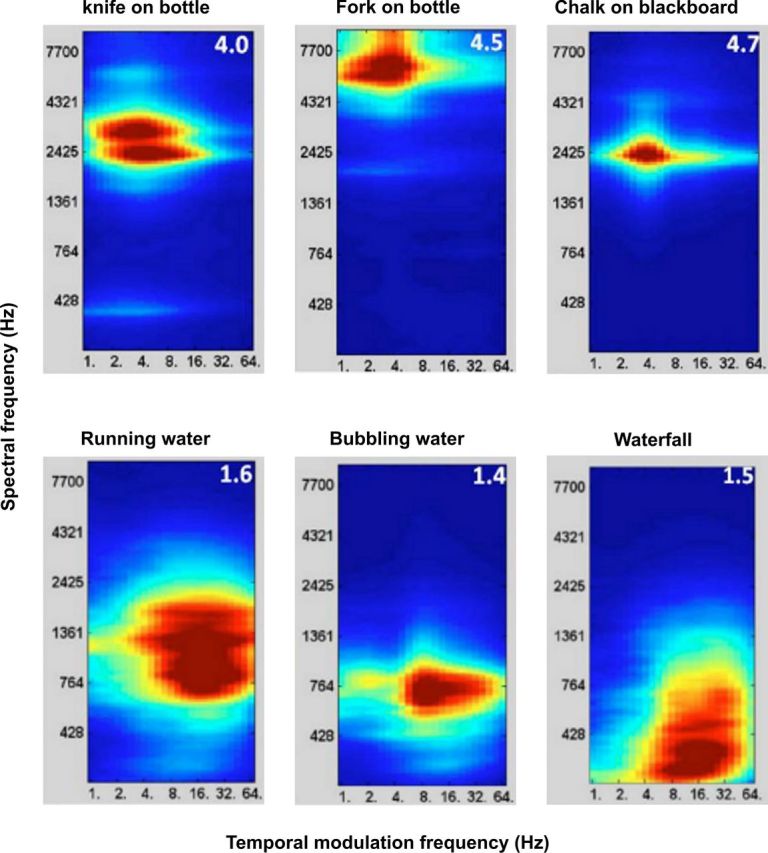
Spectral frequency–temporal modulation representation of sounds with high (top) and low (bottom) unpleasantness ratings. The mean rating for each sound is shown in the top right corner of each figure: ratings were on a scale from 1 to 5, with 1 corresponding to low unpleasantness and 5 corresponding high unpleasantness.
We analyzed, using regression analysis, the relationship between the ratings and the spectrotemporal features. Since rating is an ordinal variable (that is a categorical variable, which can be ordered) and the spectral and temporal modulation frequencies are continuous variables, we used ordinal regression (with a logit model). Specifically we estimated the following model:
where
 |
Here F is the spectral frequency, f is the temporal modulation frequency, F × f is the interaction between the two and ε is the error. The analysis showed that the regression coefficient for the spectral frequency, β1 = 2.31, and the interaction term, β3 = −0.40, were statistically significant (p < 0.01). The regression coefficient for the temporal modulation term was not statistically significant. The acoustic features explain ∼19% of the variance of the rating variable.
GLM analysis
In this analysis, we determined the brain areas in which BOLD activity varies as a function of acoustic features and ratings of unpleasantness. The design matrix comprised five regressors: a stimulus onset regressor that was modulated by four parameters: (1) spectral frequency (F), (2) temporal modulation frequency (f), (3) interaction between F and f, and (4) ratings of unpleasantness (valence). To distinguish areas that correlate with acoustic features and valence, the regressors were orthogonalized, so that the variance explained by, for example, the interaction term was orthogonal to that explained by the spectral frequency (F) and temporal modulation frequency (f). Similarly, the variance explained by valence was orthogonal to the variance explained by all the acoustic features. The analyses that follow therefore disambiguate the effects of acoustic features and valence (in the sense that any neuronal responses explained by valence cannot be explained by acoustic features and vice versa).
Neuronal responses to acoustic features
Response in the amygdala
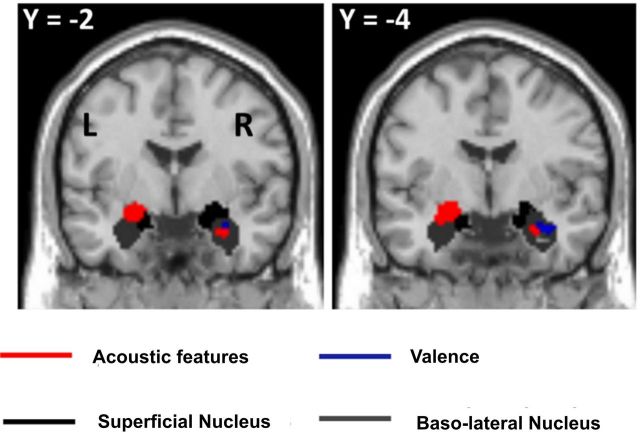
No response was observed in the amygdala that correlated with either spectral frequency or temporal modulation frequency alone. There was a significant correlation of BOLD response in the amygdala with the interaction between the spectral frequency and the temporal modulation frequency. Figure 2 (red areas) shows significant group (n = 13) responses overlaid on amygdala probability maps (Eickhoff et al., 2005) when testing for the interaction between spectral frequency F and temporal modulation frequency f. The effect of interaction is observed in the amygdala bilaterally [−22, −2, −12; t(12) = 4.98; 24, −8, −18; t(12) = 4.13; p < 0.001 (uncorrected)]. The cluster of activity in the left amygdala is shared between the superficial (57%) and basolateral (29%) nuclei of the amygdala. The cluster in the right amygdala is mostly in the basolateral amygdala (79%) but a part (21%) also lies in the superficial nucleus.
Figure 2.
Responses in the amygdala that correlate with acoustic features (interaction between spectral frequency and temporal modulation frequency) and rating of unpleasantness. Activity is thresholded at p < 0.005 (uncorrected) for display purpose and is overlaid on the amygdala probability maps available in the SPM8 anatomy toolbox.
Response in the auditory cortex
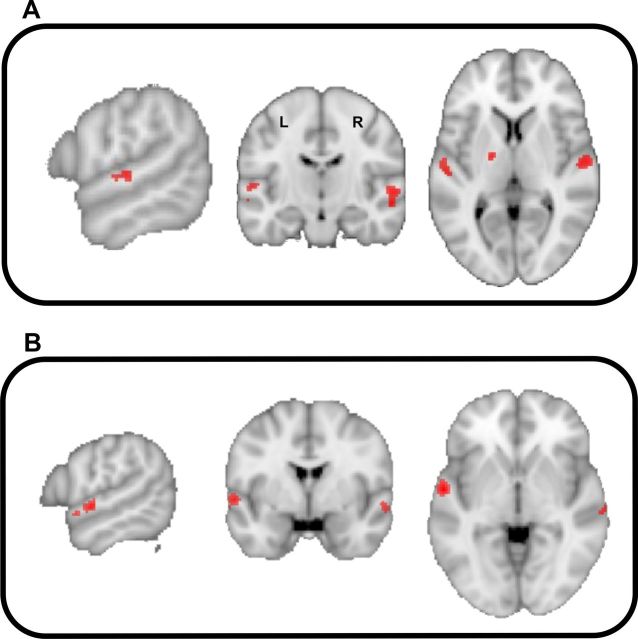
The BOLD activity that was correlated with spectral frequency and temporal modulation frequency in the auditory cortex is shown in Figure 3, A and B, respectively. With a decrease in spectral frequency (Fig. 3A), responses were observed bilaterally in anterolateral Heschl gyrus extending to the planum temporale. Decrease in the temporal modulation frequency elicited responses bilaterally in the anterior part of superior temporal gyrus (STG)/upper bank of STS (Fig. 3B).
Figure 3.
BOLD activity in the auditory cortex [p < 0.001 (uncorrected)] that correlates with acoustic features. A, Negative correlation with spectral frequency. B, Negative correlation with temporal modulation frequency.
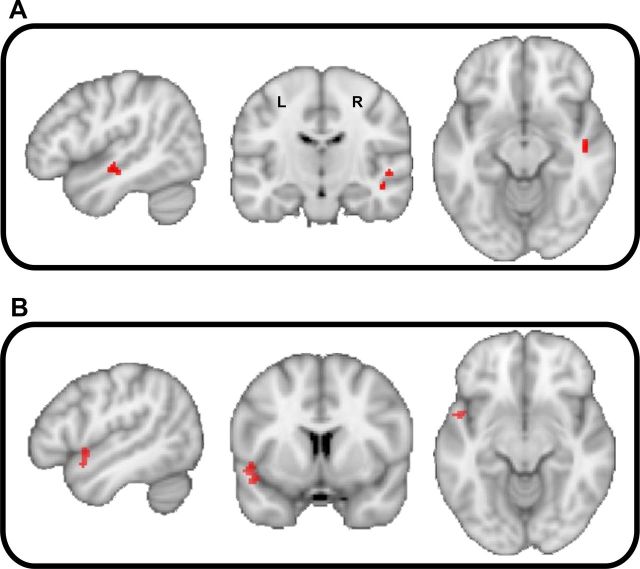
Activity in the right STG [48, −14, −12; t(12) = 5.17; p < 0.001 (uncorrected); Fig. 4A] correlated with the interaction between spectral frequency and temporal modulation. Other areas that correlated with acoustic features of the sounds stimuli are summarized in Table 1.
Figure 4.
BOLD activity in the auditory cortex [p < 0.001 (uncorrected)] that correlates with the interaction between spectral frequency (A) and temporal modulation frequency (B) rating of unpleasantness.
Table 1.
Brain areas other than the amygdala and the auditory cortex that correlates with interaction between acoustic features
| Area | MNI coordinates | t value |
|---|---|---|
| Inferior temporal gyrus | −12, −18, −16 | 6.67 |
| −44, −50, −12 | 6.31 | |
| Insula | −34, −6, 10 | 5.50 |
| 30, 8, 4 | 4.35 | |
| 34, −8, 4 | 4.03 | |
| Medial orbitofrontal | −16, 46, −14 | 5.15 |
| Inferior parietal | −54, −34, 22 | 4.95 |
| Superior parietal | −34, −8, 46 | 4.71 |
| Medial frontal | 18, 42, 18 | 4.54 |
| Inferior temporal gyrus | −42, −28, −16 | 4.37 |
| Cerebellum | 24, −48, −28 | 4.17 |
| −2, −62, −8 | 4.16 | |
| Superior temporal gyrus | 42, −8, −14 | 4.15 |
Neuronal responses to valence
Response in the amygdala
Activity was observed in the right amygdala [38, −6, −24; t(12) = 3.96; p < 0.001 (uncorrected); Fig. 2, blue areas] that correlates positively with rating of unpleasantness. This cluster of activity is located mostly (88%) in the basolateral nucleus of the amygdala. No activity was observed in the left amygdala even when the threshold was lowered to p = 0.01 (uncorrected).
Response in the auditory cortex
Activity was observed in the left anterior part of the STG [−50, 6, −6; t(12) = 7.02; p < 0.001 (uncorrected); Fig. 4B] that was positively correlated with the valence. Other areas that correlate with unpleasantness ratings are summarized in Table 2.
Table 2.
Brain areas other than the amygdala and the auditory cortex that correlates positively with ratings of unpleasantness
| Area | MNI coordinates | t value |
|---|---|---|
| STG | −50, 6, −6 | 7.02 |
| Basal ganglia | 14, 4, 22 | 6.50 |
| Cerebellum | −10, −60, −16 | 6.06 |
| 14, −54, −16 | 4.41 | |
| 16, −84, −40 | 4.33 | |
| Inferior temporal gyrus | 56, −22, −28 | 5.79 |
| Superior parietal | −58, −26, 36 | 5.38 |
| Inferior frontal gyrus | 42, 14, 14 | 5.34 |
Connectivity analysis using dynamic causal modeling
The BOLD activity in the auditory cortex and the amygdala were highly correlated and therefore showed a high degree of functional connectivity. We assessed the directed effective connectivity underlying these correlations using dynamic causal modeling to understand the interactions between the auditory cortex and the amygdala. Specifically we asked the following questions:
How does stimulus information reach the amygdala?
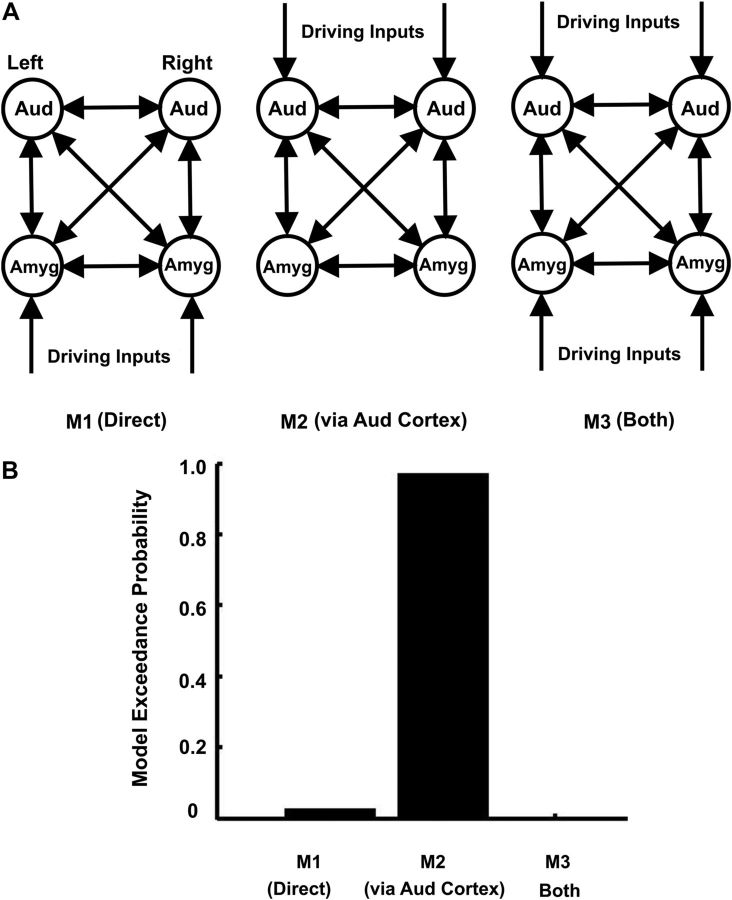
We tested alternative models based on direct inputs to the amygdala and inputs via the auditory cortex (Fig. 5A). In the models, no subcortical structure (e.g., thalamus) of the auditory system was included because no reliable activity was detected in these structures. This could be because of their small size or motion of brainstem (Poncelet et al., 1992). In the first model (M1, direct), the stimulus is received directly by the amygdala, which then drives the auditory cortex. In the second model (M2, via auditory cortex), the stimulus is first processed in the auditory cortex which then drives the amygdala. In the third model (M3, both), the amygdala and the auditory cortex are driven by the stimulus independently. The connectivity of all the three models is same, the only difference being the location of driving inputs. These models were estimated for 13 subjects and compared using Bayesian model comparison with random effects. The model exceedance probabilities of the three models are shown in Figure 5B. These results show that the model in which the stimulus first reaches the auditory cortex, which then drives the amygdala (model M2), is the best model (exceedance probability = 0.97). The Bayes factor for best model (M2) compared with the next-best model (M1) is ∼35, which implies a strong evidence (see Materials and Methods, Connectivity analysis: dynamic causal modeling, above) for model M2.
Figure 5.
A, Model space to establish how stimulus information reaches the amygdala. In M1, stimuli activate the amygdala (Amyg) directly; in M2, the stimulus is first processed by the auditory cortex (Aud) and then reaches the amygdala; in M3, both the amygdala and the auditory cortex receive the stimulus independently. B, Model exceedance probabilities for the models shown in A. M2, in which the auditory cortex drives the amygdala, is the best model (exceedance probability = 0.97).
Which pathway, from the auditory cortex to the amygdala or vice versa, is modulated by the acoustic features?
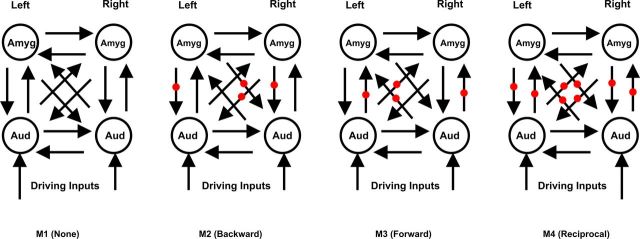
To answer this question, we created a set of four models (Fig. 6). In the first model (M1, none), a null model, the acoustic features have no modulatory effect in either direction. In the second model (M2, backward), only backward connections from the amygdala to the auditory cortex are modulated by the acoustic features (Fig. 6, modulated connections are marked by red dots). In the third (M3, forward) and fourth (M4, reciprocal) models, forward connections from the auditory cortex to the amygdala or both forward and backward connections are modulated by acoustic features. Areas in the models are fully connected and the driving inputs are at the auditory cortex. Specifically, the modulation term is the interaction between the spectral frequency and the temporal modulation frequency that was significant in the behavioral analysis and predicts BOLD activity in both the amygdala and the auditory cortex. The exceedance probabilities of the models are shown in Figure 7A. In this case, the third model (M3), in which the forward connections from the auditory cortex to the amygdala are modulated by acoustic features, has the highest probability (0.64). Analysis of parameters of the best model showed that all modulatory influences are statistically significant using post hoc tests. The Bayes factor for the best model (M3) compared with the next-best model (M4) is 3.05, which implies a positive evidence for model M3 (see Materials and Methods, Connectivity analysis: dynamic causal modeling, above).
Figure 6.
Model space for analysis of the modulatory effects of acoustic structure and valence. In the first model (M1), there is no modulatory effect; in the second model (M2), pathways from the amygdala (Amyg) to the auditory cortex (Aud) (as indicated by red dots) are modulated; in the third model (M3), pathways from the auditory cortex are modulated; and in the last model (M4), modulation is bidirectional.
Figure 7.
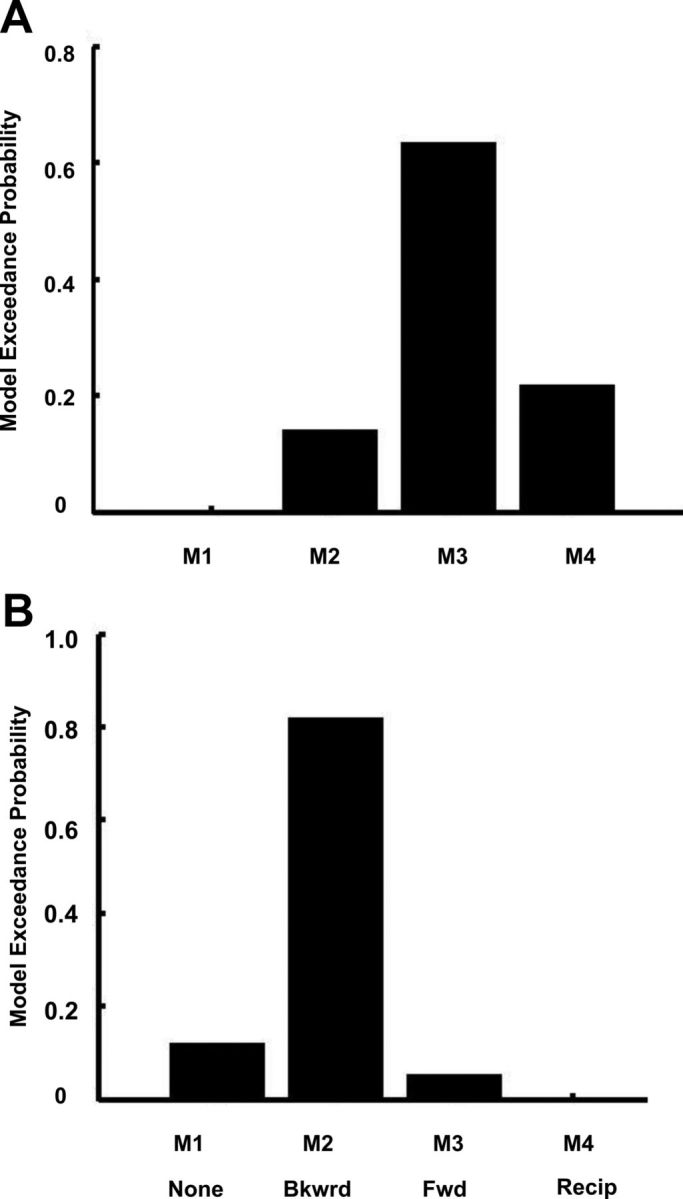
A, Model exceedance probabilities for the model space shown in Figure 5, where the modulatory input corresponds to the acoustic features (interaction between spectral and temporal modulation frequencies). M3 is the best model (model exceedance probability = 0.64). B, Model exceedance probabilities for the models shown in Figure 6, where the modulatory input is the rating of unpleasantness. M2, in which the backward connections from the amygdala to the auditory cortex are modulated is the best model (exceedance probability = 0.83). Bkwrd, backward; Fwd, forward; Recip, reciprocal.
Which pathway, from the auditory cortex to the amygdala or vice versa, is modulated by valence?
The structure of models in this comparison is the same as in Figure 6, but here the modulation is by valence rather than acoustic features. The exceedance probabilities of the models (random-effects analysis, 13 subjects) are shown in Figure 7B. The model in which the backward connections from the amygdala to the auditory cortex are modulated by perceived unpleasantness has the highest probability (0.83). Analysis of the parameters of the best model showed that all modulatory influences are statistically significant. The Bayes factor for the best model (M2) compared with the next-best model (M1) is 6.91, which implies positive evidence for model M2.
Discussion
A number of previous studies (Mirz et al, 2000; Zald and Pardo, 2002) have implicated the amygdala in the perception of aversive sounds. In this paper, using conventional GLM analysis and effective connectivity analysis using DCM, we answer three questions that are important in building a detailed model of how the aversive percepts are formed: (1) What does the amygdala encode? (2) How does the stimulus reach the amygdala? (3) How does the amygdala interact with the auditory cortex?
What does the amygdala encode?
One model of amygdala function suggests that it encodes the value of stimuli both external and internal to an organism (Morrison and Salzman, 2010). Results of most of the previous studies that have implicated the amygdala in processing of emotional information are confounded by lack of control of low-level sensory features. In this work, we distinguished areas of the amygdala that process acoustic features from those that process valence by explicitly modeling the sensory features of stimuli and valence and using them as explanatory variables in fMRI analysis. Our results demonstrate that acoustic features of stimuli are encoded in the amygdala. This is consistent with the few studies in the literature that have examined the encoding of sensory features in the amygdala. A study in rodents (Bordi and LeDoux, 1992) has shown that neurons in the amygdala are tuned to high frequencies (>10 kHz) relevant to negative affect (e.g., distress calls). Similarly Du et al. (2009) measured frequency following response to a chatter sound in rats. For nonauditory stimuli, Kadohisa et al. (2005) showed a detailed representation of food stimulus features, such as viscosity, fat texture, and temperature, exists in the amygdala.
Although much is known about the roles played by different nuclei of the amygdala in animals (LeDoux, 2000), many details are not available in humans. Thanks to the availability of amygdala maps (Eickhoff et al., 2005), recent studies in humans (Ball et al., 2007) have started to tease apart the contributions of different nuclei in the amygdala. In our data, the distribution of responses in different nuclei shows that both basolateral and superficial nuclei of the amygdala encode the acoustic features necessary for attributing valence. This is in agreement with the animal models of amygdala function, in which the basolateral nucleus acts as a gateway for sensory information to the amygdala. Less is known about the role of superficial nucleus in humans. One study (Ball et al., 2007), however, showed that this nucleus responds to auditory input.
Our results show that the amygdala encodes not only the low-level acoustic features that determine valence but also the valence itself. This is in agreement a number of neuroimaging studies in normal subjects and psychopathology that implicate the amygdala in the subjective experience of negative affect. In the auditory domain, although a number of studies show activity in the amygdala in response to unpleasant sounds (Phillips et al., 1998; Morris et al., 1999; Mirz et al., 2000; Sander and Scheich, 2001; Zald and Pardo, 2002), these studies have not specifically examined the relation between its activity and the subjective experience of emotions. However, one study (Blood and Zatorre, 2001) using music as emotional stimuli showed activity of the right amygdala was negatively correlated with increasing chills, experienced by subjects when they listened to certain pieces of music. In studies using nonauditory stimuli, Zald and Pardo (1997) showed that responses in the left amygdala correlated positively with the subjective ratings of aversiveness of odor. Ketter et al. (1996) observed greater regional cerebral blood flow in the left amygdala in response to procaine-induced fear, which correlated with the intensity of fear experienced by individual subjects. In psychopathology, responses in the amygdala correlated with the negative affect experienced by the depressed patients (Abercrombie et al., 1998).
How does the stimulus reach the amygdala?
The auditory input to the amygdala has been studied extensively in rodents (Aggleton et al., 1980; LeDoux et al., 1984, 1990a; Romanski and LeDoux, 1993). It is well known that the basolateral complex of the amygdala, which acts as a sensory interface of the amygdala, receives inputs from both the auditory thalamus (LeDoux et al., 1984, 1990a) and from association areas of the auditory cortex (Aggleton et al., 1980; Romanski and LeDoux, 1993). These studies show that aversive stimuli can reach the amygdala via the auditory thalamus or cortex. To determine how the amygdala receives aversive input in humans, we compared three alternative models. In the first model, the stimulus representation passes directly to the amygdala and thence the auditory cortex. Since the pathway from the auditory thalamus to the amygdala is suggested to provide fast but imprecise inputs to the amygdala, this model includes the possibility that the direct input to the amygdala comes from the thalamus. In the second model, the amygdala did not receive a direct fast and imprecise input but is driven by an input that has been processed by the auditory cortex. In the third model, the amygdala receives both a direct input and the processed input from the auditory cortex. Our results provide evidence for the second model. This is consistent with the idea that the type of aversive stimuli used in the present study (i.e., complex sounds) are first processed and decoded in the auditory cortex before an emotional response can be elaborated. For example, an animal cry (signaling the presence of a dangerous animal) may have different time and frequency domain structure related to the size of the animal. To decode the size of animal from the acoustic structure, the stimuli need to be processed to a high level in the auditory cortex (von Kriegstein et al., 2006) before affective evaluation in the amygdala (Rolls, 2007). Evidence from visual studies (Mormann et al., 2011) shows responses in the amygdala to a specific category of objects (e.g., picture of animals), arguing for a higher level of processing before affective value is assigned.
Models of the role of amygdala in emotional processing (Phelps and LeDoux, 2005) postulate that the cortico-amygdala pathway is used for processing of complex emotional stimuli. However, to the best of our knowledge, there is no empirical evidence for this. Our effective connectivity analysis provides empirical evidence that the cortico-amygdala pathway is needed for emotional analysis of aversive sounds.
How does the amygdala interact with the auditory cortex?
In a complex and rapidly changing environment, adaptive behavior requires that sensory information is extracted and processed more efficiently for stimuli that are emotionally salient. This requires that representations of emotionally salient stimuli in sensory cortex are given a higher weighting than less emotionally salient stimuli. In this study, we observed that activity of the auditory cortex was modulated by both acoustic features and the perceived unpleasantness of the stimuli. In particular, activity in the left and right STG was modulated as a function of perceived unpleasantness and acoustic features, respectively. This is consistent with few studies in the auditory domain reporting greater activation for negative (Grandjean et al., 2005) and for both negative and positive (Plichta et al., 2011) stimuli in the auditory cortex. Representation of valence-related information in the auditory cortex has also been shown in single-neuron recording studies in monkeys (Brosch et al., 2011; Scheich et al., 2011). These studies show that not only the activity of auditory cortex can be modulated by valence (as in the present study), but the activity of neurons in the auditory cortex can reflect reward-related information (e.g., size of reward, expected reward, and mismatch between expected and received reward) in the absence of auditory stimulation in a behavioral task. A possible source that relays the valence-related information to the auditory cortex is the amygdala.
Using DCM, we tested how the coupling between the amygdala and auditory cortex is modulated as a function of perceived unpleasantness and acoustic features. We created a set of four models: (1) a model in which forward connections from the auditory cortex to the amygdala are modulated by valence or acoustic features, (2) a model in which only backward connections from the amygdala to the auditory cortex are modulated, (3) a model in which both forward and backward connections are modulated, and (4) a control model in which there is no modulatory effect in either direction. Our results show dissociation between the modulatory effect of valence and acoustic features. While valence modulates the backward connections from the amygdala to the auditory cortex, the acoustic feature modulates the forward connections from the auditory cortex to the amygdala. This is consistent with a current model of amygdala function (Mitchell and Greening, 2012) that postulates the amygdala augments, much like the frontoparietal network does with a mundane stimulus, the representation of emotionally salient stimuli in the sensory cortex to make them accessible to consciousness. The evidence for this role of the amygdala is based on anatomical connections from the amygdala to the sensory cortex (Amaral and Price, 1984), functional connectivity studies (Morris et al., 1998; Tschacher et al., 2010), and lesion studies (Anderson and Phelps, 2001; Rotshtein et al., 2001; Vuilleumier et al., 2004).
Conclusions
Based on our analysis of the brain response to unpleasant sounds, the overall model of how the brain processes unpleasant sounds can be summarized as follows: the stimulus is first processed to a high level in the auditory cortex (STG), which portends the assignment of valence in the amygdala. The amygdala, in turn, modulates the auditory cortex in accordance with the valence of sounds.
Since in the current study we used only unpleasant sound stimuli, the above model may be valid only for processing of these stimuli. Evidence for different brain responses to positive and negative valence stimuli exists. For example, negative stimuli are perceived to be more salient (Hansen and Hansen, 1988) and electrophysiological studies (Carretié et al., 2001, 2004; Smith et al., 2003) show stronger and faster responses to negative stimuli (Negative bias) than to positive stimuli. Functional imaging studies show different networks of brain regions may be involved in processing of positive and negative stimuli (Aldhafeeri et al., 2012). Whether the above model holds for stimuli with positive valence and also other negative affect stimuli (e.g., negative words) needs to be tested in future studies.
Footnotes
This work was supported by funding from the Wellcome Trust.
References
- Abercrombie HC, Schaefer SM, Larson CL, Oakes TR, Lindgren KA, Holden JE, Perlman SB, Turski PA, Krahn DD, Benca RM, Davidson RJ. Metabolic rate in the right amygdala predicts negative affect in depressed patients. Neuroreport. 1998;9:3301–3307. doi: 10.1097/00001756-199810050-00028. [DOI] [PubMed] [Google Scholar]
- Aggleton JP, Burton MJ, Passingham RE. Cortical and subcortical afferents to the amygdala of the rhesus monkey (Macaca mulatta) Brain Res. 1980;190:347–368. doi: 10.1016/0006-8993(80)90279-6. [DOI] [PubMed] [Google Scholar]
- Aldhafeeri FM, Mackenzie I, Kay T, Alghamdi J, Sluming V. Regional brain responses to pleasant and unpleasant IAPS pictures: different networks. Neurosci Lett. 2012;512:94–98. doi: 10.1016/j.neulet.2012.01.064. [DOI] [PubMed] [Google Scholar]
- Amaral DG, Price JL. Amygdalo-cortical projections in the monkey (Macaca fascicularis) J Comp Neurol. 1984;230:465–496. doi: 10.1002/cne.902300402. [DOI] [PubMed] [Google Scholar]
- Anderson AK, Phelps EA. Lesions of the human amygdala impair enhanced perception of emotionally salient events. Nature. 2001;411:305–309. doi: 10.1038/35077083. [DOI] [PubMed] [Google Scholar]
- Ball T, Rahm B, Eickhoff SB, Schulze-Bonhage A, Speck O, Mutschler I. Response properties of human amygdala subregions: evidence based on functional MRI combined with probabilistic anatomical maps. PLoS One. 2007;2:e307. doi: 10.1371/journal.pone.0000307. [DOI] [PMC free article] [PubMed] [Google Scholar]
- Blood AJ, Zatorre RJ. Intensely pleasurable responses to music correlate with activity in brain regions implicated in reward and emotion. Proc Natl Acad Sci U S A. 2001;98:11818–11823. doi: 10.1073/pnas.191355898. [DOI] [PMC free article] [PubMed] [Google Scholar]
- Bordi F, LeDoux J. Sensory tuning beyond the sensory system: an initial analysis of auditory response properties of neurons in the lateral amygdaloid nucleus and overlying areas of the striatum. J Neurosci. 1992;12:2493–2503. doi: 10.1523/JNEUROSCI.12-07-02493.1992. [DOI] [PMC free article] [PubMed] [Google Scholar]
- Brosch M, Selezneva E, Scheich H. Representation of reward feedback in primate auditory cortex. Front Syst Neurosci. 2011;5:5. doi: 10.3389/fnsys.2011.00005. [DOI] [PMC free article] [PubMed] [Google Scholar]
- Carretié L, Mercado F, Tapia M, Hinojosa JA. Emotion, attention, and the “negativity bias,” studied through event-related potentials. Int J Psychophysiol. 2001;41:75–85. doi: 10.1016/s0167-8760(00)00195-1. [DOI] [PubMed] [Google Scholar]
- Carretié L, Hinojosa JA, Martín-Loeches M, Mercado F, Tapia M. Automatic attention to emotional stimuli: neural correlates. Hum Brain Mapp. 2004;22:290–299. doi: 10.1002/hbm.20037. [DOI] [PMC free article] [PubMed] [Google Scholar]
- Du Y, Huang Q, Wu X, Galbraith GC, Li L. Binaural unmasking of frequency-following responses in rat amygdala. J Neurophysiol. 2009;101:1647–1659. doi: 10.1152/jn.91055.2008. [DOI] [PubMed] [Google Scholar]
- Eickhoff SB, Stephan KE, Mohlberg H, Grefkes C, Fink GR, Amunts K, Zilles K. A new SPM toolbox for combining probabilistic cytoarchitectonic maps and functional imaging data. Neuroimage. 2005;25:1325–1335. doi: 10.1016/j.neuroimage.2004.12.034. [DOI] [PubMed] [Google Scholar]
- Fecteau S, Belin P, Joanette Y, Armony JL. Amygdala responses to nonlinguistic emotional vocalizations. Neuroimage. 2007;36:480–487. doi: 10.1016/j.neuroimage.2007.02.043. [DOI] [PubMed] [Google Scholar]
- Friston K. Causal modelling and brain connectivity in functional magnetic resonance imaging. PLoS Biol. 2009;7:e33. doi: 10.1371/journal.pbio.1000033. [DOI] [PMC free article] [PubMed] [Google Scholar]
- Friston KJ, Mechelli A, Turner R, Price CJ. Nonlinear responses in fMRI: the Balloon model, Volterra kernels, and other hemodynamics. Neuroimage. 2000;12:466–477. doi: 10.1006/nimg.2000.0630. [DOI] [PubMed] [Google Scholar]
- Friston KJ, Harrison L, Penny W. Dynamic causal modelling. Neuroimage. 2003;19:1273–1302. doi: 10.1016/s1053-8119(03)00202-7. [DOI] [PubMed] [Google Scholar]
- Grandjean D, Sander D, Pourtois G, Schwartz S, Seghier ML, Scherer KR, Vuilleumier P. The voices of wrath: brain responses to angry prosody in meaningless speech. Nat Neurosci. 2005;8:145–146. doi: 10.1038/nn1392. [DOI] [PubMed] [Google Scholar]
- Hansen CH, Hansen RD. Finding the face in the crowd: an anger superiority effect. J Pers Soc Psychol. 1988;54:917–924. doi: 10.1037//0022-3514.54.6.917. [DOI] [PubMed] [Google Scholar]
- Kaas R, Raftery A. Bayes factors. J Am Stat Assoc. 1995;90:773–795. [Google Scholar]
- Kadohisa M, Verhagen JV, Rolls ET. The primate amygdala: neuronal representations of the viscosity, fat texture, temperature, grittiness and taste of foods. Neuroscience. 2005;132:33–48. doi: 10.1016/j.neuroscience.2004.12.005. [DOI] [PubMed] [Google Scholar]
- Ketter TA, Andreason PJ, George MS, Lee C, Gill DS, Parekh PI, Willis MW, Herscovitch P, Post RM. Anterior paralimbic mediation of procaine-induced emotional and psychosensory experiences. Arch Gen Psychiatry. 1996;53:59–69. doi: 10.1001/archpsyc.1996.01830010061009. [DOI] [PubMed] [Google Scholar]
- Kumar S, Forster HM, Bailey P, Griffiths TD. Mapping unpleasantness of sounds to their auditory representation. J Acoust Soc Am. 2008;124:3810–3817. doi: 10.1121/1.3006380. [DOI] [PubMed] [Google Scholar]
- Lane RD, Reiman EM, Bradley MM, Lang PJ, Ahern GL, Davidson RJ, Schwartz GE. Neuroanatomical correlates of pleasant and unpleasant emotion. Neuropsychologia. 1997;35:1437–1444. doi: 10.1016/s0028-3932(97)00070-5. [DOI] [PubMed] [Google Scholar]
- Lang PJ, Bradley MM, Fitzsimmons JR, Cuthbert BN, Scott JD, Moulder B, Nangia V. Emotional arousal and activation of the visual cortex: an fMRI analysis. Psychophysiology. 1998;35:199–210. [PubMed] [Google Scholar]
- LeDoux JE. Emotion circuits in the brain. Annu Rev Neurosci. 2000;23:155–184. doi: 10.1146/annurev.neuro.23.1.155. [DOI] [PubMed] [Google Scholar]
- LeDoux JE, Sakaguchi A, Reis DJ. Subcortical efferent projections of the medial geniculate nucleus mediate emotional responses conditioned to acoustic stimuli. J Neurosci. 1984;4:683–698. doi: 10.1523/JNEUROSCI.04-03-00683.1984. [DOI] [PMC free article] [PubMed] [Google Scholar]
- LeDoux JE, Cicchetti P, Xagoraris A, Romanski LM. The lateral amygdaloid nucleus: sensory interface of the amygdala in fear conditioning. J Neurosci. 1990a;10:1062–1069. doi: 10.1523/JNEUROSCI.10-04-01062.1990. [DOI] [PMC free article] [PubMed] [Google Scholar]
- LeDoux JE, Farb C, Ruggiero DA. Topographic organization of neurons in the acoustic thalamus that project to the amygdala. J Neurosci. 1990b;10:1043–1054. doi: 10.1523/JNEUROSCI.10-04-01043.1990. [DOI] [PMC free article] [PubMed] [Google Scholar]
- Mirz F, Gjedde A, Sødkilde-Jrgensen H, Pedersen CB. Functional brain imaging of tinnitus-like perception induced by aversive auditory stimuli. Neuroreport. 2000;11:633–637. doi: 10.1097/00001756-200002280-00039. [DOI] [PubMed] [Google Scholar]
- Mitchell DG, Greening SG. Conscious perception of emotional stimuli: brain mechanisms. Neuroscientist. 2012;18:386–398. doi: 10.1177/1073858411416515. [DOI] [PubMed] [Google Scholar]
- Mormann F, Dubois J, Kornblith S, Milosavljevic M, Cerf M, Ison M, Tsuchiya N, Kraskov A, Quiroga RQ, Adolphs R, Fried I, Koch C. A category-specific response to animals in the right human amygdala. Nat Neurosci. 2011;14:1247–1249. doi: 10.1038/nn.2899. [DOI] [PMC free article] [PubMed] [Google Scholar]
- Morris JS, Friston KJ, Büchel C, Frith CD, Young AW, Calder AJ, Dolan RJ. A neuromodulatory role for the human amygdala in processing emotional facial expressions. Brain. 1998;121:47–57. doi: 10.1093/brain/121.1.47. [DOI] [PubMed] [Google Scholar]
- Morris JS, Scott SK, Dolan RJ. Saying it with feeling: neural responses to emotional vocalizations. Neuropsychologia. 1999;37:1155–1163. doi: 10.1016/s0028-3932(99)00015-9. [DOI] [PubMed] [Google Scholar]
- Morrison SE, Salzman CD. Re-valuing the amygdala. Curr Opin Neurobiol. 2010;20:221–230. doi: 10.1016/j.conb.2010.02.007. [DOI] [PMC free article] [PubMed] [Google Scholar]
- Pessoa L, McKenna M, Gutierrez E, Ungerleider LG. Neural processing of emotional faces requires attention. Proc Natl Acad Sci U S A. 2002;99:11458–11463. doi: 10.1073/pnas.172403899. [DOI] [PMC free article] [PubMed] [Google Scholar]
- Phelps EA, LeDoux JE. Contributions of the amygdala to emotion processing: from animal models to human behavior. Neuron. 2005;48:175–187. doi: 10.1016/j.neuron.2005.09.025. [DOI] [PubMed] [Google Scholar]
- Phillips ML, Young AW, Scott SK, Calder AJ, Andrew C, Giampietro V, Williams SC, Bullmore ET, Brammer M, Gray JA. Neural responses to facial and vocal expressions of fear and disgust. Proc Biol Sci. 1998;265:1809–1817. doi: 10.1098/rspb.1998.0506. [DOI] [PMC free article] [PubMed] [Google Scholar]
- Plichta MM, Gerdes AB, Alpers GW, Harnisch W, Brill S, Wieser MJ, Fallgatter AJ. Auditory cortex activation is modulated by emotion: a functional near-infrared spectroscopy (fNIRS) study. Neuroimage. 2011;55:1200–1207. doi: 10.1016/j.neuroimage.2011.01.011. [DOI] [PubMed] [Google Scholar]
- Poncelet BP, Wedeen VJ, Weisskoff RM, Cohen MS. Brain parenchyma motion: measurement with cine echo-planar MR imaging. Radiology. 1992;185:645–651. doi: 10.1148/radiology.185.3.1438740. [DOI] [PubMed] [Google Scholar]
- Rolls ET. Emotion explained. Oxford: Oxford UP; 2007. [Google Scholar]
- Romanski LM, LeDoux JE. Information cascade from primary auditory cortex to the amygdala: corticocortical and corticoamygdaloid projections of temporal cortex in the rat. Cereb Cortex. 1993;3:515–532. doi: 10.1093/cercor/3.6.515. [DOI] [PubMed] [Google Scholar]
- Rotshtein P, Malach R, Hadar U, Graif M, Hendler T. Feeling or features: different sensitivity to emotion in high-order visual cortex and amygdala. Neuron. 2001;32:747–757. doi: 10.1016/s0896-6273(01)00513-x. [DOI] [PubMed] [Google Scholar]
- Sander K, Scheich H. Auditory perception of laughing and crying activates human amygdala regardless of attentional state. Brain Res Cogn Brain Res. 2001;12:181–198. doi: 10.1016/s0926-6410(01)00045-3. [DOI] [PubMed] [Google Scholar]
- Scheich H, Brechmann A, Brosch M, Budinger E, Ohl FW, Selezneva E, Stark H, Tischmeyer W, Wetzel W. Behavioral semantics of learning and crossmodal processing in auditory cortex: the semantic processor concept. Hear Res. 2011;271:3–15. doi: 10.1016/j.heares.2010.10.006. [DOI] [PubMed] [Google Scholar]
- Shamma S. Encoding sound timbre in the auditory system. IETE J Res. 2003;49:145–156. [Google Scholar]
- Smith NK, Cacioppo JT, Larsen JT, Chartrand TL. May I have your attention, please: electrocortical responses to positive and negative stimuli. Neuropsychologia. 2003;41:171–183. doi: 10.1016/s0028-3932(02)00147-1. [DOI] [PubMed] [Google Scholar]
- Stephan KE, Penny WD, Daunizeau J, Moran RJ, Friston KJ. Bayesian model selection for group studies. Neuroimage. 2009;46:1004–1017. doi: 10.1016/j.neuroimage.2009.03.025. [DOI] [PMC free article] [PubMed] [Google Scholar]
- Tschacher W, Schildt M, Sander K. Brain connectivity in listening to affective stimuli: a functional magnetic resonance imaging (fMRI) study and implications for psychotherapy. Psychother Res. 2010;20:576–588. doi: 10.1080/10503307.2010.493538. [DOI] [PubMed] [Google Scholar]
- Viinikainen M, Katsyri J, Sams M. Representation of perceived sound valence in the human brain. Hum Brain Mapp. 2011 doi: 10.1002/hbm.21362. [DOI] [PMC free article] [PubMed] [Google Scholar]
- von Kriegstein K, Warren JD, Ives DT, Patterson RD, Griffiths TD. Processing the acoustic effect of size in speech sounds. Neuroimage. 2006;32:368–375. doi: 10.1016/j.neuroimage.2006.02.045. [DOI] [PubMed] [Google Scholar]
- Vuilleumier P, Richardson MP, Armony JL, Driver J, Dolan RJ. Distant influences of amygdala lesion on visual cortical activation during emotional face processing. Nat Neurosci. 2004;7:1271–1278. doi: 10.1038/nn1341. [DOI] [PubMed] [Google Scholar]
- Weiskopf N, Hutton C, Josephs O, Deichmann R. Optimal EPI parameters for reduction of susceptibility-induced BOLD sensitivity losses: a whole-brain analysis at 3 T and 1.5 T. Neuroimage. 2006;33:493–504. doi: 10.1016/j.neuroimage.2006.07.029. [DOI] [PubMed] [Google Scholar]
- Zald DH, Pardo JV. Emotion, olfaction, and the human amygdala: amygdala activation during aversive olfactory stimulation. Proc Natl Acad Sci U S A. 1997;94:4119–4124. doi: 10.1073/pnas.94.8.4119. [DOI] [PMC free article] [PubMed] [Google Scholar]
- Zald DH, Pardo JV. The neural correlates of aversive auditory stimulation. Neuroimage. 2002;16:746–753. doi: 10.1006/nimg.2002.1115. [DOI] [PubMed] [Google Scholar]


