Abstract
The analysis of the molecular mechanisms involved in the initial interaction between neurons and Schwann cells is a key issue in understanding the myelination process. We recently identified Cthrc1 (Collagen triple helix repeat containing 1) as a gene upregulated in Schwann cells upon interaction with the axon. Cthrc1 encodes a secreted protein previously shown to be involved in migration and proliferation in different cell types. We performed a functional analysis of Cthrc1 in Schwann cells by loss- and gain-of-function approaches, using RNA interference knock-down in cell culture and a transgenic mouse line that overexpresses the gene. This work establishes that Cthrc1 enhances Schwann cell proliferation, but prevents myelination. In particular, time-course analysis of myelin formation in transgenic animals reveals that overexpression of Cthrc1 in Schwann cells leads to a delay in myelin formation, with cells maintaining a proliferative state. Our data therefore demonstrate that Cthrc1 plays a negative regulatory role, fine-tuning the onset of peripheral myelination.
Keywords: PNS, myelin, cell proliferation, regulation, axon contact, transgenic mouse
INTRODUCTION
In the peripheral nervous system (PNS), myelination (the formation of the myelin sheath that allows rapid nerve conduction) is carried out by Schwann cells (Jessen and Mirsky, 2005). This process depends on bidirectional interactions between Schwann cells and neurons (Corfas et al., 2004) and is governed by the activation of a regulatory network including the transcription factors Sox10, Krox20/Egr2, Oct6 (Tst1/SCIP/Pou3f1/Oft-6), Brn2 (N-Oct-3/Pou3f2/Oft-7) and NFATc4 in Schwann cells (Ghislain and Charnay, 2006; Kao et al., 2009; Svaren and Meijer, 2008). To investigate the molecular mechanisms by which the initial interaction of Schwann cells with neurons activates the regulatory network, we recently performed an RNA profiling analysis, comparing Schwann cells cultured alone or in the presence of neurons. This allowed the identification of 30 genes that are regulated upon Schwann cell-axon interaction (Blugeon et al., 2011). We hypothesized that some of these genes might play an important role in controlling myelination, as has been shown for other previously identified axon contact-induced genes, such as Krox20, ErbB3, Necl4, and Lgi4 (Birchmeier and Nave, 2008; Maurel et al., 2007; Michailov et al., 2004; Murphy et al., 1996; Ozkaynak et al., 2010; Spiegel et al., 2007; Topilko et al., 1994). Indeed, we recently showed that Dok4, which encodes a membrane-associated tyrosine kinase substrate, is involved in axonal interaction and myelination (Blugeon et al., 2011). In this report, we investigate the function of another gene identified in our screen, that encodes Collagen triple helix repeat containing protein 1 (Cthrc1). Cthrc1 is a 28 kD secreted protein that is glycosylated, contains a short collagen-like motif with 12 Gly-X-Y repeats similar to collagen domains, and has been highly conserved during evolution (Pyagay et al., 2005). Cthrc1 was first identified in an RNA profiling analysis that compared normal and injured rat arteries, suggesting a role for Cthrc1 in vascular remodeling (Pyagay et al., 2005). Later on, high Cthrc1 levels were associated with enhanced migratory potential in embryonic fibroblasts, and in PAC1 smooth muscle and melanoma cells in vitro (Pyagay et al., 2005; Tang et al., 2006), and with enhanced proliferation in osteoblasts (Kimura et al., 2008). High Cthrc1 levels were also associated with reduced and increased collagen deposition in smooth muscle cells (LeClair et al., 2007) and osteoblasts (Kimura et al., 2008), respectively, suggesting that Cthrc1 function varies depending on the cellular context. The role of Cthrc1 has not been investigated in the nervous system, but the protein has been detected in the neural tube and dorsal root ganglia (DRG) at embryonic day (E) 12.5 (Durmus et al., 2006).
We performed a functional analysis of Cthrc1in Schwann cells. In a first series of experiments carried out in vitro, we used RNA interference to generate a loss-of-function model, and show that Cthrc1 enhances Schwann cell proliferation, but prevents myelination. To corroborate this novel function for the protein in vivo, we generated a mouse line specifically overexpressing Cthrc1 in Schwann cells. This led to a delay in myelin formation, which is associated with an increase in cell proliferation. Together, this work establishes that Cthrc1 is a negative regulator of the myelination process.
MATERIALS AND METHODS
Generation of mutant mice, genotyping, use of laboratory animals
Krox20Cre/+ mice have been described previously (Voiculescu et al., 2000). Tg(Cthrc1) mice were generated as follows: rat Cthrc1 coding sequence carrying a C-terminal myc epitope tag was cloned downstream of a floxed GFP sequence driven by the cytomegalovirus (CMV) enhancer/chicken ß-actin promoter (CAG). The CAG-GFP-Cthrc1-myc construct leads to constitutive expression of GFP, but upon Cre recombination, GFP is excised and Cthrc1 is expressed. The construct was tested in 293T cells: co-transfection with a CMV-Cre vector resulted in robust Cthrc1 expression and loss of GFP expression (data not shown). The construct was injected into fertilized mouse eggs and two independent lines were established in the FVB/N background. One line, designed Tg(CAG-GFP-Cthrc1myc)13Vli and abbreviated Tg(Cthrc1), was used in this study. Genotyping was performed by PCR on tail DNA using primers specific for Cre (5'-GTCCGGGCTGCCACGACCAA-3' and 5'-ACGGAAATCCATCGCTCGACCAGT-3'), and Tg(Cthrc1) (5'-GAATCCCAAGGTGAAGCAAA-3' and 5'-AGCGTCTCCTTTGGGGTAAT-3'). Recombinant DNA and animal manipulations were performed according to French and EU regulations. The protocol was approved by the local Committee on the Ethics of Animal Experiments “Charles Darwin”. All efforts were made to minimize animal suffering.
Cell culture and transfection
Dorsal root ganglia (DRG) and primary Schwann cells from E17.5 Sprague-Dawley rat embryos were prepared as described previously (Blugeon et al., 2011; Chernousov et al., 2006). 105 Schwann cells were seeded onto neurons from DRG cultures and allowed to proliferate and align along the axons for 3–4 days. Myelination was initiated by addition of ascorbic acid (50 μg/ml) and medium was changed every 2–3 days. In experiments involving siRNA transfection, purified Schwann cells were first transfected with a siRNA prior to the co-culture. RNA-oligonucleotides (Ambion) were transfected onto cultured Schwann cells using the rat oligodendrocyte Amaxa's Nucleofector kit, according to the manufacturer's instructions. The following target sequences were used: Cthrc1, 5'-CCAUUGAAGCUAUCAUCUAtt (siRNA Cthrc1-1), 5'-GGGAAGUGGUAGACCUGUAtt (siRNA Cthrc1–2), and a control-siRNA (Si-RNA Negative 1, Ambion). The extent of myelination was quantified 10 to 14 days after transfection by measuring the cumulative length of myelinated MBP-positive segments in 10 random fields per culture, viewed at 10× magnification using ImageJ software. Experiments were repeated 3 times with triplicates within each experiment.
Cell mobility, proliferation and survival assays
For cell motility assays, Schwann cells co-transfected with siRNA and a GFP reporter were seeded at 180,000 cell/cm2 in culture inserts (Ibidi) placed in Poly-L-Lysine (PLL) coated wells. The following day the insert was removed, the well was filled with serum-free medium and invasion of the gap by Schwann cells was followed as previously described (Blugeon et al., 2011). The colonization of the cell-fee area was determined using the NIS-Elements D 2.30 software and normalized with the control siRNA over 9 h after insert removal. In vitro, the levels of Schwann cell proliferation and apoptosis were assessed for cells co-transfected with siRNAs and GFP by quantifying BrdU- and TUNEL-positive nuclei, respectively, among GFP-positive cells, as previously described (Blugeon et al., 2011). The proportions of BrdU- and TUNEL-positive nuclei among the GFP-positive cells were determined in five random fields per culture viewed at 20× magnification. Three experiments were performed with 2–3 coverslips in each case and statistical significance was evaluated using Student's t-tests. For in vivo experiments, two intraperitoneal injections of BrdU (60 mg/kg of body weight) were performed at 2 h intervals and the animals were sacrificed 2 h after the second injection. Sciatic nerves were collected and processed for BrdU immunostaining. Double immuno-labelling was performed on additional sections with antibodies against Oct6 (Santacruz, 1/150) and phospho-histone3 (Temecula California, Millipore 1/100). Nuclei were counterstained with bisbenzimide (Hoechst 33342, Sigma). The number of BrdU-, TUNEL-, Oct6- and phospho-histone3-positive nuclei and the total number of nuclei (with a minimum of 1500 per experiment) were determined. Results shown are the averages ± s.e.m. from three animals for each time point. Statistical significance was evaluated using Student's t tests.
Western blotting and immunochemistry
Western blot analyses were performed as previously described (Blugeon et al., 2011; Decker et al., 2006) on sciatic nerves and cultured Schwann cells using a rabbit polyclonal antibody against Cthrc1 (1:3000 (Pyagay et al., 2005)), which recognizes the major form (28 kDa) of the protein under reducing conditions, a mouse monoclonal antibody against Cthrc1 (1:10000, Abcam), which recognizes the major form (55 kDa) under non-reducing conditions, or with a mouse monoclonal antibody against P0 (1:5000 obtained from Dr. Thomas, Paris, France) and mouse anti-ß-actin (1:2000, Sigma). For immunochemistry, sciatic nerves were collected, fixed in 4% paraformaldehyde (PFA) for 2 h, incubated overnight at 4°C in 20% sucrose, embedded in Tissue-Tek OCT compound (Gassalem, Limeil-Brévannes, France) and frozen in isopentane (−60°C). 10 or 20 μm-thick transversal sections were collected using a Leica cryotome. Sections were processed as previously described (Decker et al., 2006). Cultured cells were fixed for 10 min in 4% PFA at room temperature, rinsed with 0.1 M PBS, blocked for 30 min in PBS plus 4% Bovine Serum Albumin and processed as previously described (Blugeon et al., 2010). To stain myelin internodes, formaldehyde-fixed cells were permeabilized for 10 min in ethanol, rinsed in PBS, blocked for 30 min and then processed as described (Blugeon et al., 2011). The following primary antibodies were used: mouse monoclonal anti-2H3 (1:800, DSHB), rabbit polyclonal anti-Cthrc1 (1:500 (Pyagay et al., 2005)), rat polyclonal anti-MBP (1:100, Millipore) and rat anti-BrdU (1:100, Millipore).
Quantitative reverse transcriptase-polymerase chain reaction
Total RNA and cDNA from mouse sciatic nerves were prepared as previously described (Blugeon et al., 2010) and relative gene expression levels were measured in duplicate or triplicate by qPCR on a Lightcycler (Roche), using the Quanti Tect SYBR-Green PCR kit (Qiagen) and normalized to protoporphyrinogen oxidase, tubulin 1b and peptidylprolyl isomerase B, ß-actin and Gapdh. Primer sequences are available on request.
Electron microscopy
Sciatic nerves were prepared as previously described (Decker et al., 2006). Briefly, nerves were fixed in 2.5% glutaraldehyde and osmificated for 1 h in 2% OsO4 (Polysciences). Nerves were then dehydrated in graded acetone and embedded in Epon 812-Araldite. For light microscopy analysis, sections were stained with toluidine blue. Ultra-thin sections were stained with uranyl acetate and lead citrate and observed with a Philips CM10 electron microscope.
RESULTS
Cthrc1 promotes Schwann cell proliferation in vitro
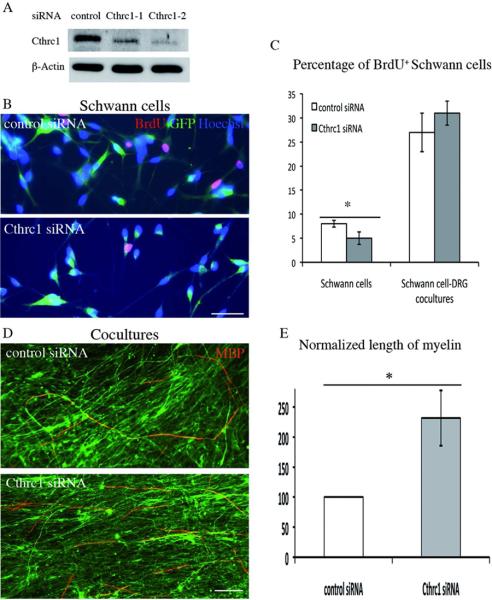
RNA profiling analysis had indicated that Cthrc1 expression is up-regulated in Schwann cells upon interaction with axons (Blugeon et al., 2011). We therefore investigated whether Cthrc1 loss-of-function, obtained by transfection of short interfering RNAs (siRNAs), affected Schwann cell properties. Schwann cells were prepared from E17.5 rat sciatic nerve, established in culture and transfected as previously described (Blugeon et al., 2011). We used two different Cthrc1-specific siRNAs and a negative control (siRNA Negative 1, Ambion) and assessed the efficiency of the knock-down by Western blot analysis for the Cthrc1 protein 3 and 7 days after transfection. A strong reduction in Cthrc1 levels was observed at both time-points (Fig. 1A and data not shown). The most efficient Cthrc1 siRNA (Cthrc1-2) was used for subsequent experiments.
Figure 1. Cthrc1 knock-down inhibits Schwann cell proliferation, but promotes myelination.
John Wiley & Sons, Inc.
A) Western blot analysis of Cthrc1 in protein extracts prepared 3 days after transfection from Schwann cells transfected with control and two Cthrc1 siRNAs as indicated. Control siRNA corresponds to the negative control provided by Ambion (siRNA Negative 1). The level of ß-actin was used as normalization control. B) Cell proliferation was assessed after siRNA transfection by BrdU incorporation, detected by immunocytochemistry (BrdU, red). The cells were co-transfected with a GFP expression vector, with GFP expression shown in green. Nuclei were counterstained with Hoechst (blue). Scale bars: 50 μm. C) Percentage of BrdU-positive nuclei in control or Cthrc1 siRNA-transfected (GFP-positive) Schwann cells. Values are means ± s.e.m of three (culture) and four (co-culture) independent experiments. Statistical significance was analyzed using the Student's t test: *p<0.05. D,E) Myelination potential of siRNA-transfected Schwann cells was estimated by co-culture with DRG neurons. D) Anti-MBP staining (red) shows the presence of myelin in co-cultures of neurons and Schwann cells electroporated with siRNAs as indicated and induced to myelinate with ascorbic acid. Axons were labeled with neurofilament staining (anti-2H3, green). Scale bars: 100 μm. E) Quantification of the myelination data. The total length of myelinated segments was measured in the co-cultures and normalized with the control siRNA. Error bars represent s.e.m from 3 independent experiments. Statistical significance was analyzed using Student's t test: *p<0.001.
As Schwann cells that interact with neurons receive proliferative signals (Birchmeier and Nave, 2008), we evaluated the effect of Cthrc1 knock-down on the proliferation of Schwann cells cultured alone or co-cultured with DRG neurons. Schwann cells were co-transfected with siRNAs and a GFP reporter construct to allow identification of transfected cells (see Materials and methods). Proliferation rate was estimated by BrdU incorporation. In isolated Schwann cells, this analysis revealed a modest but significant decrease in proliferation upon Cthrc1 knock-down (8 ± 0.7 versus 5 ± 1.3 %; Student's t-test, p<0.05; Fig. 1B,C). In co-cultures, however, the proportion of proliferative cells was not significantly affected by the knock-down of Cthrc1 (Fig. 1C). These data indicate that Cthrc1 can act as a positive regulator of Schwann cell proliferation, but that this effect is not observed in co-culture conditions. No significant difference in cell death was detected in either condition, as assessed by TUNEL assays (data not shown).
Cthrc1 antagonizes myelination in vitro
We hypothesized that Cthrc1 may be involved in myelination. Schwann cells were transfected with siRNAs and subsequently co-cultured with purified DRG neurons. After co-cultures were established, myelination was induced by addition of ascorbic acid, and the presence of myelin was assessed with an antibody against Myelin Basic Protein (MBP) as previously described (Blugeon et al., 2011). The extent of myelination was quantified by measuring the number of myelinated sections, their length and the total length of the myelinated segments (Fig. 1D,E). This analysis revealed that total myelin length is increased by approximately 2-fold in the presence of Cthrc1 siRNA (Fig. 1E), reflecting an increase in both the number of segments (193% ±10) and their mean length (122% ±7). This indicates that Cthrc1 either inhibits or delays myelination.
Cthrc1 reduces Schwann cell migration in vitro
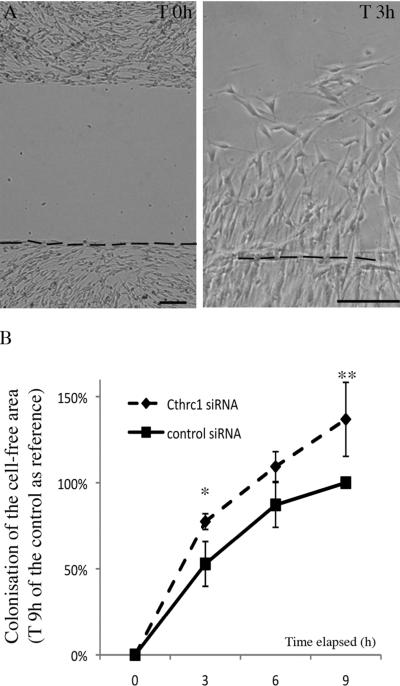
Cthrc1 expression has not yet been reported in Schwann cells, but the protein has been shown to be involved in modulating cell migration in various other cell types (Kimura et al., 2008). We therefore investigated whether Cthrc1 knock-down affected Schwann cell migration. To evaluate migration potential, the cells were treated with Cthrc1 or control siRNAs and seeded within the two chambers of a culture-insert (see Blugeon et al., 2011). The following day, the insert was removed, creating a cell-free gap (Fig. 2A) that was monitored over 9 hours. The area colonized by the cells during this period was determined and taken as a measure of cell motility (Fig. 2B). This area was increased in siRNA-treated cells, demonstrating that Cthrc1-siRNA transfected cells were significantly more motile than control-siRNA transfected cells (Fig. 2B).
Figure 2. Cthrc1 knock-down promotes cell migration.
John Wiley & Sons, Inc.
A) Illustration of a Schwann cell culture at the time of the creation of the gap (T 0h) and 3 h later (T 3h). The dotted line indicates the initial inferior limit of the gap. Scale bars: 100 μm. B) Quantification of the colonization of the gap by Schwann cells transfected with Cthrc1 or control siRNAs. The covered areas were measured and normalized with the area invaded with control siRNA at T 9 h. Data represent mean ± s.e.m of duplicate cultures from three independent experiments and statistical significance of the difference was analyzed using the Student's t test: p<0.05 at 3 h and p<0.02 at 9 h.
Dynamic expression of Cthrc1 in developing Schwann cells
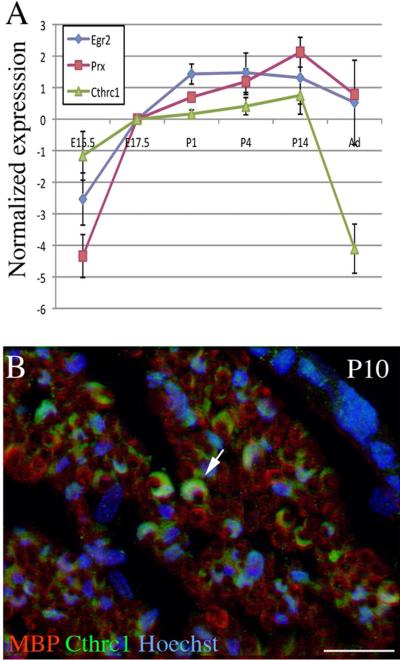
To investigate the possible role of Cthrc1 in Schwann cells' control of myelination in vivo, we first examined its expression in the sciatic nerve from E15.5 to adulthood by quantitative reverse transcriptase-polymerase chain reaction (qPCR), using Krox20 and periaxin, which are induced upon axonal contact, as positive controls. As previously shown (Blugeon et al., 2011), Krox20 and periaxin show similar dynamics, with a strong increase in relative expression until birth, followed by a plateau (Fig. 3A). In a slightly different pattern, Cthrc1 expression progressively increased from E15.5 until postnatal day (P)14 and then drastically decreased until adulthood (Fig. 3A). We confirmed that the protein was present in Schwann cells at P10 by immunohistochemistry in transverse sections of mouse sciatic nerve with antibodies against Cthrc1 and MBP (Fig. 3B), and at a series of postnatal stages by Western blotting (Fig. 4B). Although the protein is expected to be secreted, it was easily detected in the cytoplasm (Fig. 3B). In conclusion, Cthrc1 is transiently up-regulated in Schwann cells during the myelination period.
Figure 3. Dynamic Cthrc1 expression in the developing peripheral nerve.
John Wiley & Sons, Inc.
A) The relative levels of expression of Cthrc1, Krox20 and Prx during peripheral nerve development were estimated by qPCR analysis. The data represent mean values ± s.e.m of the log2 of the relative level of expression of each gene, normalized by its value at E17.5 for 3 independent experiments. B) Transverse sections from P10 mouse sciatic nerves were immunolabeled for MBP (red), and Cthrc1 (green). Cell nuclei were counterstained with Hoechst 33342 (blue). Note the detection of the protein in the cytoplasm (arrow). Scale bar: 30 μm.
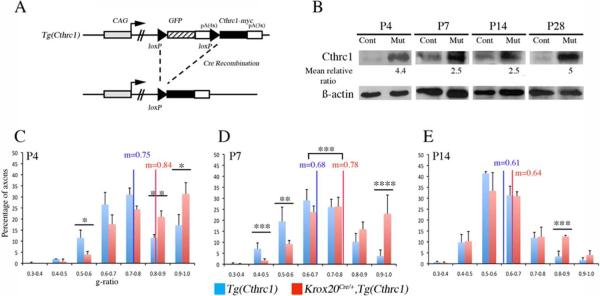
Figure 4. Mouse model overexpressing Cthrc1 in Schwann cells.
John Wiley & Sons, Inc.
A) Schematic representation of the transgene, Tg(Cthrc1). In the original configuration, GFP is expressed from the transgene locus, but not Cthrc1. Cre recombination leads to activation of a myc-tagged version of Cthrc1. pA, polyA. B) Western blotting analysis of protein extracts prepared from sciatic nerves from Tg(Cthrc1) control (Cont) and Krox20Cre/+,Tg(Cthrc1) mutant (Mut) animals at P4, P7, P14, and P28. The ratio of the intensities of the Cthrc1 55 kDa bands between mutant and control, normalized by the level of ß-actin, is indicated below. C–E) Analysis of the distributions and means of g-ratios in Tg(Cthrc1) control and Krox20Cre/+,Tg(Cthrc1) mutant animals at P4 (C), P7 (D) and P14 (E). Only axons with a caliber superior to 1 μm were considered in this analysis. The statistical significance was analyzed using the Student's t test: *p<0.05; **p<0.02; ***p<0.01. Four animals were analyzed at each time point, excepted at P4 were only 2 controls were analyzed. Error bars indicate s.e.m.
Mice overexpressing Cthrc1 show delayed myelination
To investigate a possible function of Cthrc1 in PNS myelination, we overexpressed the gene in Schwann cells in vivo, using a transgenic line, Tg(Cthrc1), which induces permanent Cthrc1 expression upon Cre recombination (Fig. 4A; Cuttler et al., 2011). The transgene was combined with a Cre driver, Krox20Cre, that is specifically expressed in Schwann cells in the PNS (Voiculescu et al., 2000). Krox20Cre/+,Tg(Cthrc1) animals survive and reproduce normally. Cthrc1 expression in the sciatic nerve was assessed by Western blot (Fig. 4B). When compared to control animals, Cre recombination in Schwann cells leads to a several-fold increase in Cthrc1 protein level during the postnatal period, with a maximum at P28 (Fig. 4B). A similar induction was observed at the RNA level, measured by qPCR. RNA levels are increased by 2.4-fold ± 0.9 at P7 (n=5, p<0.01), 2.8-fold ± 0.2 at P14 (n=2, p<0.007), and 17-fold ± 0.8 at P28 (n=2, p<0.01). These data confirm that transgenic animals overexpress Cthrc1 in Schwann cells as expected.
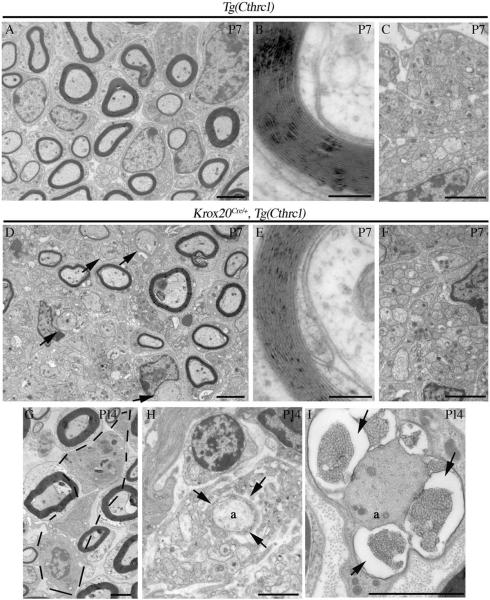
We then investigated whether overexpression affected sciatic nerve myelination. Electron microscopy analysis was performed at an early stage in the myelination process (P4), at two intermediate stages (P7, P14) and when myelination is advanced (P28). At P4, in Krox20Cre/+,Tg(Cthrc1) mutants, although the compaction of the myelin sheath was normal, some large-caliber axons appeared unmyelinated (data not shown). To quantify changes in myelin sheath thickness of mutant animals, the g-ratio (axon diameter over myelinated fiber total diameter) was measured and the axonal distribution according to the g-ratio was analyzed (Fig. 4C). Krox20Cre/+,Tg(Cthrc1) mutants show a significantly lower percentage of axons having a g-ratio ranging from 0.5 to 0.6 (p<0.05), and a higher percentage of axons having a g-ratio ranging from 0.8 to 0.9 (p<0.02) and 0.9 to 1 (p<0.05), compared to Tg(Cthrc1) controls. At P7, numerous axons without a myelin sheath are observed and the thickness of the myelin sheath is reduced in the mutants when compared to control littermates (Fig. 4D and 5A,D). At this stage, Krox20Cre/+,Tg(Cthrc1) mutants and Tg(Cthrc1) controls show a significant difference in their mean g-ratio (0.78 in mutants versus 0.68 in controls, p<0.01, n=4, Fig. 4D), clearly demonstrating a reduction in myelin sheath thickness in mutants. In contrast, no significant difference is observed between Krox20Cre/+ animals and Tg(Cthrc1) controls (0.70 ± 0.04 versus 0.70 ± 0.05 respectively, n=3), indicating that the phenotype in Krox20Cre/+,Tg(Cthrc1) animals is not due to a reduction in the dose of Krox20. Despite the increase in mean g-ratio, the compaction of the myelin appears normal in Krox20Cre/+,Tg(Cthrc1) animals (Fig. 5B,E), as does the organization of the unmyelinated small-caliber axons (Fig. 5C,F). At P14, the phenotype is less pronounced, and the difference in the mean g-ratios is not statistically significant (Fig. 4E). Nevertheless, the percentage of axons having a g-ratio ranging from 0.8 to 0.9 (p<0.01) is higher in Krox20Cre/+,Tg(Cthrc1) mutants than in Tg(Cthrc1) controls. In addition, some Schwann cells that attempt but fail to wrap the axons are observed in the mutants (data not shown). Lastly, macrophages (Fig. 5G), a sign of myelin destruction (Fig. 5H) and vesicular modifications of myelin (Fig. 5I) are never observed in control animals, but are occasionally found in P14 Krox20Cre/+,Tg(Cthrc1) mutants, suggesting that either myelin degradation or mis-myelination occur. At P28, no significant differences in mean g-ratio value or axonal distribution occur between mutant and control animals- myelination is complete and no unmyelinated large-caliber axons are observed (data not shown). The results of the morphological studies are corroborated by the level of the major myelin protein, P0, by Western blot analysis- the level of P0 is dramatically reduced at P4 in Krox20Cre/+,Tg(Cthrc1) mutants compared to controls, but it progressively recovers to reach a normal level at P35 (Fig. 6), suggesting a delay in myelin protein synthesis.
Figure 5. Cthrc1 overexpression in Schwann cells delays myelination.
John Wiley & Sons, Inc.
Electron microscopy analysis of control Tg(Cthrc1) (A–C) and Krox20Cre/+,Tg(Cthrc1) (D–I) sciatic nerves analyzed at P7 (A–F) and P14 (G–I). At P7, Cthrc1 overexpressing animals show a higher number of completely denuded axons (D, arrows) as compared with controls (A, arrows). The compaction of the myelin appears normal (B,E) as well as the organization of the non-myelinating fibers (C,F). At P14, macrophage infiltration (G, indicated area), myelin disruption around the axon (H, arrows), and vesicular modifications of the myelin (I, arrows) are occasionally found in Krox20Cre/+,Tg(Cthrc1) mutants, and never observed in control animals. Scale bars: 2 μm in (A,C,D,F–I), 0.2 μm in (B,E).
Figure 6. Cthrc1 overexpression delays P0 expression.
John Wiley & Sons, Inc.
B) Western blotting analysis of protein extracts prepared from sciatic nerves from Tg(Cthrc1) control (Cont) and Krox20Cre/+,Tg(Cthrc1) mutant (Mut) animals at P4, P7, P13, and P35. The ratio of the intensities of P0 bands between mutant and control, normalized by the level of ß-actin, is indicated below.
In smooth muscle cells and osteoblasts, Cthrc1 has been shown to be involved in controlling collagen synthesis (Kimura et al., 2008; Leclair et al., 2008). Schwann cells synthesize several types of collagens at specific steps during their development. These collagens can favor adhesion and migration, but also participate in the formation of the basal membrane, thus affecting myelination (Chernousov et al., 2008; Hubert et al., 2009; Rothblum et al., 2004). Therefore, we evaluated the expression of three collagen genes by RT-PCR at P7, when the myelination defect is morphologically most severe with Cthrc1 overexpression. We detect a slight decrease in the levels of mRNAs for Col5A3 and Col6A in Krox20Cre/+,Tg(Cthrc1) mutants compared to controls (ratios of 0.70 ±0.16 and 0.76 ±0.08, respectively), These collagens are known to activate Schwann cell adhesion and migration (Rothblum et al., 2004) and induce Schwann cell differentiation (Vitale et al., 2001), respectively. In contrast, Cthrc1 overexpression leads to the induction of Col28A (ratio of 1.9 ±0.4), which is expressed in the basal membrane of non-myelinating glial cells (Grimal et al., 2009; Hubert et al., 2009). These different variations are limited, but consistent with the myelination phenotype.
In conclusion, this analysis reveals transient reductions in myelin content, myelin sheath thickness, and the number of myelinated fibers from P4 to P14 in Krox20Cre/+,Tg(Cthrc1) mutants compared to controls, suggesting that overexpression of Cthrc1 results in a delay in the myelination process.
Delays in myelination correlate with persistent Schwann cell proliferation
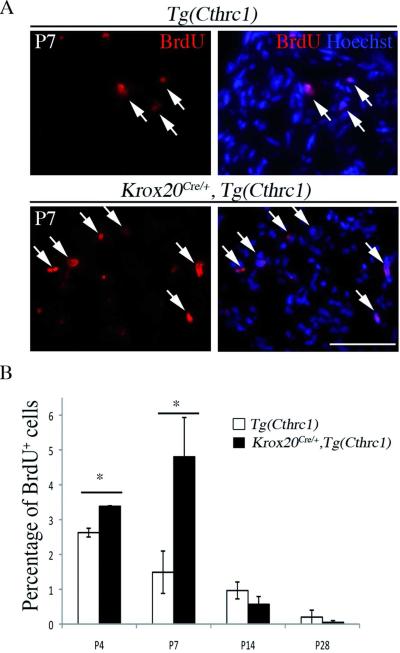
Myelination is normally accompanied by a dramatic reduction in Schwann cell proliferation. We therefore investigated whether the delay in myelination observed in Cthrc1-overexpressing mutants correlates with changes in the rate of Schwann cell proliferation. The proportion of dividing cells was evaluated by BrdU incorporation after two 2 h pulses. We observe a slight increase in the rate of proliferation in mutant mice compared to control animals at P4, and a much larger increase at P7 (Fig. 7A,B, p<0.01). At later stages, no significant differences are observed (Fig. 7B). Since the delay in myelination is accompanied by the appearance of macrophages, it is important to verify that the increase in total cell proliferation rate indeed reflects Schwann cell proliferation. To confirm this, we performed double labeling with a Schwann cell nuclear marker, Oct6, and a mitosis marker, phospho-histone3, at P7. We find that the number of proliferating Schwann cells increases by a factor of 11.2 in Krox20Cre/+,Tg(Cthrc1) mutant animals (p<0.03) and that Schwann cells represent approximately 80% of the proliferating cells in mutants (Fig. 8). Together, these data show a temporal correlation between the delay in myelination and an increase in Schwann cell proliferation in mutant mice overexpressing Cthrc1.
Figure 7. Cthrc1 overexpression leads to increased cell proliferation.
John Wiley & Sons, Inc.
Cell proliferation was estimated by BrdU incorporation. The animals were intraperitoneally injected with BrdU, whose incorporation into DNA was detected by immunostaining of sciatic nerve sections. A) The micrographs show BrdU staining (red) alone or combined with nuclei counterstaining using Hoechst 33342 (blue) on sciatic nerve sections from Tg(Cthrc1) control or Krox20Cre/+,Tg(Cthrc1) mutant mice at P7. Arrows point to double-labeled cells. B) Quantification of the cell proliferation assay. Note that cell proliferation is enhanced at P4 and P7 in Krox20Cre/+,Tg(Cthrc1) mutant compared to control animals. Values are means ± s.e.m. of three animals. Statistical significance was assessed using the Student's t test: *p<0.01. Scale bars: 50 μm.
Figure 8. The majority of proliferating cells in P7 Cthrc1-overexpressing animals are Schwann cells.

John Wiley & Sons, Inc.
Schwann cell proliferation was estimated on sciatic nerve sections from Krox20cre+/−,Tg(Cthrc1) mutant mice at P7 by double labelling with a Schwann cell marker (Oct6, green) and a mitosis marker (phospho-histone3, pH3, red), combined with nuclei counterstaining using Hoechst 33342 (blue). A–B) Field showing that the large majority of the proliferating cells are Oct6-positive (arrows). The insets show higher magnification of the areas indicated by dotted lines. C–D) Field showing an Oct6-negative proliferating cell presenting a large nucleus (arrowhead) among several Oct6-positive proliferating cells (arrows). Scale bar: 50 μm.
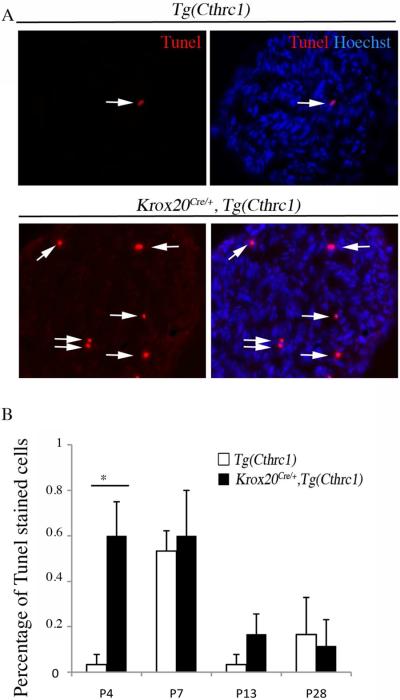
Finally, we examined whether the level of cell death was affected in mutant nerves with Tunel analysis. No significant changes were observed from P7, whereas a significant increase was observed at P4 (Fig. 9). That an increase in cell death precedes the peak of cell proliferation suggests a possible causative link between these two phenotypes.
Figure 9. Analysis of cell apoptosis in the sciatic nerve upon Cthrc1 overexpression.
John Wiley & Sons, Inc.
Tunel staining was combined with nuclei counterstaining using Hoechst 33342 on sciatic nerve sections from control (Tg(Cthrc1)) or mutant (Krox20Cre/+,Tg(Cthrc1)) mice at different stages and the percentage of Tunel-positive nuclei was estimated. A) The micrographs show Tunel staining (red) alone or combined with Hoechst 33342 (blue) on P7 sciatic nerve sections. Arrows point to double-labeled cells. B) Quantification of the Tunel assay. Apoptosis is enhanced at P4 in mutant mice as compared to control animals. Values are means ± s.e.m. of at least 3 mice. Statistical significance was analyzed using the Student's t test: *p<0.001.
DISCUSSION
In this work, we have performed a functional analysis of Cthrc1, a gene upregulated in Schwann cell upon axonal interaction (Blugeon et al., 2011). Cthrc1 encodes a highly conserved protein, that is likely to be secreted and glycosylated. It has been shown to be associated with variations in proliferative, migratory and collagen synthesis activities in fibroblasts, smooth muscle cells and osteoblasts (Kimura et al., 2008; LeClair and Lindner, 2007; Pyagay et al., 2005). However, its function had not been investigated in Schwann cells. Using in vitro loss-of-function and in vivo gain-of-function approaches, we show that Cthrc1 can affect cell proliferation and myelination in Schwann cells, suggesting that it acts as a novel regulator of myelination in the PNS.
Our work shows that cell proliferation can be stimulated by Cthrc1, both in vitro and in vivo. In vitro, however, the stimulation is only observed in the absence of neurons. The absence of increased proliferation in co-culture, which would be expected to better reflect the in vivo situation, is surprising, and further investigation will be required to clarify the basis for this observation. The stimulation of cell proliferation by Cthrc1 in Schwann cells is consistent with its activity in osteoblasts (Kimura et al., 2008), but is in contrast to its inhibitory action in smooth muscle cells (LeClair et al., 2007; Pyagay et al., 2005). This suggests that the effect of Cthrc1 on cell proliferation is dependent on the cellular context. Interestingly, cellular context may also explain the protein's effects on cell migration. We show that Cthrc1 reduces Schwann cell migration in vitro, while previous studies have demonstrated that increased Cthrc1 enhances the migratory ability of fibroblasts and smooth muscle cells (LeClair et al., 2007; Pyagay et al., 2005).
This work also identifies Cthrc1 as a negative regulator of myelination. Myelin formation is significantly increased after gene knock-down in vitro (Fig. 1D,E) and, is delayed in Cthrc1-overexpressing Schwann cells in vivo (Fig. 4,5). An interesting issue is whether the delay in myelination upon Cthrc1 overexpression reflects a direct developmental role of Cthrc1 in the myelination process or is instead an indirect consequence, resulting from myelin degradation. Although we do not definitively demonstrate a developmental role, we favour this explanation for three main reasons. First, the phenotypes are transient, and myelin sheath thickness and P0 levels recover by P14. Second, a direct effect of Cthrc1 overexpression is consistent with the increase in myelination observed in vitro after Cthrc1 knock-down, where degradation of myelin is unlikely. Third, signs of myelin degradation and the presence of macrophages are sporadic and are observed only at P14, and are therefore not likely to explain earlier defects.
As myelination requires the exit of Schwann cells from the cell cycle (Jessen and Mirsky, 2005), the myelination phenotype is consistent with the reduction in cell proliferation after in vitro loss-of-function and the increase in transgenic animals overexpressing Cthrc1 at the P4 and P7 stages, precisely when the delay in myelination is observed. The fact that overexpression of Cthrc1 in transgenic mice only leads to a delay in myelination and not a definitive block can be interpreted in at least two non-exclusive ways. First, there might be a window of competence for Cthrc1 activity, limited to the period between birth and approximately P14, corresponding to the period of active myelination. Second, Cthrc1 might have a limited inhibitory activity, which is only apparent when positive myelination signals are weak, during the early stages of the process. In wild type animals, the expression of Cthrc1 is dynamic, with a progressive increase until P14, followed by a sharp decrease. Regardless of the mechanism preventing Cthrc1 action on myelination at late stages, this pattern of expression is consistent with Cthrc1 playing a role during the onset of myelination. We propose that it is involved in fine-tuning myelination by providing a negative feedback response in the molecular pathway initiated by Schwann cell/axon interaction. A number of other negative regulators of myelination in Schwann cells have been previously identified, including c-jun, p57kip2 and Notch (Heinen et al., 2008; Parkinson et al., 2008; Woodhoo et al., 2009). It remains to be determined whether Cthrc1 is acting in the same pathways and at what level. The importance of very precise control of myelin gene expression, in particular avoiding overexpression, is suggested by several observations. First, overexpression of Krox20, a master positive regulator of myelination, is associated with inhibition of the process (Latasa et al., 2010). Second, the most common cause of Charcot-Marie-Tooth neuropathies in humans is Pmp22 duplication (Barisic et al., 2008), which leads to overexpression of this myelin protein (Huxley et al., 1998; Robaglia-Schlupp et al., 2002). Lastly, the overexpression of Mpz, which encodes the major myelin protein, also causes PNS hypomyelination (Wrabetz et al., 2000).
ACKNOWLEDGMENTS
This work was supported by grants to PC from the Institut National de la Santé et de la Recherche Médicale, Centre National de la Recherche Scientifique, Ministère de l'Education Nationale, de la Recherche et de la Technologie, Association Française contre les Myopathies and ELA Foundation. We are grateful to G. Matesic for help with genotyping and P. Topilko and P. Gongal for helpful discussions and comments on the manuscript.
REFERENCES
- Barisic N, Claeys KG, Sirotkovic-Skerlev M, Lofgren A, Nelis E, De Jonghe P, Timmerman V. Charcot-Marie-Tooth disease: a clinico-genetic confrontation. Ann Hum Genet. 2008;72:416–441. doi: 10.1111/j.1469-1809.2007.00412.x. [DOI] [PubMed] [Google Scholar]
- Birchmeier C, Nave KA. Neuregulin-1, a key axonal signal that drives Schwann cell growth and differentiation. Glia. 2008;56:1491–1497. doi: 10.1002/glia.20753. [DOI] [PubMed] [Google Scholar]
- Blugeon C, Le Crom S, Richard L, Vallat JM, Charnay P, Decker L. Dok4 is involved in Schwann cell myelination and axonal interaction in vitro. Glia in press. 2010 doi: 10.1002/glia.21106. [DOI] [PubMed] [Google Scholar]
- Blugeon C, Le Crom S, Richard L, Vallat JM, Charnay P, Decker L. Dok4 is involved in Schwann cell myelination and axonal interaction in vitro. Glia. 2011;59:351–362. doi: 10.1002/glia.21106. [DOI] [PubMed] [Google Scholar]
- Chernousov MA, Rothblum K, Stahl RC, Evans A, Prentiss L, Carey DJ. Glypican-1 and alpha4(V) collagen are required for Schwann cell myelination. J Neurosci. 2006;26:508–517. doi: 10.1523/JNEUROSCI.2544-05.2006. [DOI] [PMC free article] [PubMed] [Google Scholar]
- Chernousov MA, Yu WM, Chen ZL, Carey DJ, Strickland S. Regulation of Schwann cell function by the extracellular matrix. Glia. 2008;56:1498–1507. doi: 10.1002/glia.20740. [DOI] [PubMed] [Google Scholar]
- Corfas G, Velardez MO, Ko CP, Ratner N, Peles E. Mechanisms and roles of axon-Schwann cell interactions. J Neurosci. 2004;24:9250–9260. doi: 10.1523/JNEUROSCI.3649-04.2004. [DOI] [PMC free article] [PubMed] [Google Scholar]
- Cuttler AS, LeClair RJ, Stohn JP, Wang Q, Sorenson CM, Liaw L, Lindner V. Characterization of Pdgfrb-Cre transgenic mice reveals reduction of ROSA26 reporter activity in remodeling arteries. Genesis. 2011;49:673–680. doi: 10.1002/dvg.20769. [DOI] [PMC free article] [PubMed] [Google Scholar]
- Decker L, Desmarquet-Trin-Dinh C, Taillebourg E, Ghislain J, Vallat JM, Charnay P. Peripheral myelin maintenance is a dynamic process requiring constant Krox20 expression. J Neurosci. 2006;26:9771–9779. doi: 10.1523/JNEUROSCI.0716-06.2006. [DOI] [PMC free article] [PubMed] [Google Scholar]
- Durmus T, LeClair RJ, Park KS, Terzic A, Yoon JK, Lindner V. Expression analysis of the novel gene collagen triple helix repeat containing-1 (Cthrc1) Gene Expr Patterns. 2006;6:935–940. doi: 10.1016/j.modgep.2006.03.008. [DOI] [PubMed] [Google Scholar]
- Ghislain J, Charnay P. Control of myelination in Schwann cells: a Krox20 cis-regulatory element integrates Oct6, Brn2 and Sox10 activities. EMBO Rep. 2006;7:52–58. doi: 10.1038/sj.embor.7400573. [DOI] [PMC free article] [PubMed] [Google Scholar]
- Grimal S, Puech S, Wagener R, Venteo S, Carroll P, Fichard-Carroll A. Collagen XXVIII is a distinctive component of the peripheral nervous system nodes of ranvier and surrounds nonmyelinating glial cells. Glia. 2009;58:1977–1987. doi: 10.1002/glia.21066. [DOI] [PubMed] [Google Scholar]
- Heinen A, Kremer D, Gottle P, Kruse F, Hasse B, Lehmann H, Hartung HP, Kury P. The cyclin-dependent kinase inhibitor p57kip2 is a negative regulator of Schwann cell differentiation and in vitro myelination. Proc Natl Acad Sci U S A. 2008;105:8748–8753. doi: 10.1073/pnas.0802659105. [DOI] [PMC free article] [PubMed] [Google Scholar]
- Hubert T, Grimal S, Carroll P, Fichard-Carroll A. Collagens in the developing and diseased nervous system. Cell Mol Life Sci. 2009;66:1223–1238. doi: 10.1007/s00018-008-8561-9. [DOI] [PMC free article] [PubMed] [Google Scholar]
- Huxley C, Passage E, Robertson AM, Youl B, Huston S, Manson A, Saberan-Djoniedi D, Figarella-Branger D, Pellissier JF, Thomas PK, Fontes M. Correlation between varying levels of PMP22 expression and the degree of demyelination and reduction in nerve conduction velocity in transgenic mice. Hum Mol Genet. 1998;7:449–458. doi: 10.1093/hmg/7.3.449. [DOI] [PubMed] [Google Scholar]
- Jessen KR, Mirsky R. The origin and development of glial cells in peripheral nerves. Nat Rev Neurosci. 2005;6:671–682. doi: 10.1038/nrn1746. [DOI] [PubMed] [Google Scholar]
- Kao SC, Wu H, Xie J, Chang CP, Ranish JA, Graef IA, Crabtree GR. Calcineurin/NFAT signaling is required for neuregulin-regulated Schwann cell differentiation. Science. 2009;323:651–654. doi: 10.1126/science.1166562. [DOI] [PMC free article] [PubMed] [Google Scholar]
- Kimura H, Kwan KM, Zhang Z, Deng JM, Darnay BG, Behringer RR, Nakamura T, de Crombrugghe B, Akiyama H. Cthrc1 is a positive regulator of osteoblastic bone formation. PLoS One. 2008;3:e3174. doi: 10.1371/journal.pone.0003174. [DOI] [PMC free article] [PubMed] [Google Scholar]
- Latasa MJ, Ituero M, Moran-Gonzalez A, Aranda A, Cosgaya JM. Retinoic acid regulates myelin formation in the peripheral nervous system. Glia. 2010;58:1451–1464. doi: 10.1002/glia.21020. [DOI] [PubMed] [Google Scholar]
- LeClair R, Lindner V. The role of collagen triple helix repeat containing 1 in injured arteries, collagen expression, and transforming growth factor beta signaling. Trends Cardiovasc Med. 2007;17:202–205. doi: 10.1016/j.tcm.2007.05.004. [DOI] [PubMed] [Google Scholar]
- LeClair RJ, Durmus T, Wang Q, Pyagay P, Terzic A, Lindner V. Cthrc1 is a novel inhibitor of transforming growth factor-beta signaling and neointimal lesion formation. Circ Res. 2007;100:826–833. doi: 10.1161/01.RES.0000260806.99307.72. [DOI] [PubMed] [Google Scholar]
- Leclair RJ, Wang Q, Benson MA, Prudovsky I, Lindner V. Intracellular localization of Cthrc1 characterizes differentiated smooth muscle. Arterioscler Thromb Vasc Biol. 2008;28:1332–1338. doi: 10.1161/ATVBAHA.108.166579. [DOI] [PMC free article] [PubMed] [Google Scholar]
- Maurel P, Einheber S, Galinska J, Thaker P, Lam I, Rubin MB, Scherer SS, Murakami Y, Gutmann DH, Salzer JL. Nectin-like proteins mediate axon Schwann cell interactions along the internode and are essential for myelination. J Cell Biol. 2007;178:861–874. doi: 10.1083/jcb.200705132. [DOI] [PMC free article] [PubMed] [Google Scholar]
- Michailov GV, Sereda MW, Brinkmann BG, Fischer TM, Haug B, Birchmeier C, Role L, Lai C, Schwab MH, Nave KA. Axonal neuregulin-1 regulates myelin sheath thickness. Science. 2004;304:700–703. doi: 10.1126/science.1095862. [DOI] [PubMed] [Google Scholar]
- Murphy P, Topilko P, Schneider-Maunoury S, Seitanidou T, Baron-Van Evercooren A, Charnay P. The regulation of Krox-20 expression reveals important steps in the control of peripheral glial cell development. Development. 1996;122:2847–2857. doi: 10.1242/dev.122.9.2847. [DOI] [PubMed] [Google Scholar]
- Ozkaynak E, Abello G, Jaegle M, van Berge L, Hamer D, Kegel L, Driegen S, Sagane K, Bermingham JR, Jr., Meijer D. Adam22 is a major neuronal receptor for Lgi4-mediated Schwann cell signaling. J Neurosci. 2010;30:3857–3864. doi: 10.1523/JNEUROSCI.6287-09.2010. [DOI] [PMC free article] [PubMed] [Google Scholar]
- Parkinson DB, Bhaskaran A, Arthur-Farraj P, Noon LA, Woodhoo A, Lloyd AC, Feltri ML, Wrabetz L, Behrens A, Mirsky R, Jessen KR. c-Jun is a negative regulator of myelination. J Cell Biol. 2008;181:625–637. doi: 10.1083/jcb.200803013. [DOI] [PMC free article] [PubMed] [Google Scholar]
- Pyagay P, Heroult M, Wang Q, Lehnert W, Belden J, Liaw L, Friesel RE, Lindner V. Collagen triple helix repeat containing 1, a novel secreted protein in injured and diseased arteries, inhibits collagen expression and promotes cell migration. Circ Res. 2005;96:261–268. doi: 10.1161/01.RES.0000154262.07264.12. [DOI] [PubMed] [Google Scholar]
- Robaglia-Schlupp A, Pizant J, Norreel JC, Passage E, Saberan-Djoneidi D, Ansaldi JL, Vinay L, Figarella-Branger D, Levy N, Clarac F, Cau P, Pellissier JF, Fontes M. PMP22 overexpression causes dysmyelination in mice. Brain. 2002;125:2213–2221. doi: 10.1093/brain/awf230. [DOI] [PubMed] [Google Scholar]
- Rothblum K, Stahl RC, Carey DJ. Constitutive release of alpha4 type V collagen N-terminal domain by Schwann cells and binding to cell surface and extracellular matrix heparan sulfate proteoglycans. J Biol Chem. 2004;279:51282–51288. doi: 10.1074/jbc.M408837200. [DOI] [PubMed] [Google Scholar]
- Spiegel I, Adamsky K, Eshed Y, Milo R, Sabanay H, Sarig-Nadir O, Horresh I, Scherer SS, Rasband MN, Peles E. A central role for Necl4 (SynCAM4) in Schwann cell-axon interaction and myelination. Nat Neurosci. 2007;10:861–869. doi: 10.1038/nn1915. [DOI] [PMC free article] [PubMed] [Google Scholar]
- Svaren J, Meijer D. The molecular machinery of myelin gene transcription in Schwann cells. Glia. 2008;56:1541–1551. doi: 10.1002/glia.20767. [DOI] [PMC free article] [PubMed] [Google Scholar]
- Tang L, Dai DL, Su M, Martinka M, Li G, Zhou Y. Aberrant expression of collagen triple helix repeat containing 1 in human solid cancers. Clin Cancer Res. 2006;12:3716–3722. doi: 10.1158/1078-0432.CCR-06-0030. [DOI] [PubMed] [Google Scholar]
- Topilko P, Schneider-Maunoury S, Levi G, Baron-Van Evercooren A, Chennoufi AB, Seitanidou T, Babinet C, Charnay P. Krox-20 controls myelination in the peripheral nervous system. Nature. 1994;371:796–799. doi: 10.1038/371796a0. [DOI] [PubMed] [Google Scholar]
- Vitale P, Braghetta P, Volpin D, Bonaldo P, Bressan GM. Mechanisms of transcriptional activation of the col6a1 gene during Schwann cell differentiation. Mech Dev. 2001;102:145–156. doi: 10.1016/s0925-4773(01)00303-3. [DOI] [PubMed] [Google Scholar]
- Voiculescu O, Charnay P, Schneider-Maunoury S. Expression pattern of a Krox-20/Cre knock-in allele in the developing hindbrain, bones, and peripheral nervous system. Genesis. 2000;26:123–126. doi: 10.1002/(sici)1526-968x(200002)26:2<123::aid-gene7>3.0.co;2-o. [DOI] [PubMed] [Google Scholar]
- Woodhoo A, Alonso MB, Droggiti A, Turmaine M, D'Antonio M, Parkinson DB, Wilton DK, Al-Shawi R, Simons P, Shen J, Guillemot F, Radtke F, Meijer D, Feltri ML, Wrabetz L, Mirsky R, Jessen KR. Notch controls embryonic Schwann cell differentiation, postnatal myelination and adult plasticity. Nat Neurosci. 2009;12:839–847. doi: 10.1038/nn.2323. [DOI] [PMC free article] [PubMed] [Google Scholar]
- Wrabetz L, Feltri ML, Quattrini A, Imperiale D, Previtali S, D'Antonio M, Martini R, Yin X, Trapp BD, Zhou L, Chiu SY, Messing A. P(0) glycoprotein overexpression causes congenital hypomyelination of peripheral nerves. J Cell Biol. 2000;148:1021–1034. doi: 10.1083/jcb.148.5.1021. [DOI] [PMC free article] [PubMed] [Google Scholar]


