

Abstract
A previous genetic analysis comparing the Dahl salt-sensitive (S) rat to the spontaneously hypertensive rat (SHR) identified a major locus on chromosome 2 that influences proteinuria in the S rat. In the present study, blood pressure, proteinuria, and renal hemodynamics were evaluated in congenic strains with small segments of the protective SHR genome on the S background. Proteinuria and renal function were significantly improved in the congenic strains compared to the S. The causative locus interval was narrowed to <375 kb based on congenic strains, haplotype data, comparative mapping, and concordance with human genetic studies. Sequencing of the coding region of genes in this region identified 36 SNPs (13 nonsynonymous and 23 synonymous). Gene expression profiling indicated that only few genes exhibited differential expression. Arhgef11, Pear1, and Sh2d2 were identified as important candidate genes that may be linked to kidney injury in the S rat. In particular, Arhgef11 plays an important role in the activation of the Rho-ROCK signaling pathway. Inhibition of this pathway using fasudil resulted in a significant reduction of proteinuria in treated S rats (compared to untreated S). However, no difference was observed between treated or untreated SHR or congenic strains. The homologous region in humans was found to be associated with estimated glomerular filtration rate (eGFR) in the Candidate Gene Association Resource (CARe) population. In summary, these findings demonstrate that allelic variants in Arhgef11, acting through the Rho-ROCK pathway, could influence kidney injury in the S as well as provide insight into human kidney disease.
Keywords: renal hemodynamics, fibrosis, Dahl salt-sensitive rats, genetic association studies
INTRODUCTION
Chronic kidney disease (CKD) affects ~10% of adults in the United States1. Those with CKD initially demonstrate some sign of kidney injury (usually defined by proteinuria) and as kidney injury worsens there can be a significant decline in kidney function that results in increased risk for renal failure as well as cardiovascular disease. Extensive evidence supports the premise of genetic susceptibility for kidney disease.2 The strong impact of genetics on kidney disease is highlighted by the significant disparity in the prevalence kidney disease in African Americans (~4 fold increase) with hypertension or diabetes compared to Caucasians3. A number of large-scale genome wide association analysis (GWAS) have identified single nucleotide polymorphism (SNP) associated with kidney injury, but for the most part these studies only account for a very small change in renal injury or a decline in renal function (as reviewed 4). Therefore, there is a critical need to identify new genes and signaling pathways that might be involved in susceptibility and progression of kidney injury.
The Dahl salt-sensitive (S) rat is a commonly used genetic model to study salt-sensitive hypertension. Moreover, the S rat develops significant kidney injury, including glomerulosclerosis, tubulointerstitial fibrosis, and vascular hypertrophy5. Kidney injury in the S rat becomes more severe as blood pressure is increased when challenged with a high-salt diet6, 7 similar to human patients that exhibit hypertensive nephrosclerosis 8. In contrast, the spontaneously hypertensive rat (SHR) is resistant to hypertension associated kidney injury. Using a segregating population derived from the S and SHR, we previously demonstrated that there were 9 genomic regions associated with kidney injury in the S rat7, 9. Some genomic intervals were associated with both increased blood pressure as well as kidney injury, while other regions appeared to influence kidney injury independent of blood pressure changes. In particular, the locus on rat chromosome 2 demonstrated strong linkage (LOD >12) and accounted for a large amount of variation in proteinuria. Recombinant progeny testing (RPT) narrowed the region of interest on chromosome 2 to ~6Mb. The homologous region on human chromosome 1 has been also associated with various types of kidney disease10, 11. However, the sequence variants, genes, and/or signaling pathways linked to this locus remain to be determined in the rat or humans.
The present study utilized RPT, congenic strains, haplotype analysis, sequencing, and gene expression to establish a small number of genetic variants associated with increased susceptibility of the S rat to develop kidney injury and associated decline in kidney function. The first aim was to characterize the blood pressure and renal parameters associated with the gene or genetic variants within the quantitative trait locus (QTL) for proteinuria on chromosome 2. Thus, temporal changes in blood pressure, proteinuria, and renal hemodynamics were evaluated by comparing S rats to two congenic strains carrying small SHR chromosome 2 segments. The second aim sought to identify sequence variants and gene expression differences in genes located in the newly identified small genomic segment. Finally, to validate the importance of the genetic locus, the candidate region was evaluated using a large-scale human population of CKD patients.
MATERIAL AND METHODS
The detailed methods are described in an expanded material and methods section in online supplemental data.
Animals and Study Design
All experiments were approved by the Institutional Animal Care and Use Committee at either the Medical College of Wisconsin (MCW) or the University of Mississippi Medical Center (UMMC). The Dahl salt-sensitive (S) and the spontaneously hypertensive rat (SHR) inbred strains are maintained at our institutional animal facility.
Study 1: Fine-Mapping using Recombinant Progeny Testing (RPT) and Congenic Strains
Recombinant Progeny Testing (RPT) was used to fine-map the proteinuria locus as done previously12. Proteinuria was determined at week 8 in six recombinant families (X39, n=67; X40, n=38; X41, n=37; X42, n=37; X43, n=21; X44, n=23) (Table S1). The congenic strains, S.SHR(2) X39 and X47 were developed from the recombinant families by fixing the transferred genomic interval in the homozygous SHR/SHR state (Fig. 1). These congenic strains were utilized for Studies 2-6.
Figure 1.
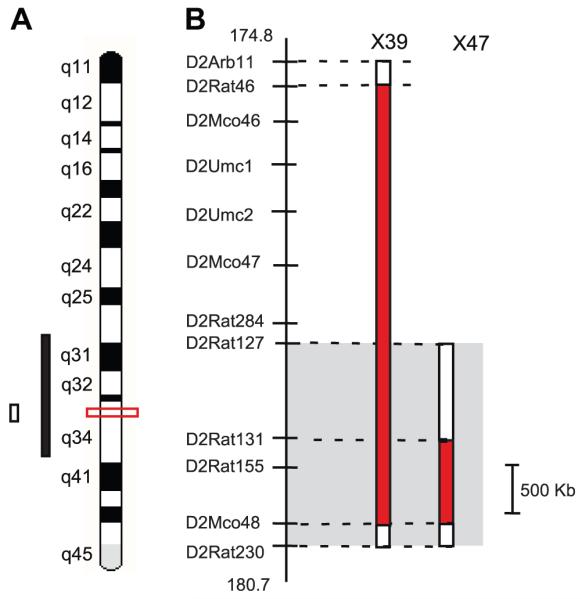
High-resolution localization of genomic region linked to kidney injury on rat chromosome 2. (A) Ideogram showing the 95% confidence interval (CI) for the quantitative trait loci (QTL) from original linkage analysis (solid black bar)9, 95% CI from second larger population, n=993 (open bar)12 and current refinement of kidney injury locus to a <2 Mb based on substitution analysis (red box). (B) Enlargement of the genomic region and two small congenic strains important in delimiting the genomic region. The grey box denotes the location of QTL based on RPT (Fig. S2) and X47 strain. The red solid bars to the right of the physical map with relevant microsatellite markers indicate the extent of the SHR-donor regions on the S background.
Study 2: Proteinuria, Blood Pressure and Renal Hemodynamic Parameters
At 4 weeks of age, groups of age matched male S, S.SHR(2)X39, and SHR animals (n=6-8 per group) were weaned onto a low-salt diet (0.3% NaCl; TD7034; Harlan Teklad, Madison, WI). At week 12, mean arterial pressure (MAP), renal blood flow (RBF) and glomerular filtration rate (GFR) were measured.
Study 3: Time Course Measurement of Proteinuria and Telemetry Blood Pressure
At 4 weeks of age, groups of age matched male S and S.SHR(2) X47 rats (n=16 per group) were weaned to a low-salt diet (0.3% NaCl). Proteinuria and blood pressure were measured from week 8 to 20 at 4 week intervals. Blood pressure was measured using a telemetry system (Data Sciences International, St. Paul, MN) in S (n=8) and S.SHR(2)X47 (n=10) animals as done previously13.
Study 4: Glomerular Permeability and Number
The reflection coefficient of albumin (σalb) was determined in isolated glomeruli from S and S.SHR(2)X39 raised on a low-salt diet (week 12) using modifications of the Savin technique14. These experiments were performed using 4-5 rats per strain with a minimum of 20 glomeruli per rat (n=80-100 total glomeruli per group). The determination of glomeruli number was performed using direct maceration/counting method15 using kidneys isolated at two time points (week 6 and week 12).
Study 5: Renal Function and Survival Curve
At 4 weeks of age, groups of age matched male S and S.SHR(2)X39 animals (n=9 per group) were weaned to a normal rodent chow (0.7% NaCl; Purina 5010) to exacerbate hypertension and progression of injury compared to a low-salt diet. Proteinuria and creatinine clearance (CrCl) was determined at week 12. MAP, GFR, and RBF autoregulation was evaluated in a separate group of animals (n=7-8 per group). A survival study was performed on S, S.SHR(2)X39, and SHR rats (n=12 rats per group).
Study 6: Pharmacological Inhibition of Rho-ROCK Pathway
Groups of age matched male S, S.SHR(2)X39, and SHR animals (n=11 per group) were weaned onto low-salt diet (0.3% NaCl) at week 4. At week 8, animals for each strain were randomly assigned to either control (n=5 per strain) or fasudil treatment (n=6 per strain). Fasudil (LC Laboratories, MA) was provided in drinking water to achieve a low dose of ~20 mg/kg/day. Proteinuria was determined at week 8, 10, and 12 after 24-hour urine collection.
Histological Assessment
Kidney tissue was fixed in zinc formalin and embedded in paraffin, cut into 4-μm sections and stained with hematoxylin and eosin (H&E) and/or Masson’s Trichrome. Glomerular injury and tubulointerstitial injury were assessed as previously described5, 16, 17. Immunohistochemistry was performed as previously described5.
Molecular Methods
Genotyping and Sequencing
Genomic DNA was used to genotype congenic strains or sequencing and prepared using Wizard SV 96 Genomic DNA kit. Genotyping was done using a fluorescent-based approach on a Beckman Coulter CEQ8000 XL capillary sequencer as described previously12. For sequencing of coding regions of candidate genes, primers were designed from known databases (Table S2).
Real-Time PCR and Multiplex Gene Expression
RNA was extracted using Trizol® reagent (Invitrogen, Carlsbad, CA) and purified using Mini RNeasy kit (Qiagen,Valencia, CA ). cDNA was obtained by reverse transcription using the SuperScript III First-Strand Synthesis System for RT-PCR (Invitrogen, Carlsbad, CA). Gene expression was evaluated using SYBR-green dye chemistry on a Stratagene MX3000p Real-Time PCR machine, Bio-Rad CFX96, and Beckman Coulter GeXP platform (minimum n=6 each strain).
Western blot analysis
Tissue homogenates were prepared in RIPA lysis buffer (Santa Cruz Biotechnology) from kidney cortex isolated from S and S.SHR(2)X39 under Study 2. Blots were prepared using standard methods and probed with Rho-ROCK pathway proteins (Arhgef11, RhoA, Rock1, Limk1, and Cofilin) and appropriate secondary antibody and imaged using a Pierce ECL Substrate on ChemiDoc XRS+ System (Bio-Rad).
Population studies: Candidate Gene Association Resource (CARe) Consortium
The Candidate Gene Association Resource (CARe) population was used to evaluate 22 SNPs in the homologous region to the kidney injury locus identified in the present study. The CARe consortium evaluated the association of renal function measures in approximately 23,000 individuals of European descent18 using the IBC SNP array, a 50K SNP genotyping array of candidate genes and pathways related to cardiovascular, inflammatory and metabolic phenotypes19.
Statistical Analysis
Statistical analysis was performed using SPSS (Chicago, IL) for described animal studies. RPT data was evaluated using an independent t-test using SPSS (Chicago, IL). Congenic strain phenotype data (e.g., proteinuria, blood pressure, etc.) were evaluated by t-test and/or by one-analysis of variance followed by Bonforni correction for multiple comparisons. A p<0.05 was considered to be statistically significant. All data are presented as mean ± standard error (SE). Survival was evaluated by the Kaplan-Meier method (Graphpad Prism 5, La Jolla, CA). A detailed description of the statistical approach for the CARe study is provided in expanded material and methods section.
RESULTS
Fine-Mapping and Renal Hemodynamics
An overview of the approach used to fine-map and identify the genetic variants linked to the proteinuria locus (kidney injury) on chromosome 2 is shown in Figure S1. Recombinant progeny testing (RPT) was previously utilized to localize the chromosome 2 genetic locus to a ~6Mb genomic interval (D2Arb11-D2Rat230). In the present study, RPT using additional recombinant families further refined the genetic locus (in the S rat) to ~2.5 Mb (Fig. S2; Table S1). Important recombinant animals were used to generate two small congenic strains [S.SHR(2)X39 and X47] to characterize the influence of blood pressure, proteinuria, and renal hemodynamic parameters associated with the kidney injury locus (Fig. 1). At 12 weeks of age on low-salt diet (0.3% NaCl) blood pressure was similar between strains. However, the S.SHR(2)X39 congenic demonstrated a ~2-fold reduction in proteinuria and significantly higher GFR compared to S rat (Fig. 2A). The S.SHR(2)X47 strain exhibited significantly reduced proteinuria from week 8-20 and less kidney hypertrophy (Fig. S3). At week 20, proteinuria was 109±12.2 mg/24hr compared to the 161±11.8 in the S. Similar to SHR(2)X39, no significant difference in BP was detected in the S.SHR(2)X47 compared to control S over the same period.
Figure 2.

Blood pressure, proteinuria, and renal hemodynamic parameters between S, S.SHR(2)X39, and SHR. (A) Mean arterial pressure (MAP), proteinuria and glomerular filtration rate (GFR) at week 12 for animals (n=6-8 per group) raised on low-salt. (B) Proteinuria and creatinine clearance (CrCl) for animals raised on Purina 5010 (0.7% NaCl) diet (n=9 per group). (C) Kaplan-Meier survival curve. For panels B and C, animals were raised on low-salt (0.3% NaCl) until 6 weeks of age and then placed on Purina 5010 (0.7% NaCl) diet for duration of experiment to accelerate injury. *, p<0.05 vs. S and/or SHR. #, p<0.05 vs. S or S.SHR(2)X39.
Proteinuria, renal hemodynamics, and survival was evaluated between the S and S.SHR(2)X39 on a normal rodent diet (0.7% NaCl) (Fig. 2B, Fig. S4). The diet exacerbated hypertension and accelerated the severity of proteinuria in both strains compared to a low-salt-diet. However, the S.SHR(2)X39 congenic still exhibited a significant reduction in proteinuria and improved kidney function (creatinine clearance) compared to S (Fig. 2B). Renal blood flow (RBF) remained relatively constant when renal perfusion pressure (RPP) varied from 100 to 140 mmHg (Fig. S4). Basal RBF was significantly higher in the congenic (4.4±0.33 ml/min/g kidney weight; p<0.05) compared to S (3.0±0.27); however, autoregulation of RBF was similar in the S and S.SHR(2)X39 strain (Fig. S4). Renal vascular resistance was significantly decreased in the congenic (37±3.4 mm Hg/mL/min; p<0.05) compared to S (53±4.2). The median survival for S.SHR(2)X39 rats was 345 days compared with median survival of S rats (176 days, p<0.001), whereas no SHR died during the course of the experiment (Fig. 2C).
Glomerular Morphology and Renal Pathology
Representative histology is shown for S and S.SHR(2)X39 congenic in Figure 3. Glomerular injury (mesangial expansion, glomerulosclerosis, etc) was significantly attenuated in the S.SHR(2)X39 strain compared to S as was glomerular area, whereas increased glomerular hypertrophy was observed in S rats (Fig. 3B). Increased glomerular area was significantly correlated with increased proteinuria (r=0.72, p<0.001). Nephron number was observed to be significantly increased in the congenic strain. Despite a significant difference in proteinuria between strains, glomerular permeability to FITC-albumin was similar (Fig. S4). The extent of tubular injury and degree of interstitial fibrosis (tubule atrophy, immune cell infiltration, and/or fibrosis) was significantly reduced in the S.SHR(2)X39 (Fig. 3) and S.SHR(2)X47 (Fig. S3) compared to the S. No difference in medial thickness of the renal arterioles between strains (Fig. 3C-D) was observed. The degree of interstitial injury was confirmed by decreased α-SMA expression and macrophage infiltration observed in the S.SHR(2)X39 (Fig. 3E-F) and S.SHR(2)X47 (Fig. S3) compared to the S.
Figure 3.

Assessment of renal injury between S and S.SHR(2)X39 at week 12 raised on Purina 5010 (0.7% NaCl). (A) Representative light microscopy image from each strain, including whole kidney section, glomerulus, tubulointerstitial region, and renal vessel. (B) Semi-quantitative and morphometric analysis of individual glomeruli assessed for degree of glomerulosclerosis and mesangial expansion [scale from 0 (normal) to 4 (global sclerosis]) and glomerular area was determined. (C) Morphometric analysis of tubular injury and interstitial fibrosis. (D) Measurement of vessel wall thickening. Vessel wall thinking (vessel media, um2) was calculated by measuring the outer circumference of the vessel minus the inner circumference of the lumen (20 random images per animal, n=9 animals per group). (E-F) Representative immunohistochemical images of α-smooth muscle actin (SMA) and CD-68 (ED-1; macrophage). n=8 per group. *, p<0.05
Haplotype Analysis and Overlap with Human Kidney Disease
Haplotype analysis was performed using a panel of inbred strains known to exhibit high or low proteinuria (Table S3). There was a strong concordance between the groups (high or low) and the allelic variant (C or T) at ENSRNOSNP2786652. The S, MWF, BUF, and MNS (susceptible to proteinuria) all possess the C allele, whereas the SHR, WHY, ACI, F344, LOU, and MHS (resistant to proteinuria) possess the T allele. The location of SNP is consistent with the region identified using substitution analysis (Fig. 4). However, the SNPs above and below ENSRNOSNP2786652 did not exhibit this pattern (Table S3).
Figure 4.

Summary of refinement of genomic locus using substitution analysis, comparative mapping, haplotype analysis, and identification of key genes. The gray box (left panel) denotes the location of the QTL based on RPT (Fig. S2) and smallest congenic strain, S.SHR(2)X47 (Fig. 1). The region in humans that is homologous to the rat QTL lies on both human chromosome 1 and 4 (middle panel). The break point (between 178.523 and 179.114 Mb) occurs around the middle of the rat QTL and provides a means to further refine the genomic interval. Human chromosome 1 has been linked to kidney disease, (1) Adult onset nephropathy and hypertension 10; (2) MCDK1, medullary cystic kidney disease 46-48; and (3) creatinine clearance (HyperGen study) 11, whereas no human linkage or GWAS studies have been associated with kidney disease on chromosome 4. The panel on the right shows important SNP used for haplotype analysis (Table S3). The SNP shown in red demonstrated an association between high or low proteinuria strains, whereas those SNP in blue did not. The underlined genes (Arhgef11, Pear1, and Sh2d2) were identified as high priority using gene priority decision-tree (Fig. S6) and exhibit sequence variants that altered amino acid(s), exhibited differential expression, and linked to a possible biological role in the kidney. The remaining genes on the left of the physical map either exhibit sequence variants, or differential expression. The genes on the right of the physical map exhibited no coding sequence variants or differential expression. The star denotes the SNP (rs7534418) associated with eGFR in the CARe study described in this study (Fig. 7).
The region in humans that is homologous to the rat QTL lies on both human chromosome 1 and 4 (Fig. 4). The break point occurs around the middle of the rat QTL and provides additional confirmation and refinement of the genomic interval by comparative mapping as only the homologous region on 1q21 is linked to several forms of kidney disease (Fig. 4).
Sequencing, Expression, and Prioritization of Candidate Genes
The coding regions of genes that map into the congenic interval were sequenced from S and SHR. A complete list of genes is shown in Table S4. Only genes that exhibited sequence differences are shown in Table 1. A total of 13 nonsynonymous (amino acid change) and 23 synonymous variants were identified in 16 genes. However, only 9 genes exhibited sequence differences in the refined genomic interval considering substitution analysis, haplotype, and comparative mapping data (summarized in Fig. 4). More than half of the sequence variants (15/26) were found within three genes, Arhgef11, Pear1, and Iqgap3. Arhgef11 contained the most nonsynonymous variants (n=3), followed by Iqgap3 (n=2) and Pear1 (n=1).
Table 1.
Summary of Coding Sequence Variants in Refined Genomic Region Associated withKidney Injury
| Ensembl Transcript ID | Gene ID | Start(bp) | End(bp) | Position | BN(Ref) | S | SHR | Type | AminoAcid |
|---|---|---|---|---|---|---|---|---|---|
| ENSRNOSNP2786648 | 179645084 | ||||||||
| ENSRNOT00000049112 | Arhgef11 | 179676236 | 179796785 | 179744835 | GCC | GCC | ACC | nonsynonymous | ala/thr |
| 179774065 | GAC | GAC | AAC | nonsynonymous | asp/asn | ||||
| 179788780 | ACC | ACT | ACC | synonymous | thr | ||||
| 179791299 | AAA | AAA | AGA | nonsynonymous | lys/arg | ||||
| 179792553 | GCA | GCA | ACA | nonsynonymous | ala/thr | ||||
| ENSRNOT00000020147 | Lrcc | 179798050 | 179808855 | 179806328 | GCT | GCT | GCC | synonymous | ala |
| 179800777 | GCG | GCG | GCA | synonymous | ala | ||||
| 179802405 | ACG | ACG | ATG | synonymous | thr | ||||
| ENSRNOT00000019502 | Pear1 | 179810529 | 179820653 | 179819959 | GCC | GCT | GCC | synonymous | ala |
| 179817163 | GGC | GGC | GGT | synonymous | gly | ||||
| 179816423 | AGT | AGT | AGC | synonymous | ser | ||||
| 179812075 | CTT | CTT | CCT | nonsynonymous | leu/pro | ||||
| 179810631 | CCC | CCG | CCC | synonymous | pro | ||||
| ENSRNOSNP2786652 | 179892073 | ||||||||
| ENSRNOT00000017798 | Sh2d2a | 179916108 | 179924625 | 179923584 | CAG | CAG | CAT | nonsynonymous | gln/his |
| ENSRNOT00000035271 | Mrpl24 | 179995713 | 180001750 | 180000830 | ACT | ACT | ACG | synonymous | thr |
| ENSRNOT00000025314 | Nes | 180052034 | 180060546 | 180057831 | CAG | CAA | CAG | synonymous | gln |
| 180058176 | GAA | GAA | GAG | synonymous | glu | ||||
| ENSRNOT00000025496 | Bcan | 180067864 | 180080942 | 180073710 | GAT | GAT | AAT | nonsynonymous | asp/asn |
| ENSRNOT00000050476 | Ttc24 | 180138942 | 180144393 | 180143444 | CGT | CGT | TGT | nonsynonymous | arg/cys |
| 180141671 | GCG | GCG | TCG | nonsynonymous | ala/ser | ||||
| 180138974 | TCC | TCC | CCC | nonsynonymous | ser/pro | ||||
| ENSRNOT00000040822 | Iqgap3 | 180156261 | 180198814 | 180166501 | TGC | TGT | TGC | synonymous | cys |
| 180178988 | CGT | CAT | CGT | nonsynonymous | arg/his | ||||
| 180179073 | AAT | AAT | AAC | synonymous | asn | ||||
| 180187672 | CCC | CCC | CCT | synonymous | pro | ||||
| 180189860 | ATT | ATT | ATG | nonsynonymous | Ile/met | ||||
| ENSRNOSNP2786655 | 180264633 | ||||||||
| ENSRNOT00000026396 | Rhbg | 180320785 | 180333050 | 180323710 | AGC | AGC | AGT | synonymous | ser |
| 180321328 | CCC | CCT | CCC | synonymous | pro | ||||
| 180325286 | ATC | ATA | ATC | synonymous | ile | ||||
| ENSRNOT00000026153 | Kpp | 180438070 | 180441660 | 180439470 | GCC | GCT | GCC | synonymous | ala |
| 180441222 | CTC | CTC | CTT | synonymous | leu | ||||
| ENSRNOT00000026514 | Smg5 | 180448929 | 180474674 | 180464043 | GCC | GCT | GCC | synonymous | ala |
| ENSRNOT00000036143 | Paq6 | 180478768 | 180481707 | 180481614 | GCC | GCC | GCA | synonymous | ala |
| ENSRNOT00000026530 | Bglap2 | 180482313 | 180483290 | 180482514 | GAC | GAC | GAT | synonymous | asp |
| ENSRNOT00000034816 | Slc25a44 | 180514428 | 180526461 | 180517963 | CTC | CTT | CTC | synonymous | leu |
| 180522533 | CGG | CAG | CGG | nonsynonymous | arg/gln | ||||
| ENSRNOT00000026733 | Sema4a | 180552405 | 180573625 | 180553168 | CCT | CTT | CCT | nonsynonymous | pro/leu |
The italicized Ensembl transcript ID designates those genes residing in the refined genomic region based on congenic strain, haplotype analysis, and comparative mapping.SNP (ENSRNOSNP) important for haplotype analysis (Table S3) are also shown. Brown Norway (BN) is the rat genome reference sequence. S is SS/jr and SHR is SHR/Hsd. Sequence variants different from the reference are underlined and nucleotide in italics is the SNP. Each SNP was confirmed on at least 2 independent samples from each strain. Table S4 provides a summary of all genes in the genomic interval. The genes in bold in Table S4 were sequenced between S and SHR and only those exhibiting a sequence difference are shown inthis table.
The expression of genes in the kidney was evaluated using a multiplex approach (Fig. S5). Five genes (Arhgef11, Pear1, Sh2d2, Gpatch4, and Lrcc) were found to be differentially expressed (Table S5). A subset of genes located in the refined interval were confirmed using real-time PCR at an early (week 4) and late (week12) time point under low-salt diet (0.3% NaCl) (Fig. 5A). Arhgef11, Pear1, Sh2d2, and Nes were confirmed to be differentially expressed between strains, similar to the multiplex approach. Gene expression was also evaluated on isolated kidney cortex and medulla from animals exposed to a moderate increase in salt (0.7% NaCl). Arhgef11, Pear1, Sh2d2a, Nes, and Gpatch4 were again found to be differentially expressed, but predominantly in kidney cortex (Fig. 5B). The S transcript for each gene was expressed at a higher level as compared to the congenic irrespective of diet, except for Nes or Gpatch4.
Figure 5.

Quantitative real-time PCR of candidate genes. (A) Gene expression at week 4 and week12 under low-salt (0.3% NaCl). (B) Gene expression evaluated on isolated kidney cortex and medulla from animals exposed to a moderate increase in salt (0.7% NaCl). *, p<0.01. Ratio >1, S transcript expressed at higher level than congenic; Ratio <1, congenic expressed at higher level than S transcript. ND=not detected, n=6 per group.
To establish gene(s) that may have the greatest likelihood for involvement in influencing kidney injury, genes were evaluated based on three criteria, including nature and type of sequence variation, differential expression, and/or possible biological role (Fig. S6). In short, genes designated as high priority are those that exhibited coding sequence variants that alter amino acids, differential expression, and evidence that the gene could have biological role in the kidney. Arhgef11, Pear1, and Sh2d2 were identified as important candidate genes linked to kidney injury using this methodology (Fig. 4).
Western Blot Analysis of ARHGEF11, Rho-ROCK Pathway, and Inhibition by Fasudil
The potential role of Arhgef11 in the Rho-ROCK pathway was evaluated by western blot analysis as this pathway is known to influence cardiovascular disease (Fig. 6A-B). Protein levels of ARHGEF11 were 1.6 fold higher in the S compared to the S.SHR(2)X39 congenic, consistent with detected gene expression differences (Fig. 5). RhoA, which is activated through exchange of GDP for GTP by ARHGEF11, was also increased in the S (1.5 fold) as were other downstream proteins (ROCK1, LIMK1, p-Cofilin). Protein levels of ROCK1 demonstrated the greatest change (4.7 higher in the S).
Figure 6.

Western blot of Rho-ROCK pathway and pharmacological inhibition of the using fasudil. (A) Western blot analysis of the Rho-ROCK pathway between the S and S.SHR(2)X39 on Purina (0.7% NaCl) at week 12 (same samples as Fig. 3). Protein levels of ARHGEF11 and key proteins in the Rho-ROCK signaling pathway (n=6 per group). A representative image of GAPDH is shown to demonstrate similar protein loading. (B) Densitometry measurement of each protein normalized to GAPDH. GAPDH was probed along with each protein (i.e. each protein was normalized to GAPDH probed on same blot as protein). (C) Treatment of S, S.SHR(2)X39, and SHR with Rock inhibitor fasudil. At week 8, animals for each strain were randomly assigned to either control (n=5 per strain) or fasudil treatment (n=6 per strain). Fasudil was provided in drinking water to achieve a low dose of ~20 mg/kg/day. * p<0.05 S verse other groups; #, p<0.05 S versus S treated with fasudil.
The influence of the Rho-ROCK pathway on proteinuria was examined in the S, S.SHR(2)X39, and SHR using the ROCK inhibitor fasudil (Fig. 6C). S rats treated with fasudil demonstrated a significant reduction in proteinuria compared to untreated S rats at week 10 and 12 (2 or 4 weeks treatment). Proteinuria at week 12 for S treated was similar to S.SHR(2)X39. No difference in proteinuria was detected between treated and untreated groups for either the S.SHR(2)X39 congenic or SHR.
Correlation of the Region with Human GWAS
eGFR (estimated glomerular filtration rate) data was available for 23,247 individuals of European descent from the Candidate Gene Association Resource (CARe) Consortium. Among the 22 SNP examined in the region homologous to the rat locus, a significant association with eGFR was observed for rs7534418 (p= 0.001315, MAF= 0.3269, beta= 0.0069 for each copy of the T allele) after Bonferroni correction (Fig. 7). Additional nominal associations (P<0.05) for several other SNPs (rs4661229, p=0.004; rs2768744, p=0.004) were also observed. For UACR (urine albumin:creatinine ratio), (N=19,214), no associations in the region were observed (Fig. S7).
Figure 7.

Regional plot for the homologous candidate region associated with eGFR in humans (23,247 individuals). X-axis shows the genomic region and genes, and the y-axis shows the -log10 p values for associations. The panel also shows the recombination rate in the region estimated from HapMap CEU data and pairwise linkage disequilibrium (r2) between SNPs in the region and the lowest p-value SNP (labeled in purple) estimated from the meta-analyses. The r2 values are color coded according to the scale on each panel.
DISCUSSION
We previously reported that a region on rat chromosome 2 was associated with proteinuria, histological renal injury, but not blood pressure9. A congenic strain was developed [S.SHR(2)] to confirm the linkage analysis that demonstrated attenuated renal injury independent of changes in blood pressure compared to control S12. Subsequently, recombinant progeny testing (RPT) narrowed the genomic interval based on overlapping recombinant intervals12. In the present study, we utilized additional RPT to better define the genomic interval, developed two small congenic strains to characterize the cardiovascular and renal parameters associated with the genomic locus, as well as performed detailed genetic analysis (haplotype analysis, sequencing, and gene expression) to identify genetic variants that may be causative to the observed renal injury.
Both congenic strains demonstrated reduced kidney injury and improved kidney function compared to the control S. The decreased proteinuria and improved GFR was associated with reduced renal inflammation and interstitial fibrosis in the absence of measurable differences in BP between strains. Increased nephron number, along with elevated GFR in the S.SHR(2)X39 congenic, suggests that kidney development may play a role in the improved kidney function compared to the S, which exhibited significantly less nephrons. The connection between low nephron number and the risk of hypertension and kidney disease has been shown in humans and experimental animal models20. Glomerular permeability was similar between strains, despite the S.SHR(2)X39 congenic strain exhibiting a ~40% reduction in proteinuria compared to the S rat. This suggests that the detected difference in proteinuria is not likely due to the degree of filtered protein, but may likely reflect an increase in the reuptake of filtered protein in the proximal tubules. This finding is consistent with other genetic models of renal disease in which a large fraction of proteinuria is attributed to an impairment of protein reuptake via the proximal tubule without changes in glomerular permeability21.
Classification of the nature and type of sequence variation, differential expression, and potential biological role identified three genes (Arhgef11, Pear1, Sh2d2a) as important candidates for involvement in kidney injury. In general, allelic variants (promoter, coding, or intronic) in any of these genes could play important roles in influencing the onset or progression of kidney injury, either by altering gene expression, protein function, and/or alternative splicing. For example, Pear1 is a novel membrane protein involved in platelet contact -induced activation22. Platelet activation and endothelial dysfunction have been mostly linked to atherosclerotic disease23 and results in the secretion of several types of chemokines (MCP1, CCL5, CXCL4, etc.)24. The release of these chemokines triggers monocyte recruitment, differentiation into macrophages24, and perhaps immune-mediated renal injury. Sh2d2a is a T-cell specific adapter protein (or TSAd). Recent studies have indicated that it may function predominately in the nucleus where it acts to regulate the transcription of different T-cell target genes, including IL-225. TSAd-/- deficient mice are susceptible to lupus-like autoimmune disease (when challenged with pristine) and demonstrate glomerulonephritis and proteinuria at an advanced age26. This type of renal injury is likely secondary to autoimmune disease by immune complexes becoming deposited in kidney glomeruli.
The most convincing evidence exists for Arhgef11 being involved in kidney injury in the Dahl S. ARHGEF11 is Rho guanine nucleotide exchange factor that participates in the Rho-ROCK pathway. The Rho-ROCK pathway has been implicated in a variety of pathological conditions including cardiovascular disease and neurological disorders27, 28. The Rho family of small GTPases regulate a number of cell functions, including actin cytoskeletal organization, cell adhesion, cell motility, vascular smooth muscle contraction, and gene expression29. ARHGEF11 (PDZ-RhoGEF) binds activated α12/13 (G-protein) and demonstrates specificity for activating RhoA, but not other Rho family members, Rac1 and Cdc4230. ARHGEF11 catalyzes the exchange of GDP for GTP thereby activating RhoA31. The Rho effector protein, ROCK, is a serine-threonine kinase involved in both phosphorylation of myosin light chain (MLC) which can contribute to stress fiber formation and smooth muscle contraction. Arhgef11-deficient zebrafish embryos exhibit kidney cysts (along with other phenotypes) and the distribution of F-actin in the pronephric ducts is altered32. This work provides some evidence that Arhgef11 can affect kidney development and play a role in stress fiber formation.
The Rho-ROCK pathway is modestly up-regulated in the S [compared to S.SHR(2)X39], suggesting that chronic stimulation of the pathway may account for progressive kidney injury in the S. At this point, it is not clear if the pathway is up-regulated due to differential expression or protein function differences based on amino acid changes between the S and SHR. However, our data is consistent with other studies that support a role for Rho-ROCK with various aspects of renal disease, including alterations in afferent arteriolar tone (via VSMC)33, podocyte dysfunction34, and tubular EMT leading to fibrosis (TGF-β mediated)35, 36.
There are two ROCK inhibitors available, Y-27632 and fasudil, both of which have been extensively used to investigate the role of Rho kinase in cardiovascular disease37. Both compounds attenuate tubulointerstitial fibrosis in a mouse model of unilateral ureteral obstruction (UUO)38. Inhibition of ROCK (fasudil) has also been shown to attenuate the development of glomerulosclerosis in the Dahl salt-sensitive rat39. Improvement in glomerulosclerosis was not accompanied by changes in BP 39. Inhibition of the Rho-ROCK pathway using fasudil significantly lowered proteinuria in S treated vs. non-treated and no difference was observed between treated and non-treated congenic or SHR. This suggests that low-dose treatment with fasudil does not significantly affect the Rho-ROCK pathway in the congenic or SHR because these strains are able to correctly regulate the pathway. These findings demonstrate that allelic variants in Arhgef11, acting through the Rho-ROCK pathway, could modulate renal protection independent of changes in blood pressure (but function on a hypertensive susceptible genetic background).
The evaluation of the rat genomic locus using the human CKD CARe population supports our view that genetic variants/genes identified using rat models of renal disease may lead to a better understanding of genetic factors that contribute to kidney disease in humans. None of the candidate genes identified in the present study (Arhgef11, Pear1, Sh2d2a) have been associated with proteinuria or GFR in humans until now. Several human studies have found an association with genetic variants in these genes with other types of cardiovascular, metabolic, or inflammatory diseases. In this regard, SNPs in ARHGEF11 have been linked to diabetes40 and susceptibility to cerebrovascular disease (intracranial aneurysm)41. ROCK2 (a downstream target of ARHGEF11-RHOA) is associated with lower risk of hypertension in HYPGENE study42. Genetic variants in PEAR1 are associated with increased platelet response43 and genetic variants in the promoter region of SH2D2A (short allele in promoter region) are linked with susceptibility to multiple sclerosis44 and juvenile rheumatoid arthritis45, both chronic immune mediated diseases.
Supplementary Material
Table S1- Localization of Proteinuria QTL by Recombinant Progeny Test (RPT)
Table S2- Primers used to amply gene transcript for cloning- only those with coding sequence differences (Table 1)
Table S3- Haplotype analysis using panel of inbred with susceptibility or resistance to kidney injury
Table S4- Annotated genes the smallest congenic strain [S.SHR(2)X47], introgressed SHR segment from D2Rat127-D2Rat230
Table S5- GeXP Multiplex Gene Expression
Table S6- Real-Time PCR primers
Table S7- GeXP Multiplex Primers
Figure S1: Schematic diagram of the approach used to narrow gene/ genetic variants associated with kidney injury on rat chromosome 2. The predominant method was substitution analysis using recombinant progeny testing (RPT) and/or congenic strain analysis. The use of other methods, such as haplotype analysis, comparative mapping, and linkage or genome-wide association studies (GWAS) in humans was used to further refine the likely location of the QTL. Once the number of genes were narrowed to a manageable number (~20-30), sequencing, gene expression, and bioinformatics analysis was performed to identify strong candidate genes that can be further studied in vivo by genetic modification (e.g., gene knockout) or by pharmacological agents.
Figure S2: Fine-mapping of the chromosome 2 genomic interval associated with kidney injury in the Dahl S. (A) Ideogram showing the 95% confidence interval (CI) of proteinuria quantitative trait loci (QTL) from original linkage analysis (solid black bar)16. (B) Recombinant progeny testing (RPT) was employed to refine the genomic region containing the genetic variants linked to kidney injury. The basis of RPT is to identify recombinant animals (e.g. different donor SHR regions), to propagate these recombinant animals by backcross to S, then to measure the phenotypes of the progeny. The influence of each recombinant region (i.e. SHR genotype) was determined by subtracting average proteinuria of recombinant rats (SHR-like) from proteinuria of non-recombinant (S-like) littermates. Red bars denote that recombinant animals (SHR-like) had significantly (p < 0.05) lower proteinuria compared to non-recombinant (S-like) littermates. Yellow bars denote there was not a significant difference in proteinuria between recombinant and non-recombinant littermates. The proteinuria effect and number of animals tested from each recombinant family are shown in Table S1. Based on RPT, the QTL interval was narrowed to genomic region defined to D2Rat131-D2Rat230 (~2.75 Mb). The S.SHR(2)X39 recombinant family was used to generate a congenic strain that fixed the transferred genomic interval homozygous SHR/SHR (Fig. 1). The S.SHR(2)X47 was generated from a new recombination that occurred while developing the S.SHR(2)X39 strain. These fixed congenic strain were phenotyped for other measures of kidney injury and function (Studies 2-6).
Figure S3: Time course assessment of blood pressure, proteinuria, and kidney injury in S and S.SHR(2)X47 from week 8 to 20. (A) Systolic blood pressure measured by telemetry (n=10 per group). (B) Proteinuria and kidney weight (n= 12 per group). (C) Morphometric analysis of tubulointerstitial fibrosis, representative images of Masson’s Trichrome and immunohistochemical straining of CD-68 (ED-1; macrophage). The S.SHR(2)X47 congenic exhibited significantly less proteinuria, which is supported by the decreased tubulointerstitial injury (fibrosis and less macrophage infiltration). This data is constant with the larger congenic for which detailed phenotyping was performed.*, p<0.05.
Figure S4: Blood pressure, autoregulation of renal blood flow (RBF) and glomerular number and permeability between S and S.SHR(2)X39 on normal rodent diet (0.7% NaCl, Purina 5010). (A) Conscious mean arterial pressure (MAP). (B) RBF autoregulation (left y-axis) and autoregulatory index (right y-axis) and RVR (renal vascular resistance). Both groups effectively autoregulate RBF as renal profusion pressure is increased (AI ~ 0). (C) Proteinuria and glomerular permeability. Proteinuria was evaluated in groups of S and S.SHR(2)X39 animals before glomeruli were isolated for permeability assay. There is a distinct difference in proteinuria between groups, but no difference in the reflection coefficient of albumin. This suggests that the detected difference in proteinuria is not likely due to the degree of filtered protein. (D) Nephron/glomeruli number. Measurements were made at week 12 (n=8 per group), except for nephron number which was also evaluated week 6.*, p<0. 05.
Figure S5: Multiplex gene expression profiling between S and S.SHR(2)X39 normal rodent diet (0.7% NaCl, Purina 5010) at week 12. (A) Representative multiplex gene expression chromatograph of all the genes in the genomic region using Beckman Coulter (GeXP) platform. The benefit to this approach is the ability measure gene expression patterns of genes within the genomic locus simultaneously. (B) Scatter plot and regression of two independent multiplex studies which demonstrates high correlation (r=0.95, p<0.0001) between experiments. The average of two experiments (each sample run in triplicate) is presented in Table S5. (C) Scatter plot and regression of multiplex gene expression (GeXP) and follow-up using real-time PCR on a subset of genes (Fig. 5). The two methods are highly correlated (r=0.77, p<0.001).
Figure S6: Decision tree used to establish top candidate genes based on three classifications: (1) nature and type of sequence variants; (2) differential expression; and (3) potential biological significance. Depending on the path (no or yes), genes were classified as low priority (shown in red), medium priority (shown in yellow), or high priority (shown in green). A gene that exhibited “high priority” designation in each classification is considered an important gene for additional study. Thus, a gene that is denoted as high priority for every classification (1. sequence variants, 2. expression, and 3. biological significance) is assumed to have highest probability to play a functional role, more so than other genes in the genomic interval designated as low or medium priority.
Figure S7: Regional plot for the candidate region associated with UACR in individuals. X-axis shows the genomic region and genes and the y-axis shows the -log10 p-values for associations with UACR. The panel also shows the recombination rate in the region estimated from HapMap CEU data and pairwise linkage disequilibrium (r2) between SNPs in the region and rs7534418 (labeled in purple) estimated from the meta-analyses. The r2 values are color coded according to the scale on each panel.
PRESPECTIVES.
Linkage analysis usually only identifies a broad genomic region linked to a particular trait and subsequent fine-mapping is required to identify the causal genetic elements. Ultimately, it is necessary to conducted detailed physiological studies using a small congenic strain to explore the mechanism linked to the causative gene or genetic variants. Here, we provided detailed information on cardiovascular and renal hemodynamic parameters associated with genetic variants on rat chromosome 2 that strongly influences the development of kidney injury in the S rat. It is clear that functional significance of the identified candidate genes and sequence variants will require more detailed analysis, but convincing evidence exists that Arhgef11 may be linked to kidney injury in the Dahl S via the Rho-ROCK signaling pathway. In summary, this work provides an advance in identifying genetic variants/ genes that modulate the onset and progression of kidney disease in the setting of hypertension using the Dahl S rat and establishes relevance to human CKD using the CARe population.
NOVELTY AND SIGNIFICANCE.
1. What is New?
First report on the high-resolution localization of a genomic locus linked to hypertensive related kidney disease using the Dahl salt-sensitive (S) rat, a model of human CKD.
Few studies have performed, as we have, detailed physiological studies, histological analysis, comprehensive sequence and gene expression analysis to investigate mechanism linked to a fine-mapped genetic locus for kidney injury.
Identified a strong candidate gene (Arhgef11), not previously linked to the development of kidney injury in the rat and showed the locus around this gene was associated with eGFR in humans.
2. What is Relevant?
Our genetic studies utilize two models of hypertension (S and SHR) that differ with respect to kidney injury. The advantage of this comparison is the ability to identify loci that influence kidney injury on genetic backgrounds (either S or SHR) permissive for hypertension.
Hypertension is the second leading cause of renal failure in humans. Thus, identification of gene/genetic variants related to kidney injury in the context of hypertension could have a significant impact on human health by serving as novel therapeutic targets.
3. Summary
Our previous studies utilized the Dahl salt-sensitive (S) rat to identify broad genomic intervals linked with cardiovascular and kidney disease. We now have successfully narrowed the genomic segment and identified specific genetic variants and genes on chromosome 2 linked with injury and reduced renal function. Thus, this work provides a significant advance in identifying genetic variants that contribute to the development of kidney disease in the setting of hypertension and establishes relevance to human CKD using the CARe population.
ACKNOWLEDGEMENTS
The authors wish to thank Dr. John Rapp for his critical reading of the manuscript and many helpful suggestions.
SOURCES OF FUNDING M.R.G is supported by NIH/NHLBI HL094446 and Robert M. Hearin Foundation. R.J.R. is supported by NIH/NHLBI HL36279. N.F. is supported by 1R01HL089651-01, U01/1U01HG004803-01 and AHA 0675001N.
Footnotes
CONFLICT(S) OF INTEREST/DISCLOSURE(S) None
This is a PDF file of an unedited manuscript that has been accepted for publication. As a service to our customers we are providing this early version of the manuscript. The manuscript will undergo copyediting, typesetting, and review of the resulting proof before it is published in its final citable form. Please note that during the production process errors may be discovered which could affect the content, and all legal disclaimers that apply to the journal pertain.
REFERENCES
- 1.Coresh J, Selvin E, Stevens LA, Manzi J, Kusek JW, Eggers P, Van Lente F, Levey AS. Prevalence of chronic kidney disease in the united states. JAMA. 2007;298:2038–2047. doi: 10.1001/jama.298.17.2038. [DOI] [PubMed] [Google Scholar]
- 2.Friedman DJ, Pollak MR. Genetics of kidney failure and the evolving story of apol1. J Clin Invest. 2011;121:3367–3374. doi: 10.1172/JCI46263. [DOI] [PMC free article] [PubMed] [Google Scholar]
- 3.USRDS . Usrds 2011 annual data report: Atlas of chronic kidney disease and end-stage renal disease in the united states. National Institutes of Health, National Institute of Diabetes and Digestive and Kidney Diseases; Bethesda, MD: 2011. [Google Scholar]
- 4.Boger CA, Heid IM. Chronic kidney disease: Novel insights from genome-wide association studies. Kidney Blood Press Res. 2011;34:225–234. doi: 10.1159/000326901. [DOI] [PubMed] [Google Scholar]
- 5.Regner KR, Harmon AC, Williams JM, Stelloh C, Johnson A, Kyle PB, Lerch-Gaggl A, White SM, Garrett MR. Increased susceptibility to kidney injury by transfer of genomic segment from shr onto dahl s genetic background. Physiological Genomics. 2012;44(12):629–37. doi: 10.1152/physiolgenomics.00015.2012. [DOI] [PMC free article] [PubMed] [Google Scholar]
- 6.Dahly AJ, Hoagland KM, Flasch AK, Jha S, Ledbetter SR, Roman RJ. Antihypertensive effects of chronic anti-tgf-β antibody therapy in dahl s rats. American Journal of Physiology - Regulatory, Integrative and Comparative Physiology. 2002;283:R757–R767. doi: 10.1152/ajpregu.00098.2002. [DOI] [PubMed] [Google Scholar]
- 7.Garrett MR, Joe B, Yerga-Woolwine S. Genetic linkage of urinary albumin excretion in dahl salt-sensitive rats: Influence of dietary salt and confirmation using congenic strains. Physiol Genomics. 2006;25:39–49. doi: 10.1152/physiolgenomics.00150.2005. [DOI] [PubMed] [Google Scholar]
- 8.Freedman BI, Iskandar SS, Appel RG. The link between hypertension and nephrosclerosis. American Journal of Kidney Diseases. 1995;25:207–221. doi: 10.1016/0272-6386(95)90001-2. [DOI] [PubMed] [Google Scholar]
- 9.Garrett MR, Dene H, Rapp JP. Time-course genetic analysis of albuminuria in dahl salt-sensitive rats on low-salt diet. J Am Soc Nephrol. 2003;14:1175–1187. doi: 10.1097/01.asn.0000060572.13794.58. [DOI] [PubMed] [Google Scholar]
- 10.Cohn DH, Shohat T, Yahav M, Ilan T, Rechavi G, King L, Shohat M. A locus for an autosomal dominant form of progressive renal failure and hypertension at chromosome 1q21. Am J Hum Genet. 2000;67:647–651. doi: 10.1086/303051. [DOI] [PMC free article] [PubMed] [Google Scholar]
- 11.DeWan AT, Arnett DK, Atwood LD, Province MA, Lewis CE, Hunt SC, Eckfeldt J. A genome scan for renal function among hypertensives: The hypergen study. Am J Hum Genet. 2001;68:136–144. doi: 10.1086/316927. [DOI] [PMC free article] [PubMed] [Google Scholar]
- 12.Garrett MR, Gunning WT, Radecki T, Richard A. Dissection of a genetic locus influencing renal function in the rat and its concordance with kidney disease loci on human chromosome 1q21. Physiol Genomics. 2007;30:322–334. doi: 10.1152/physiolgenomics.00001.2007. [DOI] [PMC free article] [PubMed] [Google Scholar]
- 13.Joe B, Garrett MR, Dene H, Rapp JP. Substitution mapping of a blood pressure quantitative trait locus to a 2.73 mb region on rat chromosome 1. J Hypertens. 2003;21:2077–2084. doi: 10.1097/00004872-200311000-00017. [DOI] [PubMed] [Google Scholar]
- 14.Savin VJ, Sharma R, Lovell HB, Welling DJ. Measurement of albumin reflection coefficient with isolated rat glomeruli. J Am Soc Nephrol. 1992;3:1260–1269. doi: 10.1681/ASN.V361260. [DOI] [PubMed] [Google Scholar]
- 15.Kaufman JM, Hardy R, Hayslett JP. Age-dependent characteristics of compensatory renal growth. Kidney Int. 1975;8:21–26. doi: 10.1038/ki.1975.72. [DOI] [PubMed] [Google Scholar]
- 16.Packard M, Saad Y, Gunning WT, Gupta S, Shapiro J, Garrett MR. Investigating the effect of genetic background on proteinuria and renal injury using two hypertensive strains. Am J Physiol Renal Physiol. 2009;296:F839–846. doi: 10.1152/ajprenal.90370.2008. [DOI] [PMC free article] [PubMed] [Google Scholar]
- 17.Solberg Woods LC, Stelloh C, Regner KR, Schwabe T, Eisenhauer J, Garrett MR. Heterogeneous stock rats: A new model to study the genetics of renal phenotypes. Am J Physiol Renal Physiol. 2010;298:F1484–1491. doi: 10.1152/ajprenal.00002.2010. [DOI] [PMC free article] [PubMed] [Google Scholar]
- 18.Musunuru K, Lettre G, Young T, Farlow DN, Pirruccello JP, Ejebe KG, Keating BJ, Yang Q, Chen MH, Lapchyk N, Crenshaw A, Ziaugra L, Rachupka A, Benjamin EJ, Cupples LA, Fornage M, Fox ER, Heckbert SR, Hirschhorn JN, Newton-Cheh C, Nizzari MM, Paltoo DN, Papanicolaou GJ, Patel SR, Psaty BM, Rader DJ, Redline S, Rich SS, Rotter JI, Taylor HA, Jr., Tracy RP, Vasan RS, Wilson JG, Kathiresan S, Fabsitz RR, Boerwinkle E, Gabriel SB. Candidate gene association resource (care): Design, methods, and proof of concept. Circ Cardiovasc Genet. 2010;3:267–275. doi: 10.1161/CIRCGENETICS.109.882696. [DOI] [PMC free article] [PubMed] [Google Scholar]
- 19.Keating BJ, Tischfield S, Murray SS, Bhangale T, Price TS, Glessner JT, Galver L, Barrett JC, Grant SF, Farlow DN, Chandrupatla HR, Hansen M, Ajmal S, Papanicolaou GJ, Guo Y, Li M, Derohannessian S, de Bakker PI, Bailey SD, Montpetit A, Edmondson AC, Taylor K, Gai X, Wang SS, Fornage M, Shaikh T, Groop L, Boehnke M, Hall AS, Hattersley AT, Frackelton E, Patterson N, Chiang CW, Kim CE, Fabsitz RR, Ouwehand W, Price AL, Munroe P, Caulfield M, Drake T, Boerwinkle E, Reich D, Whitehead AS, Cappola TP, Samani NJ, Lusis AJ, Schadt E, Wilson JG, Koenig W, McCarthy MI, Kathiresan S, Gabriel SB, Hakonarson H, Anand SS, Reilly M, Engert JC, Nickerson DA, Rader DJ, Hirschhorn JN, Fitzgerald GA. Concept, design and implementation of a cardiovascular gene-centric 50 k snp array for large-scale genomic association studies. PLoS One. 2008;3:e3583. doi: 10.1371/journal.pone.0003583. [DOI] [PMC free article] [PubMed] [Google Scholar]
- 20.Luyckx VA, Brenner BM. The clinical importance of nephron mass. J Am Soc Nephrol. 2010;21:898–910. doi: 10.1681/ASN.2009121248. [DOI] [PubMed] [Google Scholar]
- 21.Rangel-Filho A, Sharma M, Datta YH, Moreno C, Roman RJ, Iwamoto Y, Provoost AP, Lazar J, Jacob HJ. Rf-2 gene modulates proteinuria and albuminuria independently of changes in glomerular permeability in the fawn-hooded hypertensive rat. J Am Soc Nephrol. 2005;16:852–856. doi: 10.1681/ASN.2005010029. [DOI] [PubMed] [Google Scholar]
- 22.Nanda N, Bao M, Lin H, Clauser K, Komuves L, Quertermous T, Conley PB, Phillips DR, Hart MJ. Platelet endothelial aggregation receptor 1 (pear1), a novel epidermal growth factor repeat-containing transmembrane receptor, participates in platelet contact-induced activation. J Biol Chem. 2005;280:24680–24689. doi: 10.1074/jbc.M413411200. [DOI] [PubMed] [Google Scholar]
- 23.Langer HF, Gawaz M. Platelet-vessel wall interactions in atherosclerotic disease. Thromb Haemost. 2008;99:480–486. doi: 10.1160/TH07-11-0685. [DOI] [PubMed] [Google Scholar]
- 24.Gleissner CA, von Hundelshausen P, Ley K. Platelet chemokines in vascular disease. Arterioscler Thromb Vasc Biol. 2008 doi: 10.1161/ATVBAHA.108.169417. [DOI] [PMC free article] [PubMed] [Google Scholar]
- 25.Marti F, Post NH, Chan E, King PD. A transcription function for the t cell-specific adapter (tsad) protein in t cells: Critical role of the tsad src homology 2 domain. J Exp Med. 2001;193:1425–1430. doi: 10.1084/jem.193.12.1425. [DOI] [PMC free article] [PubMed] [Google Scholar]
- 26.Drappa J, Kamen LA, Chan E, Georgiev M, Ashany D, Marti F, King PD. Impaired t cell death and lupus-like autoimmunity in t cell-specific adapter protein-deficient mice. J Exp Med. 2003;198:809–821. doi: 10.1084/jem.20021358. [DOI] [PMC free article] [PubMed] [Google Scholar]
- 27.Fukumoto Y, Matoba T, Ito A, Tanaka H, Kishi T, Hayashidani S, Abe K, Takeshita A, Shimokawa H. Acute vasodilator effects of a rho-kinase inhibitor, fasudil, in patients with severe pulmonary hypertension. Heart. 2005;91:391–392. doi: 10.1136/hrt.2003.029470. [DOI] [PMC free article] [PubMed] [Google Scholar]
- 28.Mueller BK, Mack H, Teusch N. Rho kinase, a promising drug target for neurological disorders. Nat Rev Drug Discov. 2005;4:387–398. doi: 10.1038/nrd1719. [DOI] [PubMed] [Google Scholar]
- 29.Sah VP, Seasholtz TM, Sagi SA, Brown JH. The role of rho in g protein-coupled receptor signal transduction. Annu Rev Pharmacol Toxicol. 2000;40:459–489. doi: 10.1146/annurev.pharmtox.40.1.459. [DOI] [PubMed] [Google Scholar]
- 30.Banerjee J, Wedegaertner PB. Identification of a novel sequence in pdz-rhogef that mediates interaction with the actin cytoskeleton. Mol Biol Cell. 2004;15:1760–1775. doi: 10.1091/mbc.E03-07-0527. [DOI] [PMC free article] [PubMed] [Google Scholar]
- 31.Longenecker KL, Lewis ME, Chikumi H, Gutkind JS, Derewenda ZS. Structure of the rgs-like domain from pdz-rhogef: Linking heterotrimeric g protein-coupled signaling to rho gtpases. Structure. 2001;9:559–569. doi: 10.1016/s0969-2126(01)00620-7. [DOI] [PubMed] [Google Scholar]
- 32.Panizzi JR, Jessen JR, Drummond IA, Solnica-Krezel L. New functions for a vertebrate rho guanine nucleotide exchange factor in ciliated epithelia. Development. 2007;134:921–931. doi: 10.1242/dev.02776. [DOI] [PubMed] [Google Scholar]
- 33.Nakamura A, Hayashi K, Ozawa Y, Fujiwara K, Okubo K, Kanda T, Wakino S, Saruta T. Vessel- and vasoconstrictor-dependent role of rho/rho-kinase in renal microvascular tone. J Vasc Res. 2003;40:244–251. doi: 10.1159/000071888. [DOI] [PubMed] [Google Scholar]
- 34.Morigi M, Buelli S, Angioletti S, Zanchi C, Longaretti L, Zoja C, Galbusera M, Gastoldi S, Mundel P, Remuzzi G, Benigni A. In response to protein load podocytes reorganize cytoskeleton and modulate endothelin-1 gene: Implication for permselective dysfunction of chronic nephropathies. Am J Pathol. 2005;166:1309–1320. doi: 10.1016/S0002-9440(10)62350-4. [DOI] [PMC free article] [PubMed] [Google Scholar]
- 35.Masszi A, Di Ciano C, Sirokmany G, Arthur WT, Rotstein OD, Wang J, McCulloch CA, Rosivall L, Mucsi I, Kapus A. Central role for rho in tgf-beta1-induced alpha-smooth muscle actin expression during epithelial-mesenchymal transition. Am J Physiol Renal Physiol. 2003;284:F911–924. doi: 10.1152/ajprenal.00183.2002. [DOI] [PubMed] [Google Scholar]
- 36.Tian YC, Fraser D, Attisano L, Phillips AO. Tgf-beta1-mediated alterations of renal proximal tubular epithelial cell phenotype. Am J Physiol Renal Physiol. 2003;285:F130–142. doi: 10.1152/ajprenal.00408.2002. [DOI] [PubMed] [Google Scholar]
- 37.Budzyn K, Marley PD, Sobey CG. Targeting rho and rho-kinase in the treatment of cardiovascular disease. Trends in Pharmacological Sciences. 2006;27:97–104. doi: 10.1016/j.tips.2005.12.002. [DOI] [PubMed] [Google Scholar]
- 38.Nagatoya K, Moriyama T, Kawada N, Takeji M, Oseto S, Murozono T, Ando A, Imai E, Hori M. Y-27632 prevents tubulointerstitial fibrosis in mouse kidneys with unilateral ureteral obstruction. Kidney Int. 2002;61:1684–1695. doi: 10.1046/j.1523-1755.2002.00328.x. [DOI] [PubMed] [Google Scholar]
- 39.Nishikimi T, Akimoto K, Wang X, Mori Y, Tadokoro K, Ishikawa Y, Shimokawa H, Ono H, Matsuoka H. Fasudil, a rho-kinase inhibitor, attenuates glomerulosclerosis in dahl salt-sensitive rats. J Hypertens. 2004;22:1787–1796. doi: 10.1097/00004872-200409000-00024. [DOI] [PubMed] [Google Scholar]
- 40.Fu M, Sabra MM, Damcott C, Pollin TI, Ma L, Ott S, Shelton JC, Shi X, Reinhart L, O’Connell J, Mitchell BD, Baier LJ, Shuldiner AR. Evidence that rho guanine nucleotide exchange factor 11 (arhgef11) on 1q21 is a type 2 diabetes susceptibility gene in the old order amish. Diabetes. 2007;56:1363–1368. doi: 10.2337/db06-1421. [DOI] [PubMed] [Google Scholar]
- 41.Akiyama K, Narita A, Nakaoka H, Cui T, Takahashi T, Yasuno K, Tajima A, Krischek B, Yamamoto K, Kasuya H, Hata A, Inoue I. Genome-wide association study to identify genetic variants present in japanese patients harboring intracranial aneurysms. J Hum Genet. 2010;55:656–661. doi: 10.1038/jhg.2010.82. [DOI] [PubMed] [Google Scholar]
- 42.Rankinen T, Church T, Rice T, Markward N, Blair SN, Bouchard C. A major haplotype block at the rho-associated kinase 2 locus is associated with a lower risk of hypertension in a recessive manner: The hypgene study. Hypertens Res. 2008;31:1651–1657. doi: 10.1291/hypres.31.1651. [DOI] [PMC free article] [PubMed] [Google Scholar]
- 43.Johnson AD, Yanek LR, Chen M-H, Faraday N, Larson MG, Tofler G, Lin SJ, Kraja AT, Province MA, Yang Q, Becker DM, O’Donnell CJ, Becker LC. Genome-wide meta-analyses identifies seven loci associated with platelet aggregation in response to agonists. Nat Genet. 2010;42:608–613. doi: 10.1038/ng.604. [DOI] [PMC free article] [PubMed] [Google Scholar]
- 44.Dai KZ, Harbo HF, Celius EG, Oturai A, Sorensen PS, Ryder LP, Datta P, Svejgaard A, Hillert J, Fredrikson S, Sandberg-Wollheim M, Laaksonen M, Myhr KM, Nyland H, Vartdal F, Spurkland A. The t cell regulator gene sh2d2a contributes to the genetic susceptibility of multiple sclerosis. Genes Immun. 2001;2:263–268. doi: 10.1038/sj.gene.6363774. [DOI] [PubMed] [Google Scholar]
- 45.Smerdel A, Dai KZ, Lorentzen AR, Flato B, Maslinski S, Thorsby E, Forre O, Spurkland A. Genetic association between juvenile rheumatoid arthritis and polymorphism in the sh2d2a gene. Genes Immun. 2004;5:310–312. doi: 10.1038/sj.gene.6364093. [DOI] [PubMed] [Google Scholar]
- 46.Wolf MT, Karle SM, Schwarz S, Anlauf M, Glaeser L, Kroiss S, Burton C, Feest T, Otto E, Fuchshuber A, Hildebrandt F. Refinement of the critical region for mckd1 by detection of transcontinental haplotype sharing. Kidney Int. 2003;64:788–792. doi: 10.1046/j.1523-1755.2003.00161.x. [DOI] [PubMed] [Google Scholar]
- 47.Wolf MT, van Vlem B, Hennies HC, Zalewski I, Karle SM, Puetz M, Panther F, Otto E, Fuchshuber A, Lameire N, Loeys B, Hildebrandt F. Telomeric refinement of the mckd1 locus on chromosome 1q21. Kidney Int. 2004;66:580–585. doi: 10.1111/j.1523-1755.2004.00799.x. [DOI] [PubMed] [Google Scholar]
- 48.Kiser RL, Wolf MT, Martin JL, Zalewski I, Attanasio M, Hildebrandt F, Klemmer P. Medullary cystic kidney disease type 1 in a large native-american kindred. Am J Kidney Dis. 2004;44:611–617. [PubMed] [Google Scholar]
Associated Data
This section collects any data citations, data availability statements, or supplementary materials included in this article.
Supplementary Materials
Table S1- Localization of Proteinuria QTL by Recombinant Progeny Test (RPT)
Table S2- Primers used to amply gene transcript for cloning- only those with coding sequence differences (Table 1)
Table S3- Haplotype analysis using panel of inbred with susceptibility or resistance to kidney injury
Table S4- Annotated genes the smallest congenic strain [S.SHR(2)X47], introgressed SHR segment from D2Rat127-D2Rat230
Table S5- GeXP Multiplex Gene Expression
Table S6- Real-Time PCR primers
Table S7- GeXP Multiplex Primers
Figure S1: Schematic diagram of the approach used to narrow gene/ genetic variants associated with kidney injury on rat chromosome 2. The predominant method was substitution analysis using recombinant progeny testing (RPT) and/or congenic strain analysis. The use of other methods, such as haplotype analysis, comparative mapping, and linkage or genome-wide association studies (GWAS) in humans was used to further refine the likely location of the QTL. Once the number of genes were narrowed to a manageable number (~20-30), sequencing, gene expression, and bioinformatics analysis was performed to identify strong candidate genes that can be further studied in vivo by genetic modification (e.g., gene knockout) or by pharmacological agents.
Figure S2: Fine-mapping of the chromosome 2 genomic interval associated with kidney injury in the Dahl S. (A) Ideogram showing the 95% confidence interval (CI) of proteinuria quantitative trait loci (QTL) from original linkage analysis (solid black bar)16. (B) Recombinant progeny testing (RPT) was employed to refine the genomic region containing the genetic variants linked to kidney injury. The basis of RPT is to identify recombinant animals (e.g. different donor SHR regions), to propagate these recombinant animals by backcross to S, then to measure the phenotypes of the progeny. The influence of each recombinant region (i.e. SHR genotype) was determined by subtracting average proteinuria of recombinant rats (SHR-like) from proteinuria of non-recombinant (S-like) littermates. Red bars denote that recombinant animals (SHR-like) had significantly (p < 0.05) lower proteinuria compared to non-recombinant (S-like) littermates. Yellow bars denote there was not a significant difference in proteinuria between recombinant and non-recombinant littermates. The proteinuria effect and number of animals tested from each recombinant family are shown in Table S1. Based on RPT, the QTL interval was narrowed to genomic region defined to D2Rat131-D2Rat230 (~2.75 Mb). The S.SHR(2)X39 recombinant family was used to generate a congenic strain that fixed the transferred genomic interval homozygous SHR/SHR (Fig. 1). The S.SHR(2)X47 was generated from a new recombination that occurred while developing the S.SHR(2)X39 strain. These fixed congenic strain were phenotyped for other measures of kidney injury and function (Studies 2-6).
Figure S3: Time course assessment of blood pressure, proteinuria, and kidney injury in S and S.SHR(2)X47 from week 8 to 20. (A) Systolic blood pressure measured by telemetry (n=10 per group). (B) Proteinuria and kidney weight (n= 12 per group). (C) Morphometric analysis of tubulointerstitial fibrosis, representative images of Masson’s Trichrome and immunohistochemical straining of CD-68 (ED-1; macrophage). The S.SHR(2)X47 congenic exhibited significantly less proteinuria, which is supported by the decreased tubulointerstitial injury (fibrosis and less macrophage infiltration). This data is constant with the larger congenic for which detailed phenotyping was performed.*, p<0.05.
Figure S4: Blood pressure, autoregulation of renal blood flow (RBF) and glomerular number and permeability between S and S.SHR(2)X39 on normal rodent diet (0.7% NaCl, Purina 5010). (A) Conscious mean arterial pressure (MAP). (B) RBF autoregulation (left y-axis) and autoregulatory index (right y-axis) and RVR (renal vascular resistance). Both groups effectively autoregulate RBF as renal profusion pressure is increased (AI ~ 0). (C) Proteinuria and glomerular permeability. Proteinuria was evaluated in groups of S and S.SHR(2)X39 animals before glomeruli were isolated for permeability assay. There is a distinct difference in proteinuria between groups, but no difference in the reflection coefficient of albumin. This suggests that the detected difference in proteinuria is not likely due to the degree of filtered protein. (D) Nephron/glomeruli number. Measurements were made at week 12 (n=8 per group), except for nephron number which was also evaluated week 6.*, p<0. 05.
Figure S5: Multiplex gene expression profiling between S and S.SHR(2)X39 normal rodent diet (0.7% NaCl, Purina 5010) at week 12. (A) Representative multiplex gene expression chromatograph of all the genes in the genomic region using Beckman Coulter (GeXP) platform. The benefit to this approach is the ability measure gene expression patterns of genes within the genomic locus simultaneously. (B) Scatter plot and regression of two independent multiplex studies which demonstrates high correlation (r=0.95, p<0.0001) between experiments. The average of two experiments (each sample run in triplicate) is presented in Table S5. (C) Scatter plot and regression of multiplex gene expression (GeXP) and follow-up using real-time PCR on a subset of genes (Fig. 5). The two methods are highly correlated (r=0.77, p<0.001).
Figure S6: Decision tree used to establish top candidate genes based on three classifications: (1) nature and type of sequence variants; (2) differential expression; and (3) potential biological significance. Depending on the path (no or yes), genes were classified as low priority (shown in red), medium priority (shown in yellow), or high priority (shown in green). A gene that exhibited “high priority” designation in each classification is considered an important gene for additional study. Thus, a gene that is denoted as high priority for every classification (1. sequence variants, 2. expression, and 3. biological significance) is assumed to have highest probability to play a functional role, more so than other genes in the genomic interval designated as low or medium priority.
Figure S7: Regional plot for the candidate region associated with UACR in individuals. X-axis shows the genomic region and genes and the y-axis shows the -log10 p-values for associations with UACR. The panel also shows the recombination rate in the region estimated from HapMap CEU data and pairwise linkage disequilibrium (r2) between SNPs in the region and rs7534418 (labeled in purple) estimated from the meta-analyses. The r2 values are color coded according to the scale on each panel.