Abstract
In the central nervous system, angiotensin II (AngII) binds to angiotensin type 1 receptors (AT1R) to affect autonomic and endocrine functions as well as learning and memory. However, understanding the function of cells containing AT1Rs has been restricted by limited availability of specific antisera, difficulties discriminating AT1 receptor-immunoreactive cells in many brain regions and, the identification of AT1R-containing neurons for physiological and molecular studies. Here, we demonstrate that an Agtr1a bacterial artificial chromosome (BAC) transgenic mouse line that expresses type A AT1Rs (AT1aRs) identified by enhanced green fluorescent protein (EGFP) overcomes these shortcomings. Throughout the brain, AT1aR-EGFP was detected in the nuclei and cytoplasm of cells, most of which were neurons. EGFP often extended into dendritic processes and could be identified either natively or with immunolabeling of EGFP. The distribution of AT1aR-EGFP cells in brain closely corresponded to that reported for AngII binding and AT1aR protein and mRNA. In particular, AT1aR-EGFP cells were in autonomic regions (e.g., hypothalamic paraventricular nucleus, central nucleus of the amygdala, parabrachial nucleus, nuclei of the solitary tract and rostral ventrolateral medulla) and in regions involved in electrolyte and fluid balance (i.e., subfornical organ) and learning and memory (i.e., cerebral cortex and hippocampus). Additionally, dual label electron microscopic studies in select brain areas demonstrate that cells containing AT1aR-EGFP colocalize with AT1R-immunoreactivity. Assessment of AngII-induced free radical production in isolated EGFP cells demonstrated feasibility of studies investigating AT1aR signaling ex vivo. These findings support the utility of Agtr1a BAC transgenic reporter mice for future studies understanding the role of AT1 receptor containing cells in brain function.
Keywords: autonomic nuclei, hypothalamus, subfornical organ, amygdala, nucleus of the solitary tract, rostral ventrolateral medulla
INTRODUCTION
Angiotensin type 1 receptors (AT1Rs) mediate regulation of autonomic function by angiotensin II (AngII) in the central nervous system (CNS). In particular, brain AT1Rs regulate blood pressure, fluid and electrolyte balance and neuroendocrine functions (Allen et al., 2000; McKinley et al., 2003; Zimmerman et al., 2004). Moreover, AT1Rs are involved in learning and memory processes (Belcheva et al., 2000; Denny et al., 1991; Wright et al., 1993) as well as regulation of inflammation (Benicky et al., 2011). Previous anatomical studies have shown that AngII binding and AT1R immunoreactivity (ir) and mRNA are expressed in brain regions that are known to regulate these functions. These include the subfornical organ (SFO), paraventricular nucleus (PVN) of the hypothalamus, amygdala, hippocampus, nucleus of the solitary tract (NTS) and rostral ventrolateral medulla (RVLM) (Aldred et al., 1993; Hauser et al., 1998; Lenkei et al., 1997; Rowe et al., 1990; Tsutsumi and Saavedra, 1991).
Characterizing the phenotype and understanding the function of AT1R containing cells in the CNS has been restricted by several factors. First, the availability of specific AT1R antibodies is limited. Second, since immunoreactivity for AT1R may be relegated to certain organelles or cellular regions (Pierce et al., 2009), distinct identification of AT1R-immunoreactive cells is difficult in many brain regions. Third, detection of AT1R-ir for some antibodies is optimal in brain tissue that is perfusion fixed with paraformaldehyde containing acrolein (Glass et al., 2005; Huang et al., 2003; Pierce et al., 2009). Unfortunately, acrolein can auto-fluoresce making it difficult to visualize cells with low levels of AT1Rs with immunofluorescence. Fourth, understanding the function of cells containing AT1Rs has been limited due to lack of identification of these cells in live preparations in which physiological and/or molecular phenomena can be observed.
In this study, we describe an Agtr1a bacterial artificial chromosome (BAC) transgenic reporter mouse line obtained from the Gene Expression Nervous System Atlas (GENSAT) project (Gong et al., 2003) developed to overcome the shortcomings. Cells containing enhanced green fluorescent protein (EGFP) indicative of type A AT1R (AT1aR) expression were detected throughout the brain. Light and electron microscopic studies confirmed that nearly all of AT1aR-EGFP cells were neurons. Vital or aldehyde-fixed EGFP containing cells could be identified either natively supporting their utility for physiological and molecular studies or immunocytochemically supporting their utility for light and electron microscopic studies. The distribution of AT1aR-EGFP cells throughout the brain was consistent with that shown previously for AngII binding, AT1R immunoreactivity and mRNA. Moreover, electron microscopy showed colocalization of AT1aR-EGFP and AT1R-ir in cells supporting the fidelity of the Agtr1a BAC transgenic reporter mouse line for use in future studies.
EXPERIMENTAL PROCEDURE
Animals
All methods were conducted in accordance with the 2011 Eighth Edition of the National Institute of Health Guide for the Care and Use of Laboratory Animals and were approved by the Rockefeller University Institutional Animal Care and Use Committee. Adult male and female AT1aR BAC transgenic mice and their non-transgenic littermates (N = 30; see below for description) were housed in a reversed light cycle (12:12 light:dark cycle, lights on 6pm) temperature-controlled room with free access to food and water. Mice were between 2 and 3 months old in the anatomical studies and between 3 and 5 weeks old in the physiological studies at the time of sacrifice. The estrous cycle stage of female mice was monitored for two weeks prior to sacrifice using vaginal smear cytology (Turner and Bagnara, 1971).
Hemizygous BAC-based Agtr1a-EGFP (NZ44) mice were obtained from the GENSAT Project (www.gensat.org) at the Rockefeller University (Gong et al., 2003). Briefly, generation of the mice involved the insertion of an EGFP cassette into a BAC (RP24-63B19) via homologous recombination. The EGFP sequence was placed at the start site for AT1aR via the use a homology arm that is directly upstream of the ATG start site of the coding sequence of AT1aR. The result is that the coding sequence of EGFP takes the place of the coding sequence of AT1aR on the BAC. The EGFP possesses a poly A tail preventing the AT1aR gene on the BAC from being transcribed. Thus, the cells containing EGFP do not have more or less AT1aR expression than normal. The number of BACs that are inserted into the genome is usually in the range of 4–8 and insertion is limited to a single, random site. The native copy of the AT1aR gene on chromosome 13 of the mouse is untouched and functions as normal. Hemizygote BAC-based Agtr1a transgenic mice were originally on a FVB/N background. The mice used for the studies presented here have been back-crossed with wild-type C57BL/6 mice for two generations. However, as of 2012, the mice have been back-crossed five generations. Examination of brains from mice back-crossed 5 generations with C57BL/6 mice show an identical topographic distribution of the AT1aR-EGFP cells in the brain.
Immunocytochemical procedures
Section Preparation
For immunoperoxidase and immunoelectron microscopy, mice were deeply anesthetized with sodium pentobarbital (150 mg/kg) and their brains fixed by aortic arch perfusion sequentially with 2 – 3 ml saline (0.9%) containing 2% heparin followed by 30 ml of 3.75% acrolein and 2% paraformaldehyde in PB (Milner et al., 2011). After the perfusion, the brains were removed and post-fixed for 30 minutes in 2% acrolein and 2% paraformaldehyde in PB. For fluorescence, mice were deeply anesthetized with sodium pentobarbital (150 mg/kg) and their brains fixed by aortic arch perfusion sequentially with 2 – 3 ml saline (0.9%) containing 2% heparin followed by 30 ml 4% paraformaldehyde in PB. After the perfusion, the brains were post-fixed for 1 hr in the fixative.
The brains then were cut into 5 mm coronal blocks using a brain mold (Activational Systems, Inc., Warren, MI) and sectioned (40 μm thick) on a VT1000X Vibratome (Leica Microsystems, Buffalo Grove, IL). Brain sections were stored at −30°C in cryoprotectant (30% sucrose, 30% ethylene glycol in PB) until immunocytochemical processing. For quantitative studies, several steps were taken to ensure identical labeling conditions between experimental groups (Pierce et al., 1999). In particular, tissue from each experimental condition was marked with identifying punches, pooled into single containers and then processed through all immunocytochemical procedures together.
Prior to immunocytochemistry, sections were incubated in 1% sodium borohydride in PB for 30 minutes to neutralize free aldehydes and rinsed thoroughly in PB. Sections then were rinsed in 0.1 M Tris-buffered saline (TS; pH 7.6) and incubated in 0.5% bovine serum albumin (BSA) in TS for 30 minutes.
Antisera
All antisera have been well characterized.
An affinity purified rabbit antibody to the AT1R (#92578) was raised against the C terminal portion (amino acids 341-355; PSD-NMSSSAKKPASC) of the rat AT1AR (note: the C terminal portion of the mouse differs by one amino acid - PSD-NMSSAAKKPASC). The antiserum is the same used in earlier studies (Glass et al., 2005; Huang et al., 2003) except that it was not purified for separation of the AT1A and AT1B subtypes, and is thus designated as an AT1 receptor antiserum (Pierce et al., 2009). The selectivity of this antiserum for AT1 versus AT2 receptors has been demonstrated using Chinese hamster ovarian cells differentially transfected with AT1ARs, AT1BRs and AT2Rs (Huang et al., 2003). Preadsorption of the antibody (1:600 dilution) with the antigenic peptide (100 μg/ml) completely removed punctate immunolabeling in the NTS and area postrema in rat brain sections fixed with acrolein and paraformaldehyde (Huang et al., 2003). To additionally test the specificity of the antibody, AT1R immunolabeling was performed in mice with conditional deletion of AT1AR in the SFO. For this, adult male mice harboring a “floxed” AT1AR allele (kind gift of Dr. Thomas M. Coffman) (Gurley et al., 2011) underwent SFO- targeted injection into the lateral ventricle of a recombinant adenovirus (Ad) expressing Cre-recombinase (Ad-Cre; 3 × 10⁶ pfu/ml; 500 nl; N = 4) or titer-matched control virus Ad-LacZ (N = 4) over a period of 3-5 minutes, as described previously (Sinnayah et al., 2004). Ten days later, mice were perfused with acrolein/paraformaldehyde and processed for AT1R peroxidase immunocytochemistry as described below. Intense peroxidase immunoreaction product was seen in the SFO of Ad-LacZ injected mice but not in Ad-Cre injected mice (Fig. 1).
Fig. 1. AT1R-ir is absent following a targeted SFO deletion of AT1aR.
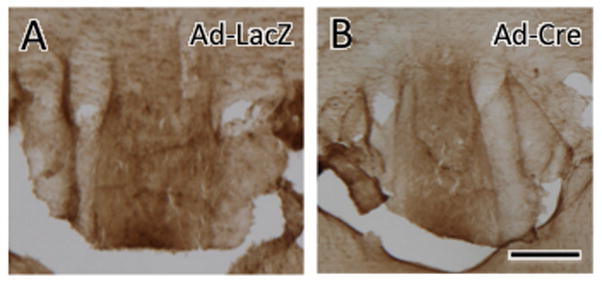
Intense peroxidase AT1R-ir was seen in the SFO of a control Ad-LacZ injected AT1aR floxed mouse (A) but not an Ad-Cre injected AT1aR floxed mouse (B). Bar, 0.1 mm.
The chicken GFP antibody was generated against recombinant GFP (Aves Lab Inc., San Diego, CA) and recognizes the gene product of EGFP expressing transgenic mice (Encinas et al., 2006). The specificity of this antibody has been demonstrated by Western blot (see data sheet for EGFP-1020 at www.aveslab.com) and has been used in our previous studies (Bulloch et al., 2008; Milner et al., 2010). Moreover, this antibody does not label cells in brain tissue from mice lacking EGFP (Volkmann et al., 2010; also see figure 1).
A polyclonal antibody to tyrosine hydroxylase (TH) generated in sheep (#AB1542; Millipore Corporation, Bedford, MA) was used. This antibody recognizes a single band (~60kDa) on Western blot from PC12 cells stimulated with okadaic acid (manufacturers data sheet). The specificity is supported by a neuroanatomical localization consistent with that known for noradrenaline (Kaufling et al., 2009; Noack and Lewis, 1989). Moreover, it labels the same brain structures as polyclonal rabbit anti-TH (Chemicon, AB152; Ramer et al., 2008).
A polyclonal antibody to arginine-vasopressin (AVP) was generated in guinea pig (T-5048, lot #061305; Peninsula Laboratories Inc., San Carlos, CA) and has been used in recent studies (Coleman et al., 2009; Milner et al., 2010). By radioimmunoassay, this antiserum shows complete recognition of vasopressin, a slight cross-reaction (<1%) with other vasopressin derivatives and no recognition of oxytocin (Peninsula Laboratories). The specificity of this antibody has been confirmed by preadsorption immunocytochemistry, in which all staining is abolished (see Hundahl et al., 2010) and by absence of staining in the Brattleboro rat, which due to a natural genetic mutation is unable to produce AVP (Drouyer et al., 2010).
A mouse monoclonal antibody to glial fibrillary acidic protein (GFAP) was purchased from Cell Signaling Technology (GA5 #3670; Boston, MA). This antibody recognizes a single 52-kDA band on Western blots, (see manufacturer’s data sheet) and yields a cellular morphology and distribution pattern in rat brain identical to known astrocyte distributions (see Levendusky et al., 2009).
Immunoperoxidase methods
Coronal sections (approximately 240 μm apart) through the rostrocaudal extent of the Agtr1a BAC transgenic mice (or their non-transgenic littermates) brains were processed for the immunocytochemical localization of the GFP antiserum using the avidin-biotin complex (ABC) method (Milner et al., 2011). A 24 hr incubation at room temperature (~25°C) was followed by a 24 hour 4°C incubation in the GFP antiserum (1:5,000 dilution) in 0.1% BSA in Tris-saline (TS; pH 7.6). All sections then were incubated in a 1:400 dilution of biotinylated goat anti-chicken immunoglobulin (IgG) (Jackson Immunoresearch Inc., West Grove, PA) BSA/TS for 30 minutes, rinsed in TS and incubated in avidin-biotin complex (ABC; at twice the recommended dilution; Vector Laboratories; Burlingame, CA) for 30 minutes. Sections then were reacted in 3,3’-diaminobenzidine (Sigma-Aldrich Chemical Co., Milwaukee, WI) and H2O2 in TS for 6 minutes, rinse in PB, mounted on slides previously coated with 1% gelatin and dried in a desiccator. The slides were dehydrated through a graded series of ethanols and coverslipped from xylene with DPX (Sigma-Aldrich Chemical Co.).
Sections labeled for AT1aR-EGFP using immunoperoxidase were analyzed on a Nikon 80i light microscope equipped with bright-field and differential interference optics and a Micropublisher digital camera (Q Imaging, Barnaby, British Columbia). The distribution of AT1aR-EGFP cells was plotted onto standardized brain maps (Hof et al., 2000) using Adobe Illustrator CS3 (Adobe systems). Each map represents the relative distribution of AT1aR-EGFP cells using a composite of 7 brains (4 female and 3 male). EGFP containing cells were qualitatively divided into 3 groups: 1) light cells (open circles) 2) dark cells (solid circles); 3) many dark cells (starbursts) (see Fig. 5). An additional set of sections was prepared for quantitative analysis. For this, sections from the rostrocaudal extent of 6 Agtr1a EGFP transgenic mice [3 males and 3 females (2 in diestrus and 1 in estrus, both low estrogen states] were punch coded, pooled into the same container processed using the same batch of primary and secondary antibodies (Pierce et al., 1999). AT1aR-EGFP cells from select brain regions then were counted from a 0.04 mm2 area using a grid reticule on a Nikon Labophot microscope by a person blind to experimental conditions. Differences between groups were determined using a student’s t-test.
Fig. 5. Distribution of AT1aR-EGFP cells in coronal sections of the Agtr1a BAC transgenic mouse brain.
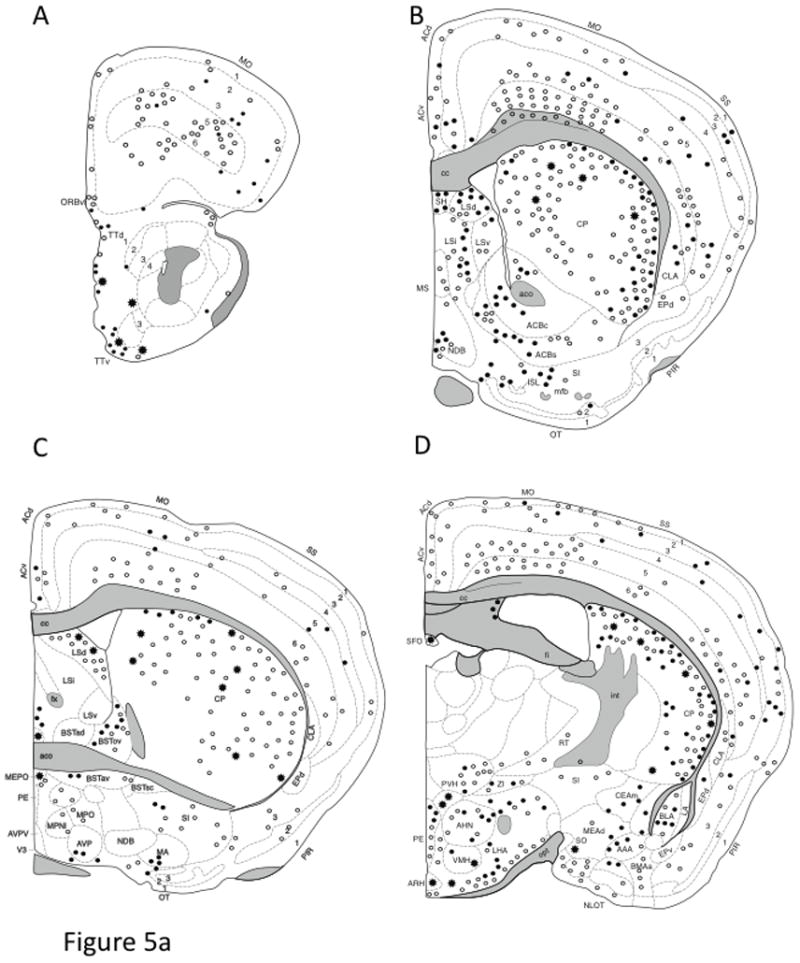
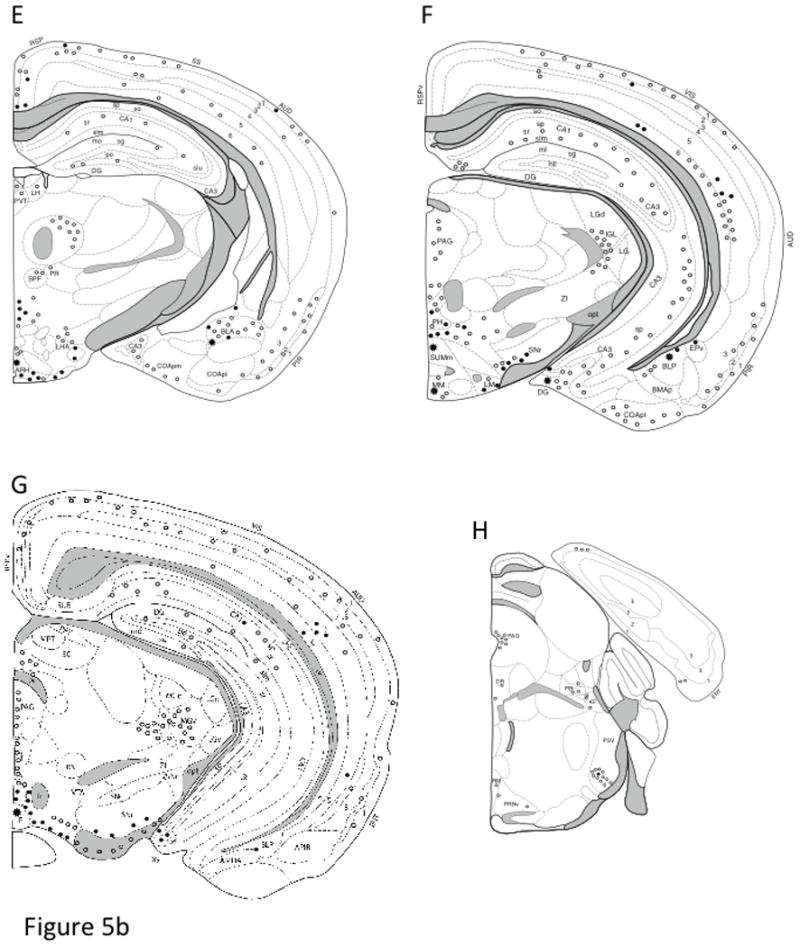
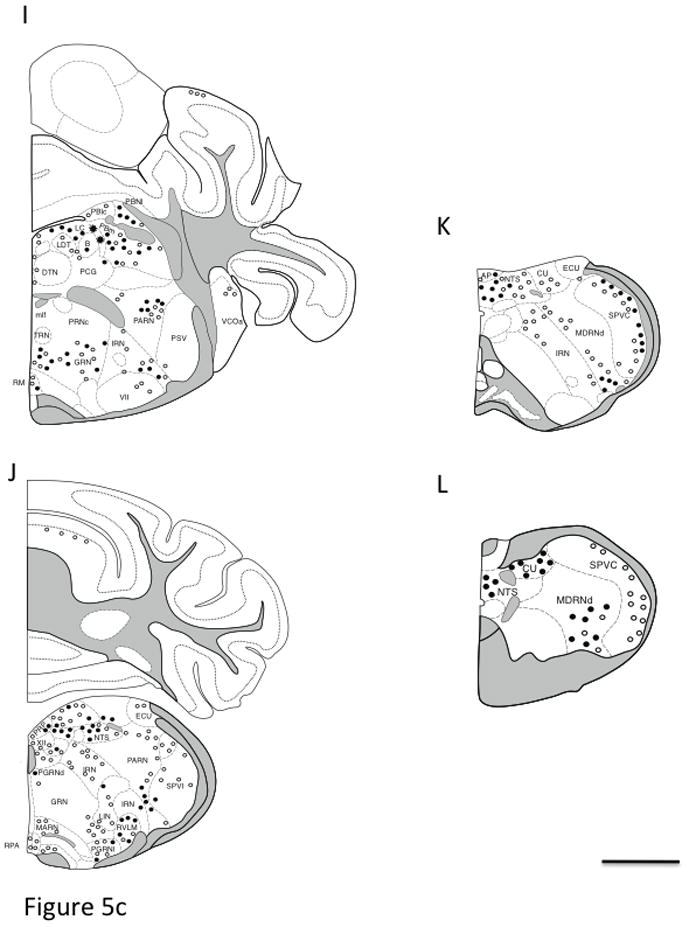
Drawings are arranged from rostral (A) to caudal (L) and are separated by a distance of 500 – 800 μm. The drawings are modified from Hof et al. (Hof et al., 2000) and represent a composite qualitative distribution of the brains from 3 male and 3 female Agtr1a BAC transgenic mice. Light cells = open circle symbol (○); Dark cells = solid circle symbol (●); Clusters of cells = the asterisk symbol (*). In select regions, the number of AT1aR-EGFP cells was quantified (see table 1). Bar, 1 mm.
Abbreviations: AAA, anterior Amygdala area; ACBc and ACBs, nucleus accumbens core and shell; AC, anterior cingulate cortex; ac, anterior commissure; AHN, anterior hypothalamic nucleus; AO, anterior olfactory nucleus; AP, area postrema; ARH, arcuate nucleus of the hypothalamus; AUD, auditory cortex; Avp, anteroventral preoptic nucleus; AVPV, anteroventral periventricular nucleus of the hypothalamus; B, Barrington nucleus; BLA, basolateral amygdala; BLP, BLA posterior part; BMA, basomedial nucleus of the amygdala; BST, bed nucleus of the stria terminalis; cc, corpus callosum; CEAc, central nucleus of the amygdala; CENT, central lobe of the cerebellum; cg, cingulum bundle; CG, central gray matter; CLA, claustrum; COA, cortical nucleus of the amygdala; CP, caudate putamen; CU, cuneate nucleus; DG, dentate gyrus; DH, dorsal horn of the spinal cord; DMX, dorsal motor nucleus of vagus; DR, dorsal nucleus of the raphe cuneate nucleus; DTN, dorsal tegmental nucleus; ECU, external cuneate; ENT, entorhinal cortex; EP, endopiriform nucleus; fi, fimbria; fr, fasciculus retroflexus; Fx, fornix; GRN, gigantocellular reticular nucleus; IF, interfascicular nucleus; IGL, intergeniculate leaflet; int, internal capsule; IRN, intermediate reticular nucleus; ISL, insula of calleja; KF, Kolliker-fuse nucleus; LC, locus coeruleus; LDT, laterodorsal tegmental nucleus; LGd, lateral geniculate nucleus; LH, lateral habenula; LHA, lateral hypothalamic area; LIN, linear nucleus of the medulla; LM, lateral mammillary nucleus; lot, Lateral Olfactory tract; LSd, lateral septum nucleus; MA, magnocellular preoptic nucleus; MARN, magnocellular reticular nucleus; MDRN, medullary reticular nucleus; MEA, medial nucleus of the Amygdala; MEPO, median preoptic nucleus; mfb, medial forebrain bundle; MG, medial geniculate nucleus; MH, medial habenula; mlf, medial longitudinal fasciculus; MM, medial mammillary nucleus; mo, molecular layer; MO, motor cortex; MPNI, medial preoptic nucleus; MPO, medial preoptic area; MPT, medial pretectal nucleus; MRN, mesencephalic reticular nucleus; MS, medial septum nucleus; NDB, nucleus of the diagonal band of Broca; NLOT, nucleus of the lateral olfactory tract; NTS, nucleus of the solitary tract; opt, optic tract; ORB, orbital cortex; OT, olfactory tubercule; PAG, periaqueductal gray matter; PARN, parvicellular reticular nucleus; PBL, parabrachial nucleus; pc, posterior commissure; PCG, pontine central gray; PE, periventricular nucleus of the hypothalamus; PF, parafascicular nucleus of the thalamus; PGRN, paragigantocellular reticular nucleus; PH, posterior hypothalamic area; PIR, piriform cortex; po, polymorphic layer; POR, periolivary nuclei; PPT, posterior pretectal nucleus; PRN, pontine reticular nucleus; PRP, nucleus prepositus; PSV, principal sensory nucleus of the trigeminal nerve; PVH paraventricular nucleus of the hypothalamus; PVT, paraventricular nucleus of the thalamus; RE, reuniens nucleus of the thalamus; RM, nucleus raphe magnus; RN, red nucleus; RPA, nucleus raphe pallidus; RSP, retrosplenial cortex; RT, reticular nucleus of the thalamus; RVLM, rostroventrolateral reticular nucleus; SC, superior colliculus; SFO, subfornical organ; sg, granule cell layer; SG, substantia gelatinosa; SH, septohippocampal nucleus; SI, substantia innominata; SIM, simple lobule of the cerebellum; slm, stratum lacunosum moleculare; slu, stratum lucidum; SNc, substantia nigra, compact part; SNr, substantia nigra, reticular part; so, stratum oriens; SO, suproptic nucleus; sp, stratum pyramidale; SPF, subparafascicular nucleus of the thalamus; SPVI, spinal nucleus of the trigeminal nerve, interpolar parts; sr, stratum radiatum; SS, primary somatosensory cortex; SUM, supramammillary nucleus; TE, terete nucleus of the hypothalamus; ts, tractus solitarius; TT, tenia tecta; VCO, ventral cochlear nucleus; VH, ventral horn of the spinal cord; VI, visual cortex; VII, facial nucleus; VMH, ventromedial nucleus of the hypothalamus; VTA, ventral tegmental area; XII, hypoglassal nucleus; ZI, zona incerta Parts: a, anterior; av, anteroventral; c, central; d, dorsal; l, lateral; ov, oval; m, medial; p, posterior; pm, posteromedial; sc, subcommissural; v, ventral; vl, ventrolateral; vm, ventromedial
Dual labeling immunofluorescence methods
Sections through select brain regions were dually labeled for EGFP and either AVP, TH or GFAP, using immunofluorescence as previously described (Gonzales et al., 2011). Briefly, sections were rinsed thoroughly in PB and incubated in 1% BSA in PB for 30 minutes. Sections then were placed in a cocktail of GFP antiserum (1:1000) and either the AVP (1:1200), TH antiserum (1:1000) or GFAP (1:1000) in 0.5%BSA/PB and 0.25% Triton-X 100 for 24 hrs at room temperature and for 24 hours at 4°C. Next, sections were washed with PB and incubated for 1 hr in a cocktail of Alexa Fluor 448 (green) goat anti-chicken IgG for demonstration of EGFP (1:400; Invitrogen-Molecular Probes, Carlsbad, CA) and either Texas Red 540 donkey anti-guinea pig IgG for the demonstration of vasopressin (1:400; Jackson ImmunoResearch Laboratories, Inc., West Grove, PA), Alexa Fluor 647 (deep red) donkey anti-sheep IgG for demonstration of TH (1:400; Invitrogen-Molecular Probes) or Texas Red donkey anti-mouse IgG for demonstration of GFAP (1:400; Jackson) in 0.5%BSA/PB. Sections were washed in PB and then mounted on gelatin-coated slides, air-dried and coverslipped with Prolong mounting media (Invitrogen, Molecular Probes, Eugene, OR). Images were collected with a Leica TCS SP5 confocal microscope using an Argon laser (488) and a HeNe laser (543 and 633). Sequential scans were acquired to avoid any overlap between the wavelengths for the two labels. Z stacks images (approx. 20 μm at 1 μm each) were taken and combined into a single image using the Leica application suite software.
Reactive oxygen species (ROS) detection
Isolated cells were prepared from the PVN of juvenile (postnatal day 30 – 45 old) male Agtr1a BAC transgenic mice (N = 10) using previously described methods (Li et al., 1998; Wang et al., 2006a; Wang et al., 2004). Mice were anesthetized with CO2, decapitated, and their brains rapidly removed and immersed in sucrose-artificial cerebrospinal fluid (aCSF). Coronal slices (300 μm in thickness) through the hypothalamus containing the PVN were cut on a vibratome (Leica VT100S) and stored in a custom-designed chamber containing lactic acid (l)-aCSF gassed with 95% O2 and 5% CO2 at 35°C for 1 h. EGFP labeling was confirmed using a FITC filter on a Nikon EP6000 microscope. The PVN region then was removed using a micropunch, subjected to mild enzymatic digestion with 0.02% pronase and 0.02% thermolysin for 2 hrs and then stirred in the l-aCSF (Wang et al., 2006a; Wang et al., 2006b). The dissociated PVN neurons were immediately moved to a 35 mm glass-bottom Petri dish.
ROS production was assessed using dihydroethidium (DHE) as an indicator (Kazama et al., 2004; Wang et al., 2008). For this, isolated neurons were incubated in DHE (2 μmol/L) for 30 min and then exposed throughout the measurement to DHE-containing buffer. The ROS measurement commenced when a stable baseline was achieved with vehicle (0.01% BSA in lactic acid-aCSF) and then AngII (100 nM; Sigma-Aldrich) was added to the buffer. Native EGFP in dissociated cells initially was detected using the FITC spectrum of Leica TCS SP5 confocal microscope. In all experiments, concurrent vehicle recording was performed until there was no difference in DHE fluorescence intensity before AngII application. IPlab software (Scanalytics, Inc., Rockville, MD) and ImageJ (NIH) were used to perform quantitative analysis of the DHE intensity in a given EGFP-labeled cell. ROS data are expressed as the ratio Ft/Fo, where Ft is fluorescence following the application of AngII in a given cell, and Fo is the baseline fluorescence of the same cell immediately before application of AngII. The AT1 receptor antagonist, losartan (3 mm; a gift from Merck and Dupont, Whitehouse station, NJ) was added to the dish 10 minutes prior to AngII application. Statistical significance was analyzed using one-way ANOVA. P values < 0.05 were considered significant.
Immunoelectron microscopic methods
To examine the morphology of AT1aR-GFP containing cells, sections from select brain regions from 3 male Agtr1a BAC mice were processed for GFP immunoperoxidase as described for light microscopy. For the ultrastructural localization of AT1R-ir in Agtr1a BAC transgenic mice, sections through select brain regions were dual-labeled for AT1R immunoperoxidase and GFP-immunogold as described previously (Milner et al., 2011). Briefly, sections were incubated in an AT1R antiserum (1:1,000), in 0.1% BSA in TS for 1 day at room temperature followed by an additional 2 days at 4°C. One day prior to further processing, GFP antiserum (1:5000) was added to the primary antibody diluent. To visualize AT1 receptor-ir, sections were incubated in biotinylated goat anti-rabbit IgG (Vector) and processed for the ABC peroxidase technique described above. To visualize GFP-labeling, sections were rinsed in TS and incubated in rabbit anti-chicken IgG conjugated to 1 nm gold particles (1:50, Electron Microscopy Sciences (EMS), Fort Washington, PA) in 0.01% gelatin and 0.08% BSA in 0.01M phosphate-buffered saline (PBS; pH 7.4) at room temperature for 2 hours.
Sections were rinsed in PBS, post-fixed in 2% glutaraldehyde in PBS for 10 minutes, and rinsed in PBS followed by 0.2 M sodium citrate buffer (pH 7.4). The conjugated gold particles were enhanced by reaction in a silver solution (RPN491 Silver Enhance kit, GE Healthcare, Waukeska, WI) for 5 minutes. Sections were post-fixed for 1 hour in 2% osmium tetroxide, dehydrated through alcohols and propylene oxide, and embedded between two sheets of plastic in EMbed 812 (EMS). Ultrathin sections (70 nm thick) were cut from the region of interest on a Leica Ultracut UCT ultratome and collected on 400 mesh thin-bar copper grids (EMS). Sections were counter-stained with uranyl acetate and Reynold’s lead citrate, and final preparations were analyzed on a FEI Tecnai Biotwin transmission electron microscope. Profiles were identified and categorized using standardized morphological characteristics (Peters et al., 1991). Neuronal soma contained a nucleus which usually had a nucleolus and lacked heterochromatin and had abundant cytoplasm with mitochondria, endoplasmic reticulum and Golgi apparatus. Dendritic profiles contained regular microtubular arrays and were usually postsynaptic to axon terminal profiles. Axon terminal profiles had numerous small synaptic vesicles and had a cross-sectional diameter greater than 0.2 μm. Glial cells had nuclei that contained heterochromatin. Astrocytes were distinguished by their tendency to conform to the boundaries of surrounding profiles, by the absence of microtubules, and/or by the presence of glial filaments. GFP-labeled cells with distinguishable nuclei were counted and categorized as neuronal or glial in the SFO, PVN, NTS and RVLM from three male Agtr1a BAC mice.
Image preparation
Final photomicrographs were generated from digital images adjusted for levels, brightness and contrast in Adobe Photoshop CS3 on a Macbook computer. On confocal images, far red (Alexa Fluor 647) images were pseudocolored magenta. Images were assembled into the final figures using Powerpoint 2008.
RESULTS
Description of Agtr1a (AT1aR) BAC transgenic mouse line
To assess the fidelity of the Agtr1a BAC transgenic reporter mice, we first determined the cellular distribution of EGFP containing cells in the brains of males and females to determine how it compares to that reported previously (Daubert et al., 1999; Hauser et al., 1998; Lenkei et al., 1997) for AT1R binding, message and immunoreactivity (albeit using different antisera than the present study).
Morphology of EGFP cells in the Agtr1a (AT1aR) BAC transgenic mouse brain
EGFP cells were examined in the brains of male and female Agtr1a BAC transgenic reporter mice identified either with native fluorescence or enhanced with immunocytochemistry. EGFP was detected by light microscopy throughout the nuclei and cytoplasm of individual and more densely packed cells (Fig. 2A-C). Most cells in Agtr1a BAC mice that were labeled with EGFP (i.e., AT1aR-EGFP) ranged in size from 10 – 20 μm. Single lightly labeled (Fig. 2A), single darkly labeled (Fig. 2B) or clusters of darkly labeled cells (Fig. 2C) were seen in regionally specific distributions. No GFP immunoreactive cells were seen in the brains of non-transgenic littermates that were processed simultaneously with the brains of Agtr1a BAC transgenic mice (Fig. 2A’, B’ and C’). The regional distributions and morphology of AT1aR-EGFP containing cells appeared similar in male and female mice. Quantitative analysis revealed that the number of AT1aR-EGFP cells in male and female Agtr1a BAC transgenic mice in select brain regions was not significantly different (Table 1).
Fig. 2. Examples of AT1aR-EGFP cells in the brains Agtr1a BAC transgenic mice.
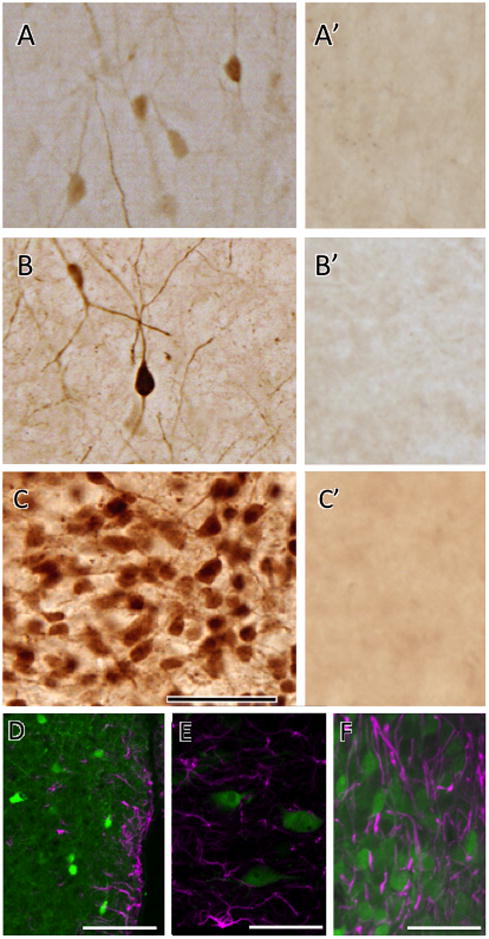
A-C. As shown in these examples from fixed tissue sections, GFP peroxidase reaction product is visible in light, dark and clusters of cells. A. Light cells and processes were found in several areas of the brain and they are designated with the open circle symbol (○) in Figure 5. B. Darker and more prominently marked cells were found alongside light cells and these are identified by the solid circle symbol (●) in Figure 5. C. Clusters of cells in which both light and dark cells where found conglomerated are denoted by the asterisk symbol (*) in Figure 5. A, cerebral cortex; B, endopiriform nucleus; C, PVN of hypothalamus. A’, B’ and C’. Corresponding brain regions to those shown in A, B and C from a non-Agtr1a BAC littermate control processed for GFP immunolabeling. Note the absence of labeled cells. D, E & F. As shown in these examples from the PVN (D), NTS (E) and SFO (F), AT1aR-EGFP cells (green) overlapped, but did not colocalize, with GFAP-immunoreactive cells (magenta). Bars A-C 50 μm; D, 40μm; E & F 20 μm.
Table 1.
Comparison of number of AT1-EGFP cells in select brain regions
| Brain region with map reference | Male (N = 3) | Female (N = 3) |
|---|---|---|
| Dorsal Caudate (Fig. 4C) | 38.2 ±3.8 | 31.2 ±3.7 |
| Subfornical Organ (Fig. 4A, B] | 45.8 ±3.8 | 48.5 ±3.6 |
| Hypothalamic PVN (Fig. 5A] | 40.8 ±6.3 | 52.0 ±5.2 |
| Locus Coeruleus (Fig. 6A) | 36.0 ±7.3 | 55.8 ±4.2 |
| Nucleus of the Solitary tract (Fig. 7A} | 28.5 ±3.0 | 33.6 ±5.0 |
| RVLM (Fig. 8A) | 6.8 ±0.7 | 5.2 ± 0.8 |
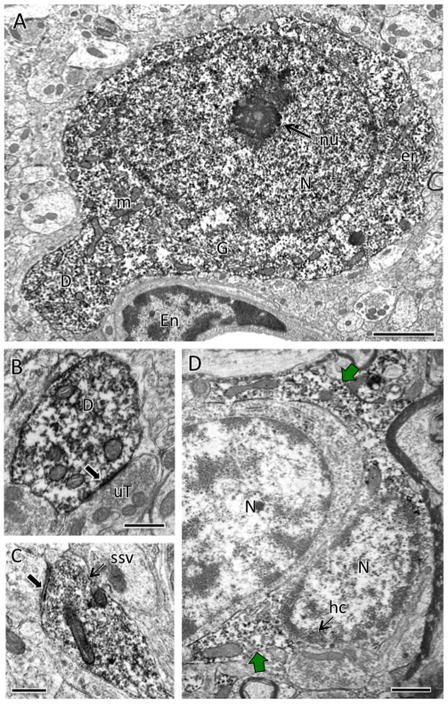
By light microscopy, AT1aR-GFP cells had the morphological characteristics of neurons (Cajal, 1995). In particular, AT1aR-EGFP reaction product filled dendritic processes that allowed for the distinction of bipolar and multipolar shapes in many brain regions (Fig. 2B). To determine if any of the cells were astrocytes, two experiments were performed. First, sections through the rostrocaudal extent of the brains of Atg1a BAC mice were dually labeled with GFP and GFAP and examined by confocal microscopy. In all regions, AT1aR-EGFP cells did not contain detectable GFAP immunoreactivity (see examples in Fig. 2D-F). Second, the morphology of the AT1aR-GFP cells was examined ultrastructurally in four brain regions known to be important in autonomic regulation (Allen et al., 2000). Almost all AT1aR-GFP cells were neurons in the four brain regions examined (Fig. 3; Table 2). Specifically, EGFP-labeled cells: 1) had a nucleus with a nucleolus; 2) had abundant cytoplasm with Golgi, endoplasmic reticulum and mitochondria and lacked fibrils; and 3) had dendrites that were contacted by terminals (Fig. 3A, B). Additionally, EGFP-labeling was found in terminals (Fig. 3C). However, an occasional EGFP-labeled glial cell was seen in the PVN, NTS and RVLM (Fig. 3D; Table 2). In all cases, the glial cell was classified as an astrocyte.
Fig. 3. Examples of electron microscopic immunoperoxidase localization of AT1aR-EGFP.
A. AT1aR-EGFP is found almost exclusively in neurons. The nucleus (N) of this neuron contains a nucleolus (nu). The cytoplasm contains numerous mitochondria (m), endoplasmic reticulum (er) and a Golgi apparatus (G). A dendrite (D) emanates from the soma. The neuronal somata is adjacent to the endothelial cell (En) or a blood vessel. B. GFP-ir fills a dendrite (D) that is contacted (arrow) by an unlabeled terminal (uT). C. GFP-ir is found in a terminal, identified by the presence of small synaptic vesicles (ssv; example), that forms a synapse (arrow) on an unlabeled dendrite. D. In rare instances, GFP-ir is detected in astrocytes. The nuclei of these two astrocytes contain heterochromatin (hc). The astrocyte on the right also contains GFP reaction product (green arrows) in the cytoplasm. Note that the astrocytic processes conform to the boundaries of the neuropil. A, PVN; B & C; NTS, D, RVLM. Bar A, 2 μm; B & C, 500 nm; D, 1 μm
Table 2.
Ultrastructural morphology of At1aR-GFP cells
| GFP neurons | GFP glia | Percent neurons | |
|---|---|---|---|
| SFO | 103 | 0 | 100% |
| PVN | 104 | 1 | 99% |
| RVLM | 14 | 1 | 93% |
| NTS | 27 | 1 | 96% |
Total cells from 3 male Agtr1a BAC mice.
Analysis of isolated EGFP cells in the Agtr1a (AT1aR) BAC transgenic mouse brain
To determine if Agtr1a BAC transgenic mice brains were suitable for in vitro studies, we examined ROS production (Wang et al., 2006b) in isolated EGFP labeled cells. We chose the PVN of the hypothalamus to sample since this region has an abundance of AT1R containing cells (Hauser et al., 1998; Lenkei et al., 1997). Prominent EGFP labeling in 300 μm slices though the PVN was seen prior to dissociating the cells (not shown). We found that isolated EGFP-containing cells from the PVN of male Agtr1a BAC transgenic mice maintained intense native EGFP labeling (Fig. 4A). In the presence of vehicle, DHE fluorescence was clearly distinguishable from native EGFP (Fig. 4B). Following application of AngII (100nM), ROS production increased in EGFP-containing cells (Fig. 4C, D). This increase was blocked by preapplication of losartan (3 mM) (Fig. 4D). These findings are consistent with previous studies (Wang et al., 2008; Zimmerman et al., 2004) and demonstrate the utility of the AT1aR BAC transgenic mice in cell and molecular signaling studies.
Fig. 4. Effect of AngII on ROS production in isolated AT1aR-EGFP cells.
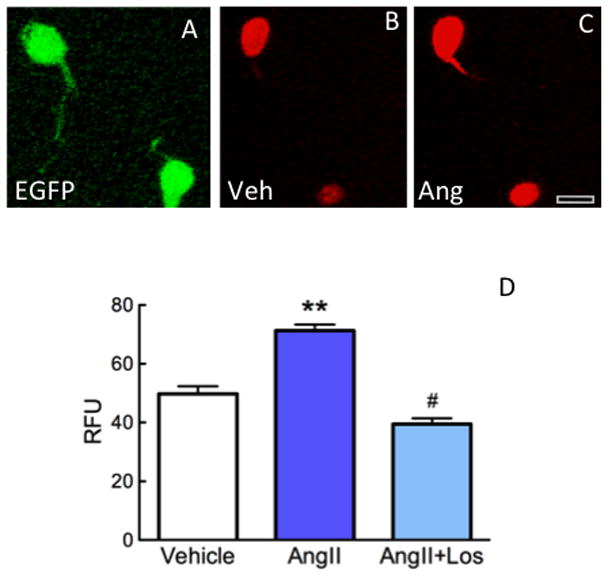
A. When viewed with fluorescence microscopy, native EGFP is visible in isolated cells. B. In the presence of vehicle, DHE reaction product (pseudocolored red) is visible in the EGFP containing cells shown in A. C. Following the addition of AngII (100nM), the intensity of DHE increases in the EGFP cells. Bar, 12 μm D. AngII increases ROS production in the EGP cells, an effect blocked by the receptor antagonist losartan (Los; 3 mm). ** p < 0.01 from vehicle; # p < 0.05 from AngII. n = 8 cells/group from 3 animals.
Distribution of EGFP cells in the Agtr1a BAC transgenic mouse brain
We next determined the distribution of EGFP containing cells in Agtr1a BAC transgenic mice brains to compare this distribution with that shown previously for AT1 receptor binding, protein and mRNA in the brains of rats and mice (Hauser et al., 1998; Lenkei et al., 1997; Rowe et al., 1990). For the anatomical studies presented below, EGFP was localized in Agtr1a BAC transgenic mice using immunoperoxidase methods to increase the signal and cellular resolution of EGFP as well as yield a permanent reaction product that was visible using the light microscope. The distribution pattern of EGFP cells was identical in females and males. The cell distributions presented in the maps in Figure 5, are a composite made from examining the brains of 3 female (two in diestrus and one estrus) and 3 male Agtr1a BAC transgenic mice. The maps present relative qualitative comparisons of the numbers of cells in different brain regions.
Forebrain
AT1aR-EGFP cells were found in the tenia tecta, particularly in the ventral region (Fig. 5A.). A few scattered AT1aR-EGFP cells were found near the lateral olfactory tract (Fig. 5A), the claustrum and the endopiriform and piriform cortexes (Fig. 4B-D).
The basal forebrain nuclei contained numerous AT1aR-EGFP cells. A significant number of AT1aR-EGFP cells were found in the entire rostrocaudal extent of the dorsal and intermediate portions of the lateral septal nuclei (Figs. 5B,C). Some AT1aR-EGFP cells also were distributed throughout the medial septum and diagonal band of Broca (Fig. 5B). AT1aR-EGFP cells were found scattered throughout the nucleus accumbens (Figs. 5B), all subdivisions of the bed nucleus of the stria terminalis (Fig. 5C) and substantia innominata (Fig. 4C). Intense AT1aR-EGFP labeling also was seen in median preoptic area (Fig. 5C) and in the organum vasculosum of the lamina terminalis (OVLT; not shown).
Dense clusters of AT1aR-EGFP cells were seen in the caudate-putamen, particularly in the dorsolateral aspects (Figs. 5B,C; 6C). Numerous, intensely labeled AT1aR-EGFP cells were seen in the both the dorsolateral outer shell and ventromedial core of the SFO (Figs. 5D, 6A,B). Consistent with AT1 receptor mRNA and binding studies (Allen et al., 2000), dense EGFP labeling also was found in the choroid plexus below the fimbria/fornix (Fig. 6A).
Fig. 6. Distribution of AT1aR-EGFP labeling in select forebrain regions.
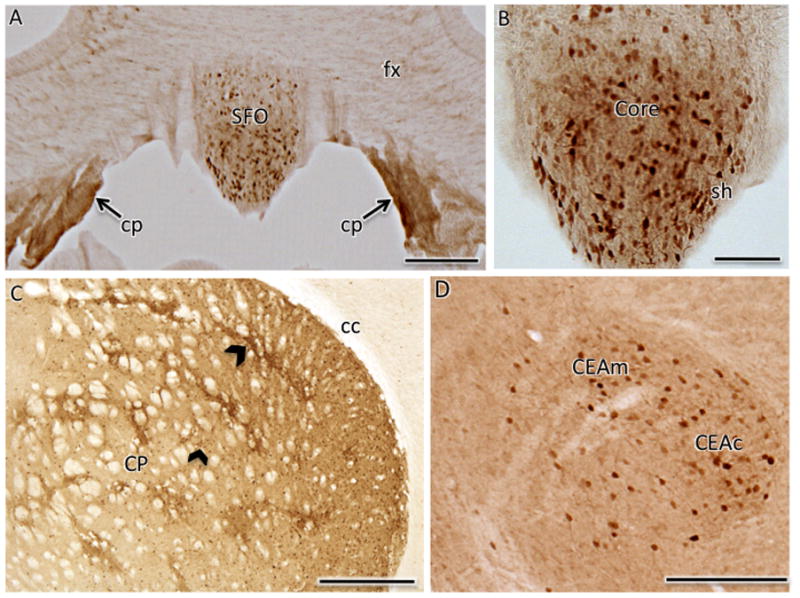
A. Numerous AT1aR-EGFP cells are found in the SFO. Moreover, dense labeling for AT1aR-EGFP is found in the choroid plexus (cp) located below the fornix (fx). B. At higher magnification, many dark AT1aR-EGFP cells were found in both the core and shell (sh) of the SFO. C. Numerous clusters of AT1aR-EGFP cells (examples black chevrons) are found in the caudate-putamen (CP), especially in the dorsolateral quadrant. cc, corpus callosum D. Dispersed light and dark AT1aR-EGFP cells were seen in both the central and medial regions of part of the central nucleus of the amygdala (CEAc and CEAm, respectively). Bars A, D, 100 μm; B, 50μm; C, 500μm.
Thalamus, amygdala and hypothalamus
Only a few regions in the thalamus contained AT1aR-EGFP cells. In the rostral regions of the thalamus, scattered lightly labeled AT1aR-EGFP cells were found in the lateral habenula, reticular thalamic nucleus (Fig. 5D) as well as the parafascicular nucleus of the thalamus and neighboring areas (Fig. 5E). More caudally, intergeniculate leaflet (Fig. 5F) and the ventral subregion of the medial geniculate nucleus (Fig. 5G) contained small clusters of AT1aR-EGFP cells. In addition, a few scattered AT1-EGFP cells were observed in the substantia nigra, especially the pars reticulata (Fig. 5F,G).
AT1aR-EGFP cells were detected in many of the nuclei within the amygdala complex. Numerous AT1aR-EGFP cells were in the basolateral (Fig. 5D) and central nuclei, especially the medial and central parts of the central nucleus (Figs. 45D; 5D). A few scatted AT1aR-EGFP cells were found in the anterior amygydoid area and basal medial nucleus of the amygdala (Fig. 5D) as well as the posterior lateral and medial cortical nuclei of the amygdala (Fig. 5E, F).
In the hypothalamus, AT1aR-EGFP cells were densely packed in the PVN (Figs. 5D; 7A). To elucidate the location of EGFP cells within PVN subregions, sections through the PVN were dually labeled with AVP, a marker of magnocellular neurons (Coleman et al., 2009). Most AT1aR-EGFP cells were intermixed, but not colocalized, with AVP-labeled neurons suggesting that most AT1aR-EGFP cells are parvicellular neurons (Fig. 7B-D). Several AT1aR-EGFP cells were detected in the arcuate nucleus, dorsomedial and ventromedial hypothalamic nuclei and the periventricular nucleus of the hypothalamus (Fig. 5D) and interfascicular nucleus (Fig. 5G). Intensely labeled AT1aR-EGFP processes were seen in the median eminence (not shown). Lightly labeled AT1aR-EGFP cells were found in the suprachiasmatic nucleus (not shown), the caudal supraoptic nucleus and dorsal region of the periaqueductal gray area (Fig. 5H). A few scattered AT1aR-EGFP cells were observed in the medial preoptic area, the anterior hypothalamic nucleus, lateral hypothalamic area (Fig. 5C, D) and the medial and lateral tuberal nucleus (not shown). The medial regions of the supramammilary and mammilary nuclei contained several AT1aR-EGFP cells (Fig. 5F).
Fig. 7. Distribution of AT1aR-EGFP cells in the PVN of the hypothalamus.
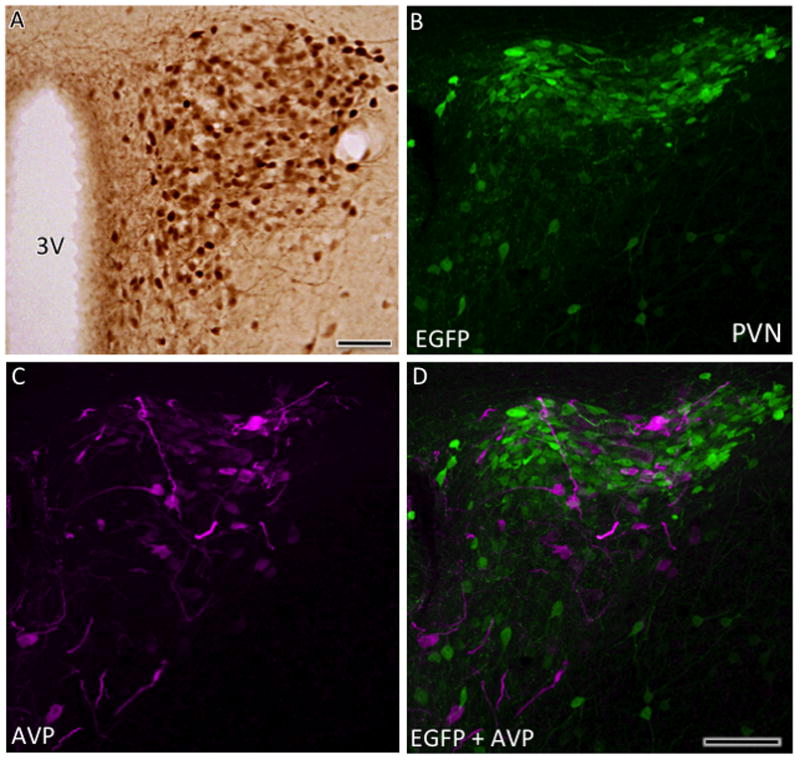
A. Numerous dark AT1aR-EGFP containing cells are found throughout the PVN. With confocal microscopy, cells containing AT1aR-EGFP (B) and AVP-ir (C) overlap (merged image D), but are distinct populations, in the PVN. Bar A-D, 50 μm.
Cerebral and cerebellar cortices and hippocampus
A significant number of lightly labeled AT1aR-EGFP cells were found throughout the rostrocaudal extent of all subdivisions of the cerebral cortex. Most of the AT1aR-EGFP cells were located in layers 5 and 6; some cells were scattered throughout the other layers (Fig. 5A-H). In the motor cortex, the AT1aR-EGFP cells tended to be organized in columns (Fig. 5B-D). Many small AT1aR-EGFP cells were detected in the principal cell layers of the anterior cingulate and retrosplenial cortices, especially the ventral aspects (Fig. 5B, E).
AT1aR-EGFP cells were dispersed throughout the hippocampal formation, however, the density of labeled cells varied by subregion. Dorsally, scattered lightly labeled AT1aR-EGFP cells were found in stratum radiatum of CA1 and CA3 and in the molecular layer and hilus of the dentate gyrus (Fig. 5E-G). Ventrally, dense clusters of more intensely labeled AT1aR-EGFP cells were seen in the hilus of the dentate gyrus (Fig. 5F,G). Based on location and morphology, the few AT1aR-EGFP cells observed in the hippocampus were likely interneurons (Freund and Buzsáki, 1996). AT1aR-EGFP cells were sparsely distributed in layer 5 and 6 of the entorhinal cortex in a manner similar to that described above for the cerebral cortex.
In the cerebellum, a few lightly labeled AT1aR-EGFP cells were detected in the simple lobule (Fig. 5I) and the central lobe (Fig. 5J).
Pons and medulla
Within the pons, a few lightly labeled AT1aR-EGFP cells were detected in the rostrocaudal extent of the raphe nuclei, especially the dorsal subgroup (Fig. 5H). Scattered AT1aR-EGFP cells were located in the principal sensory nucleus of the trigeminal nerve (Fig. 5H), the midline region of the periaqueductal gray and gigantocellular reticular nucleus (Fig. 5I). More caudally, numerous AT1aR-EGFP cells were detected in all subregions of the lateral and medial parabrachial nucleus and the locus coeruleus (Figs. 5H,I; 8A). Dual labeling studies demonstrated that almost all AT1aR-EGFP cells in the locus coeruleus contained TH-ir (Fig. 8B-D). Several AT1aR-EGFP cells were noted in the Kölliker-Fuse nucleus, the dorsal tegmental nucleus, the ventral portion of the principal sensory nucleus of the trigeminal nerve, the gigantocellular reticular nucleus, the lateral paragigantocellular reticular nucleus and intermediate reticular nucleus (Fig. 5I).
Fig. 8. Distribution of AT1aR-EGFP in the dorsal pons.
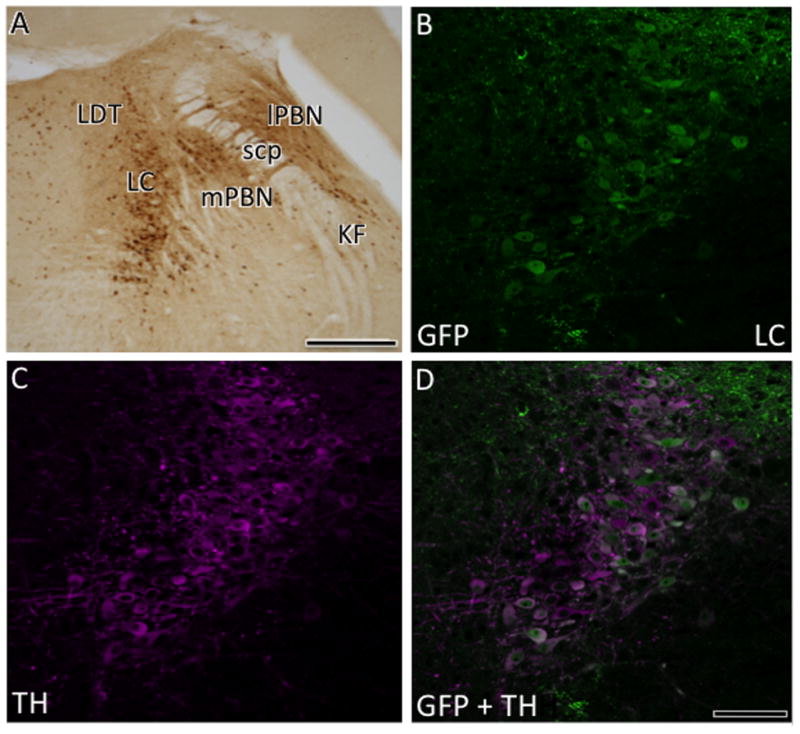
A. At low magnification, numerous dark AT1aR-EGFP cells are found in the locus coeruleus (LC), lateral and medial parabrachial nucleus (lPBN and mPBN, respectively) and interspersed in the Kölliker-fuse nucleus and lateral dorsal tegmental nucleus (LDT). With confocal microscopy, AT1aR-EGFP (B) and TH-ir (C) are colocalized (merged image D) in the locus coeruleus. Bar A, 300 μm; B-D, 50μm.
In the medulla, lightly labeled AT1aR-EGFP containing cells continued to be found in the raphe nuclei, especially the magnus and pallidus subdivisions (Fig. 5I,J). Numerous AT1aR-EGFP cells were detected in the NTS, especially in the medial and commissural subdivisions (Figs. 5J, K; 9A). Several AT1aR-EGFP immunoreactive processes and a few lightly labeled cells also were seen in the area postrema (Fig. 5K). Within the RVLM, many dark AT1aR-EGFP cells were detected (Figs. 5J; 10A). Consistent with our previous immunocytochemical studies (Glass et al., 2005; Pierce et al., 2009; Wang et al., 2008), additional dual label confocal studies revealed that almost all AT1aR-EGFP cells contained TH-ir in the NTS (Fig. 9B-D) and RVLM (Fig. 10B-D). Scattered dark and light AT1-EGFP cells were found in the region spanning between the NTS and RVLM; this region includes the nucleus prepositus, intermediate and medullary reticular nucleus and external cuneate nucleus (Fig. 5J,K). Several AT1aR-EGFP cells were present in both the interpolar and caudal parts of the spinal nucleus of the trigeminal nerve, especially medial to the spinal trigeminal tract (Fig. 5J).
Fig. 9. Distribution of AT1aR-EGFP cells in the area postrema and NTS.
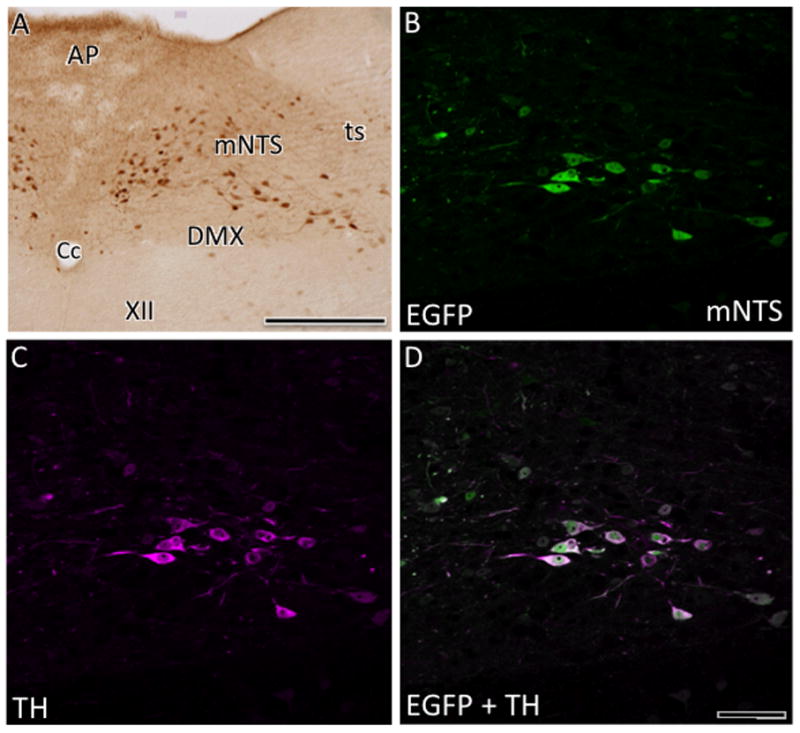
A. Numerous AT1aR-EGFP cells are detected in the medial NTS (mNTS). Some light AT1aR-EGFP also is detected in the area postrema (AP). Cc, central canal; DMX, dorsal motor nucleus of vagus; ts, tractus solitarius. With confocal microscopy, AT1aR-EGFP (B) and TH-ir (C) are colocalized (merged image D) in the mNTS. Bar A, 100μm; B-D, 25 μm.
Fig. 10. Distribution of AT1aR-EGFP cells in the RVLM.
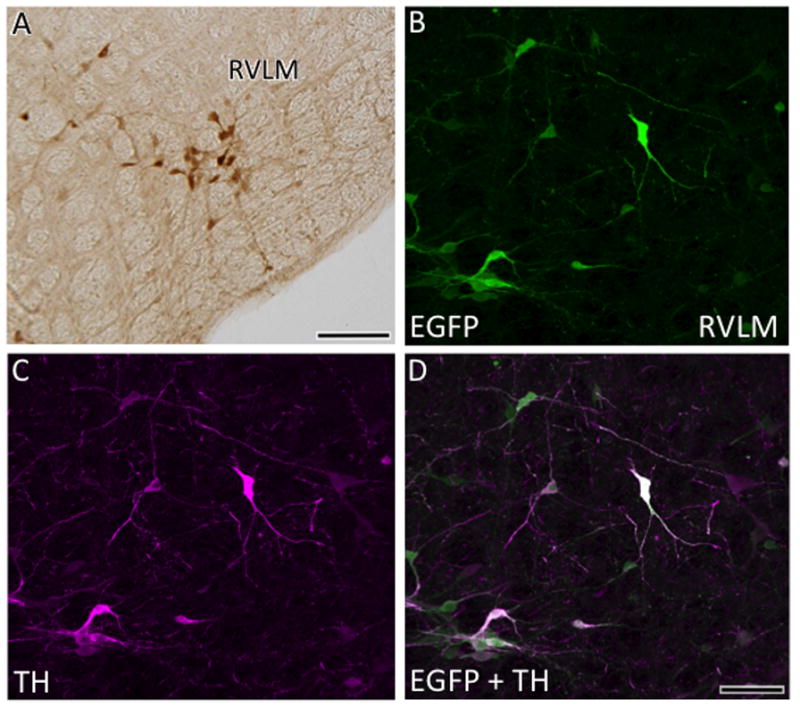
A. Several AT1aR-EGFP cells are found in the RVLM . With confocal microscopy, AT1aR-EGFP (B) and TH-ir (C) are colocalized (merged image D) in the RVLM. Bar A, 25μm; B-D, 25 μm.
EGFP cells in the Agtr1a BAC reporter mouse contain AT1R-immunoreactivity
Next, we confirmed the fidelity of EGFP in the Agtr1a BAC transgenic mouse by electron microscopic analysis of sections of tissue processed for dual labeling of GFP using silver-intensified gold (SIG) and AT1R using immunoperoxidase The dual labeled somata had the morphology of neurons (Peters et al., 1991) in all brain regions examined, which included the PVN, central nucleus of the amygdala, and medullary nuclei involved in autonomic regulation.
SFO
Numerous perikarya and dendrites contained immunoreactivities for both AT1aR-EGFP and AT1R (Fig. 11A-C). AT1aR-EGFP SIG particles were distributed throughout the cytoplasm and nuclei, whereas AT1R-ir was found exclusively within the cytoplasm where it was sometimes affiliated with mitochondria or the plasma membrane (Fig. 11B).
Fig. 11. Electron microscopic localization of AT1aR-EGFP and AT1R-ir in the SFO.
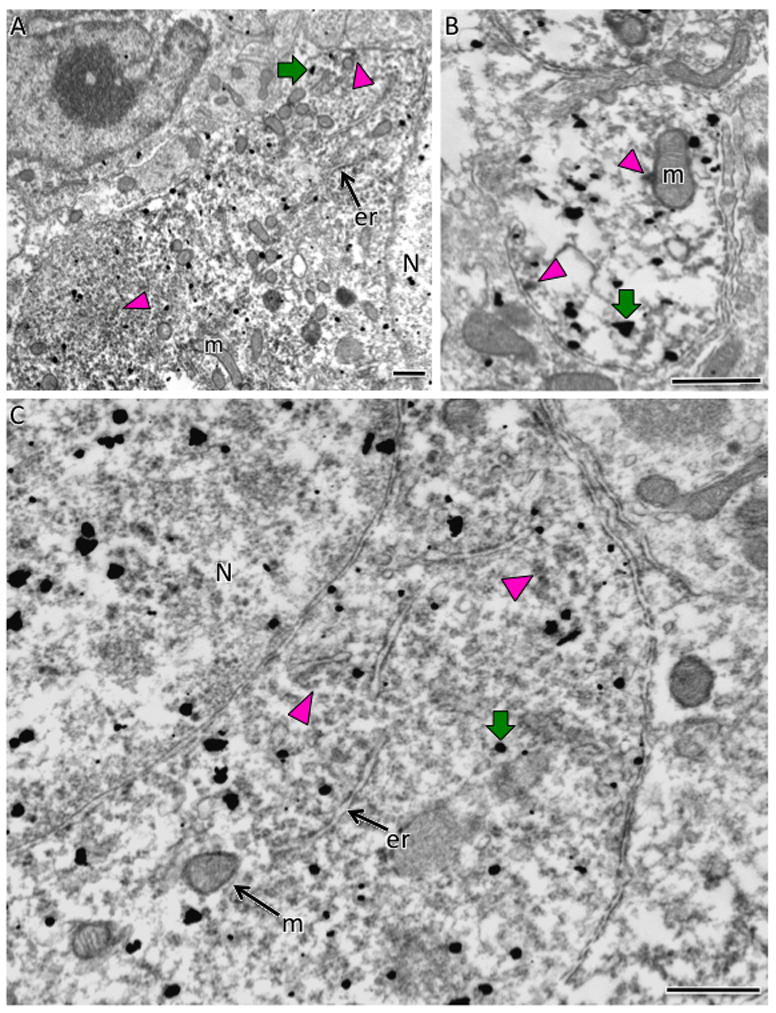
A. At low magnification, AT1aR-EGFP SIG particles (black dots; example green arrow) are found dispersed throughout the nucleus (N) and cytoplasm of a neuronal perikaryon whereas diffuse patches of AT1R-ir appear interspersed in the cytoplasm (examples green arrowheads). B. In a dendritic profile, AT1aR-EGFP SIG particles (example green arrow) are found throughout the cytoplasm whereas patches of AT1R-ir are associated with the mitochondria (m; top magenta arrowhead) or plasma membrane (bottom magenta arrowhead). C. At high magnification, diffuse peroxidase reaction product for AT1R-ir is found throughout the AT1aR-EGFP somata (black dots; example magenta arrow). er, endoplasmic reticula. Bars, 500 nm.
PVN
Several perikarya and dendrites also contained SIG for AT1aR-EGFP in the PVN. Unlike the SFO, the majority of processes dually labeled for AT1aR-EGFP and AT1R-ir were dendrites in this brain region (Fig. 12A,B). Like the SFO, AT1R immunoperoxidase labeling was found in patches within the cytoplasm where it was sometimes affiliated the plasma membrane (Fig. 11A) and endoplasmic reticulum (Fig. 12B).
Fig. 12. Electron microscopic localization of AT1aR-EGFP and AT1R-ir in dendrites in the PVN.
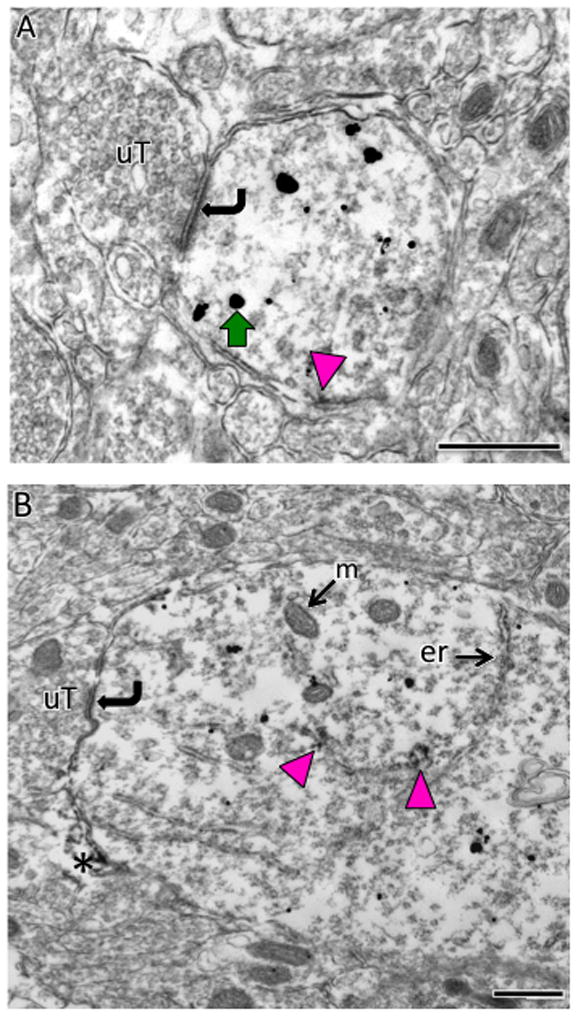
A & B. SIG labeling for AT1aR-EGFP (black dots; example green arrow) is found throughout the cytoplasm of small (A) and large (B) dendritic profiles which are contacted (curved arrows) by unlabeled terminals (uT). Peroxidase labeling for AT1R-ir is patchy and affiliated with the plasma membrane (magenta arrow in A) or the endoplasmic reticula (er; magenta arrows in B). Occasionally, peroxidase AT1R-ir is seen in glial processes (asterisk in B). Bars, 500 nm.
Central nucleus of the amygdala
AT1aR-EGFP and AT1R-ir were colocalized in numerous perikarya and dendritic processes within the central nucleus of the amygdala (Fig. 13A,B). As in other brain regions, AT1aR-EGFP SIG particles were seen in the nucleus and cytoplasm whereas the AT1R-ir was partitioned to the cytoplasm of perikarya and dendrites in the central amygdala. In the cytoplasm, AT1R-ir was seen often in clusters.
Fig. 13. Electron microscopic localization of AT1aR-EGFP and AT1R-ir in the central nucleus of the amygdala.
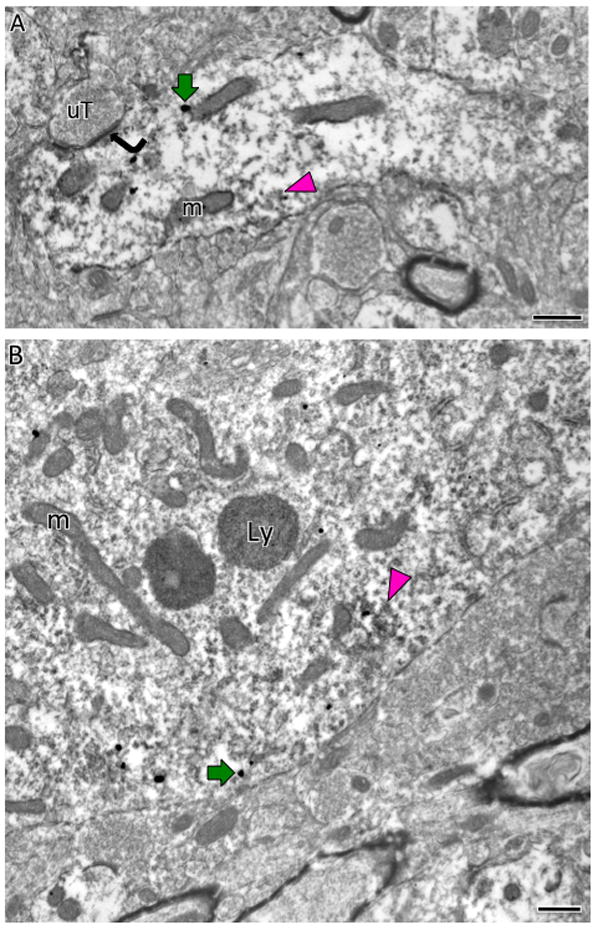
AT1aR-EGFP SIG particles (black dots; example, magenta arrows) are found in the cytoplasm of a dendrite (A) and somata (B) whereas AT1R-immunoperoxidase is more diffusely distributed throughout each profile. Occasionally, peroxidase AT1R-ir is found in patches (magenta arrowheads). An unlabeled terminal (uT) contacts (curved arrow) the dual labeled dendrite in A. Ly, lysosome; m, mitochondria Bars, 500 nm.
Medulla
AT1aR-EGFP and AT1R-immunoreactivity were found occasionally in a single axon terminal contacting and unlabeled dendrite or dendritic spines in the area postrema, a brainstem circumventricular organ having similarity to the SFO in having direct access to circulating AngII (Lenkei et al., 1997) (Fig. 14A). In these axon terminals the AT1R-ir was often affiliated with the plasma membrane.
Fig. 14. Electron microscopic localization of AT1aR-EGFP and AT1R-ir in medulla.
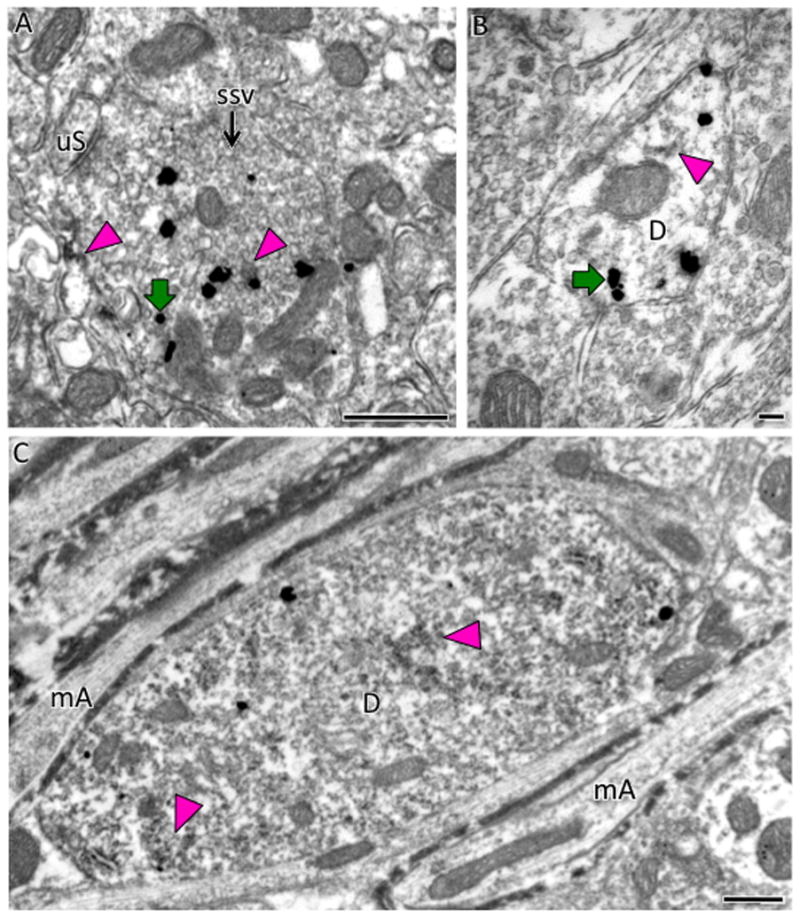
A. In the area postrema, AT1aR-EGFP SIG particles (example, green arrow) are found in a terminal, identified by the presence of small, synaptic vesicles (ssv), which also contains patches of peroxidase reaction product indicative of AT1R-ir (magenta arrowheads). B. In the medial NTS, sparse peroxidase immunoreactivity for AT1R (magenta arrowhead) is found in an AT1aR-EGFP dendrite identified by SIG particles (example, green arrow). C. In the RVLM, diffuse peroxidase AT1R-ir is found in a dendritic profile with AT1aR-EGFP SIG particles (example Pink arrow). mA, myelinated axons. Bars, 500 nm.
In the NTS and RVLM, AT1aR-EGFP SIG particles were found throughout the nucleus and cytoplasm of perikarya and dendrites; some of these dendrites contained immunoreactivity for AT1R (Fig. 14B, C). AT1R-ir in dendrites was found in clusters throughout the cytoplasm (Fig. 14C). Thus, the subcellular distribution of AT1aR-GFP and AT1R in these regions are similar to those in other brain regions including the circumventricular organs.
DISCUSSION
The present study provides evidence supporting the fidelity of the Agtr1a BAC transgenic reporter mice. EGFP containing cells in these mice are predominantly neurons that have a topographic distribution throughout the brain that is similar to that reported previously for AT1R mRNA, protein and binding. Dual label electron microscopic studies demonstrate that AT1R-ir colocalizes with AT1aR-EGFP in neurons in several brain regions. Furthermore, assessment of AngII-induced free radical production in isolated EGFP cells demonstrated feasibility of studies investigating AT1aR signaling ex vivo. The versatility and greater sensitivity of EGFP for detecting AT1R-containing cells in the Agtr1a BAC transgenic mouse will provide a useful tool for future anatomical, physiological and molecular experiments.
Methodological considerations
These studies support the feasibility of using Agtr1a BAC transgenic mice in anatomical as well as in vitro physiological studies. First, in 300 μm slices and isolated cell preparations, native EGFP fluorescence was visible at the light level in soma and proximal processes allowing for easy identification. Moreover, the green signal of native EGFP was clearly distinguished from the DHE reaction product (pseudo colored red) that changed in intensity after application of AngII in the presence or absence of the losartan. Thus, these observations support the utility of the Agtr1a BAC mouse for patch-clamp physiological experiments as well as ROS measurements in isolated cell preparations. Second, consistent with previous studies of GFP in other brain regions (Bulloch et al., 2008; Justice et al., 2008; Lazarenko et al., 2009; Milner et al., 2010; Sierra et al., 2008), immunoperoxidase reaction product for EGFP was found throughout dendritic processes when viewed by electron microscopy. Moreover, AT1aR-EGFP SIG labeling for EGFP was clearly distinguished from the peroxidase reaction product for AT1R in single sections prepared for electron microscopy. These findings support the technical feasibility of dual label ultrastructural studies, particularly those that make quantitative comparisons between groups of particular receptors (e.g., NMDA) or signaling molecules in EGFP-containing cells. Third, EGFP immunoreaction product can be detected in paraformaldehyde-fixed tissue with or without acrolein and in the presence or absence of detergent allowing AT1aR-EGFP cells to be identified under a greater variety of experimental conditions. Fourth, AT1aR-EGFP can be immunolabeled with a chicken or rabbit anti-GFP. This substantially increases the versatility of dual (and even triple) light and electron microscopic studies since the GFP antiserum can be combined with antisera against a many other antigens produced in a variety of species to be subsequently identified with peroxidase, fluorescence, or immunogold labels.
Morphology of AT1aR-EGFP cells
In agreement with recent studies (Chen et al., 2012), nearly all of the cells containing AT1aR-EGFP labeling had the morphology of neurons when viewed by light and electron microscopy. Moreover, the lack of detectable GFP labeling in GFAP-containing astrocytes and the strong colocalization of GFP with TH in the locus coeruleus, RVLM and NTS further demonstrate that AT1aR-EGFP is almost exclusively in neurons. However, our high-resolution electron microscopic studies revealed AT1aR-EGFP rarely labeled astrocytes in some brain regions. These findings are in agreement with previous light microscopic studies showing a lack of colocalization of AT1R mRNA with GFAP (Lenkei et al., 1997) and our previous electron microscopic studies showing low-levels of AT1R-ir (using the same antibody used in the present study) in glial processes in the rat NTS and RVLM (Glass et al., 2005; Huang et al., 2003; Pierce et al., 2009). Moreover, they also support previous in vitro findings that the expression of AT1Rs in astrocytes and microglia is negligible under basal conditions (Miyoshi et al., 2008; O'Callaghan et al., 2011; Wosik et al., 2007). However, several studies have shown that AT1R expression is variable depending on experimental conditions. In rat primary astrocyte cultures, growth hormone can increase AT1R levels (Wyse and Sernia, 1997). Low levels of AT1R mRNA are detected in astrocytes from both Wistar-Kyoto and spontaneously hypertensive rats in basal conditions (Zelezna et al., 1992). Moreover, overexpression of AT1ARs in the RVLM using adenovirus transgene increases glial expression of AT1AR that in turn can increase blood pressure possibly by modulating endogenous AT1Rs in presympathetic neurons (Allen et al., 2006). Whether or not experimental conditions like changes in the hormonal milieu or hypertension alter the numbers of glial cells containing AT1aR-EGFP is a subject of future investigations.
The detection of AT1aR-EGFP primarily in neurons also could be due to species and/or methodological differences. Our previous electron microscopic studies localizing AT1R immunoreactivity in NTS and RVLM were performed in rats (Glass et al., 2005; Huang et al., 2003; Pierce et al., 2009); thus, it is possible that more glia in rats contain AT1R compared to mouse. Moreover, the AT1R antibody used in these studies was raised against a peptide from the rat AT1AR (Huang et al., 2003). Since the rat sequence of the AT1A receptor peptide chosen to make the antibody differs from the mouse by one amino acid and has another amino acid difference after the final cysteine (FEVE vs SEVE), this could have affected antigenicity.
AT1aR-EGFP also was found in the choroid plexus, a region enriched in microvasculature (Scala et al., 2011). Although we did not examine the choroid plexus ultrastructurally, these findings support previous studies showing that AT1R-ir is located in endothelial cells in the cerebral cortex and NTS (Huang et al., 2003; Kazama et al., 2004).
The distribution of AT1aR-EGFP is consistent with immunocytochemical, in situ hybridization and binding studies
The present study found the distribution of cells containing EGFP in the Agtr1a BAC transgenic mouse to be consistent with previous reports from immunocytochemistry, in situ hybridization and AngII binding studies (Aldred et al., 1993; Allen et al., 2000; Hauser et al., 1998; Lenkei et al., 1997; Rowe et al., 1990; Tsutsumi and Saavedra, 1991), with some minor variations. Our electron microscopic studies showing AT1R immunoreactivity in EGFP containing cells in many brain regions further support the fidelity of the Agtr1a BAC transgenic mice. The topographic distribution of AT1aR-EGFP containing cells was similar in males and females, although with a larger sample size it is possible that some differences in the number of cells (e.g., the locus coeruleus) could attain statistical significance. Since EGFP labeling does not provide information as to the subcellular localization of AT1ARs, these findings do not contradict our previous electron microscopic studies (Wang et al., 2008; Pierce et al., 2009) showing sex differences in the levels and subcellular distribution levels of AT1R-ir in TH- containing dendrites in the RVLM.
In both female and male Agtr1a BAC transgenic mice more AT1aR-EGFP cells were found in the cerebral cortex and hippocampal formation, compared to previous immunocytochemical, in situ hybridization, and binding studies in mice and rats (Hauser et al., 1998; Lenkei et al., 1997; Rowe et al., 1990). However, the pattern of distribution within these regions was relatively consistent with previous reports (Allen et al., 2000; Lenkei et al., 1995b; Lenkei et al., 1997). This suggests that differences in the frequency of labeled cells might reflect differences in the relative sensitivities of the methods. In particular, since the Agtr1a BAC transgenic reporter mouse is created by inserting an EGFP cassette directly upstream of the coding sequence of AT1AR, EGFP may be more able to identify cells that contain low amounts of mRNA and/or protein (Gong et al., 2003). Alternatively, differences in the frequency of labeled AT1AR, EGFP cells might reflect differences in pattern of immunostaining seen with various AT1AR antibodies.
In agreement with studies in both mice and rats (Allen et al., 2000; Hauser et al., 1998; Lenkei et al., 1997), AT1aR-EGFP cells were noticeably absent in many of the thalamic and pontine nuclei. Consistent with studies in C57BL/6J mice (Daubert et al., 1999; Hauser et al., 1998), we found numerous AT1aR-EGFP cells in the caudate-putamen. Interestingly, these findings contrast with previous studies in rats (Gehlert et al., 1991; Lenkei et al., 1995a; Rowe et al., 1990; Tsutsumi and Saavedra, 1991) suggesting that there are some species differences.
Functional implications
The topographical pattern of AT1aR-EGFP cells observed in this study directly reflects the well-established distribution of AT1R sensitive cells involved in circuits regulating both fluid homeostasis and cardiovascular function. Notably, high numbers of AT1aR-EGFP cells were found in some circumventricular organs, such as the SFO and the OVLT, and more moderate numbers in others, such as the median eminence and area postrema. These structures, which lack a blood-brain barrier, can sense and respond to circulating levels of AngII.
AT1aR-EGFP cells also are concentrated in regions involved in regulating cardiovascular reflexes, and autonomic function. A number of AT1aR-EGFP cells were found in the PVN which is involved in the integration of neural control of sympathetic outflow (Benarroch, 2005; de Wardener, 2001; Pyner and Coote, 1898; Sawchenko et al., 1996). AT1aR-EGFP cells were found in the parabrachial nucleus, NTS and the RVLM, all of which are involved in cardiovascular regulation (Aicher et al., 2000; Bourassa et al., 2009; Hayward, 2007).
AT1aR-EGFP containing cells also were not restricted to areas relating to cardiovascular and fluid control. In particular, AT1aR-EGFP cells were present in the hippocampal formation, the amygdala, septal nuclei and limbic cortices, such as entorhinal and piriform cortex that are important in learning, memory and anxiety. Studies have reported that AngII, acting through AT1Rs, can inhibit long term potentiation in both the hippocampal formation (Wayner et al., 1993) and amygdala (von Bohlen und and Albrecht, 1998). AT1aR-EGFP cells also were concentrated in the bed nucleus of the stria terminalis, the preoptic area, the raphe, locus coeruleus and, as discussed, the PVN. AT1R-containing cells in these regions, particularly the PVN and locus coeruleus, are involved in sympathetic and hormonal response to stress (Dumont et al., 1999; Saavedra et al., 2011). AT1aR-EGFP cells also were found in areas that modulate thermoregulation (e.g., the lateral parabrachial, medial preoptic area, raphe pallidus) (Morrison and Nakamura, 2011).
In conclusion, AT1aR EGFP containing cells can be detected by both light and electron microscopy as well as in isolated cells prepared for physiological and molecular studies. Thus, the availability of Agt1a BAC transgenic reporter mice presents a further opportunity to understand the involvement of cells containing AT1ARs in autonomic function as well as other important processes.
RESEARCH HIGHLIGHTS.
Agtr1a BAC transgenic mice express cells with angiotensin 1A receptors with fidelity.
In Agtr1a BAC transgenic mice, labeled cells are prominent in brain autonomic regions.
Labeled cells from these mice are suitable for anatomical and physiological studies.
Acknowledgments
GRANT SUPPORT: NIH grants HL098351, DA08259 & AG016765 (TAM), HL096571 (TAM, JPP & VMP), AG039850 (EMW & TAM), DA08259-S1 (KLG), T32 DA007274 (TAV), HL096571, HL063887 (RLD)
We thank Drs. Nathaniel Heinz and Laura Kus from the GENSAT project for supplying the Agt1aR BAC transgenic reporter mice and Mr. Parth Patel for technical assistance.
ABBREVIATIONS
- ABC
avidin biotin complex
- Ad
adenovirus
- AngII
angiotensin II
- AP
area postrema
- AT1aR
angiotensin receptor, type 1a
- AT1R
angiotensin receptor, type 1
- AT2R
angiotensin receptor, type 2
- AVP
arginine vasopressin
- BAC
bacterial artificial chromosome
- BSA
bovine serum albumin
- cc
corpus callosum
- Cc
central canal
- CEAc
central nucleus of the amygdala, central part
- CEAm
central nucleus of the amygdala, medial part
- CNS
central nervous system
- cp
choroid plexus
- CSF
cerebrospinal fluid
- CRF
corticotropin releasing factor
- D
dendrite
- DHE
dihydroethidium
- DMX
dorsal motor nucleus of vagus
- DTN
dorsal tegmental nucleus
- EGFP
enhanced green fluorescent protein
- er
endoplasmic reitculum
- fx
fornix
- GENSAT
Gene Expression Nervous System Atlas
- GFP
green fluorescent protein
- ir
immunoreactivity
- KF
Kölliker-fuse nucleus
- LC
locus coeruleus
- LDT
laterodorsal tegmental nucleus
- LOS
losartan
- Ly
lysosome
- m
mitochondria
- mA
myelinated axon
- mNTS
medial nucleus of the solitary tract
- N
Nucleus
- NTS
nucleus of the solitary tract
- OVLT
organum vasculosum of the laminar terminalis
- PB
phosphate buffer
- PBNl
parabrachial nucleus
- PBNm
parabrachial nucleus, medial part
- PVN
paraventricular nucleus of the hypothalamus
- ROS
reactive oxygen species
- scp
superior cerebellar peduncle
- SFO
subfornical organ
- sh
shell of subfornical organ
- SIG
silver intensified gold
- ssv
small synaptic vesicle
- RVLM
rostral ventrolateral medulla
- 3V
third ventricle
- TH
tyrosine hydroxylase
- ts
tractus solitarius
- TS
Tris saline
- uS
unlabeled dendritic spine
- uT
unlabeled terminal
- XII
hypoglossal nucleus
Footnotes
Publisher's Disclaimer: This is a PDF file of an unedited manuscript that has been accepted for publication. As a service to our customers we are providing this early version of the manuscript. The manuscript will undergo copyediting, typesetting, and review of the resulting proof before it is published in its final citable form. Please note that during the production process errors may be discovered which could affect the content, and all legal disclaimers that apply to the journal pertain.
LITERATURE REFERENCES
- Aicher SA, Milner TA, Pickel VM, Reis DJ. Anatomical substrates for baroreflex sympathoinhibition in the rat. Brain Res Bull. 2000;51:107–110. doi: 10.1016/s0361-9230(99)00233-6. [DOI] [PubMed] [Google Scholar]
- Aldred GP, Chai SY, Song K, Zhuo J, MacGregor DP, Mendelsohn FA. Distribution of angiotensin II receptor subtypes in the rabbit brain. Regul Pept. 1993;19;44:119–130. doi: 10.1016/0167-0115(93)90235-z. [DOI] [PubMed] [Google Scholar]
- Allen AM, Oldfield BJ, Giles ME, Paxinos G, McKinley MJ, Mendelsohn FAO. Localization of angiotensin receptors in the nervous system. In: Quiron R, Björklund A, Hökfelt T, editors. Handbook of Chemical Neuroanatomy, Vol. 16: Peptide Receptors, Part 1. Elsevier Science B.V; 2000. pp. 79–124. [Google Scholar]
- Belcheva I, Ternianov A, Georgiev V. Lateralized learning and memory effects of angiotensin II microinjected into the rat CA1 hippocampal area. Peptides. 2000;21:407–411. doi: 10.1016/s0196-9781(00)00163-7. [DOI] [PubMed] [Google Scholar]
- Benarroch EE. Paraventricular nucleus, stress response, and cardiovascular disease. Clin Auton Res. 2005;15:254–263. doi: 10.1007/s10286-005-0290-7. [DOI] [PubMed] [Google Scholar]
- Benicky J, Sanchez-Lemus E, Honda M, Pang T, Orecna M, Wang J, Leng Y, Chuang DM, Saavedra JM. Angiotensin II AT1 receptor blockade ameliorates brain inflammation. Neuropsychopharmacology. 2011;36:857–870. doi: 10.1038/npp.2010.225. [DOI] [PMC free article] [PubMed] [Google Scholar]
- Bourassa EA, Sved AF, Speth RC. Angiotensin modulation of rostral ventrolateral medulla (RVLM) in cardiovascular regulation. Mol Cell Endocrinol. 2009;302:167–175. doi: 10.1016/j.mce.2008.10.039. [DOI] [PMC free article] [PubMed] [Google Scholar]
- Bulloch K, Miller MM, Gal-Toth J, Milner TA, Gottfried-Blackmore A, Waters EM, Kaunzner UW, Liu K, Lindquist R, Nussenzweig MC, Steinman RM, McEwen BS. CD11c/EYFP transgene illuminates a discrete network of dendritic cells within the embryonic, neonatal, adult, and injured mouse brain. J Comp Neurol. 2008;508:687–710. doi: 10.1002/cne.21668. [DOI] [PubMed] [Google Scholar]
- Cajal SR. Histology of the Nervous System. Vol. 2. New York: Oxford University Press; 1995. [Google Scholar]
- Chen D, Jancovski N, Bassi JK, Nguyen-Huu TP, Choong YT, Palma-Rigo K, Davern PJ, Gurley SB, Thomas WG, Head GA, Allen AM. Angiotensin type 1A receptors in C1 neurons of the rostral ventrolateral medulla modulate the pressor response to aversive stress. J Neurosci. 2012;32:2051–2061. doi: 10.1523/JNEUROSCI.5360-11.2012. [DOI] [PMC free article] [PubMed] [Google Scholar]
- Coleman CG, Anrather J, Iadecola C, Pickel VM. Angiotensin II type 2 receptors have a major somatodendritic distribution in vasopressin-containing neurons in the mouse hypothalamic paraventricular nucleus. Neuroscience. 2009;163:129–142. doi: 10.1016/j.neuroscience.2009.06.032. [DOI] [PMC free article] [PubMed] [Google Scholar]
- Daubert DL, Meadows GG, Wang JH, Sanchez PJ, Speth RC. Changes in angiotensin II receptors in dopamine-rich regions of the mouse brain with age and ethanol consumption. Brain Res. 1999;816:8–16. doi: 10.1016/s0006-8993(98)00930-5. [DOI] [PubMed] [Google Scholar]
- de Wardener HE. The hypothalamus and hypertension. Physiol Rev. 2001;81:1599–1658. doi: 10.1152/physrev.2001.81.4.1599. [DOI] [PubMed] [Google Scholar]
- Denny JB, Polan-Curtain J, Wayner MJ, Armstrong DL. Angiotensin II blocks hippocampal long-term potentiation. Brain Res. 1991;567:321–324. doi: 10.1016/0006-8993(91)90812-a. [DOI] [PubMed] [Google Scholar]
- Drouyer E, LeSauter J, Hernandez AL, Silver R. Specializations of gastrin-releasing peptide cells of the mouse suprachiasmatic nucleus. J Comp Neurol. 2010;518:1249–1263. doi: 10.1002/cne.22272. [DOI] [PMC free article] [PubMed] [Google Scholar]
- Dumont EC, Rafrafi S, Laforest S, Drolet G. Involvement of central angiotensin receptors in stress adaptation. Neuroscience. 1999;93:877–884. doi: 10.1016/s0306-4522(99)00206-7. [DOI] [PubMed] [Google Scholar]
- Encinas JM, Vaahtokari A, Enikolopov G. Fluoxetine targets early progenitor cells in the adult brain. Proc Natl Acad Sci U S A. 2006;103:8233–8238. doi: 10.1073/pnas.0601992103. [DOI] [PMC free article] [PubMed] [Google Scholar]
- Freund TF, Buzsáki G. Interneurons of the hippocampus. Hippocampus. 1996;6:347–470. doi: 10.1002/(SICI)1098-1063(1996)6:4<347::AID-HIPO1>3.0.CO;2-I. [DOI] [PubMed] [Google Scholar]
- Gehlert DR, Gackenheimer SL, Schober DA. Autoradiographic localization of subtypes of angiotensin II antagonist binding in the rat brain. Neurosci. 1991;44:501–514. doi: 10.1016/0306-4522(91)90073-w. [DOI] [PubMed] [Google Scholar]
- Glass MJ, Huang J, Speth RC, Iadecola C, Pickel VM. Angiotensin II AT-1A receptor immunolabeling in rat medial nucleus tractus solitarius neurons: subcellular targeting and relationships with catecholamines. Neurosci. 2005;130:713–723. doi: 10.1016/j.neuroscience.2004.08.057. [DOI] [PubMed] [Google Scholar]
- Gong S, Zheng C, Doughty ML, Losos K, Didkovsky N, Schambra UB, Nowak NJ, Joyner A, Leblanc G, Hatten ME, Heintz N. A gene expression atlas of the central nervous system based on bacterial artificial chromosomes. Nature. 2003;425:917–925. doi: 10.1038/nature02033. [DOI] [PubMed] [Google Scholar]
- Gonzales KL, Chapleau JD, Pierce JP, Kelter DT, Williams TJ, Torres-Reveron A, McEwen BS, Waters EM, Milner TA. The influences of reproductive status and acute stress on the levels of phosphorylated mu opioid recetpor immunoreactivity in rat hippocampus. Front Neuroendocrinol. 2011;2:1–10. doi: 10.3389/fendo.2011.00018. [DOI] [PMC free article] [PubMed] [Google Scholar]
- Gurley SB, Riquier-Brison AD, Schnermann J, Sparks MA, Allen AM, Haase VH, Snouwaert JN, Le TH, McDonough AA, Koller BH, Coffman TM. AT(1A) Angiotensin receptors in the renal proximal tubule regulate blood pressure. Cell Metab. 2011;13:469–75. doi: 10.1016/j.cmet.2011.03.001. [DOI] [PMC free article] [PubMed] [Google Scholar]
- Hauser W, Johren O, Saavedra JM. Characterization and distribution of angiotensin II receptor subtypes in the mouse brain. Eur J Pharmacol. 1998;348:101–114. doi: 10.1016/s0014-2999(98)00134-4. [DOI] [PubMed] [Google Scholar]
- Hayward LF. Midbrain modulation of the cardiac baroreflex involves excitation of lateral parabrachial neurons in the rat. Brain Res. 2007;1145:117–127. doi: 10.1016/j.brainres.2007.01.140. [DOI] [PMC free article] [PubMed] [Google Scholar]
- Hof PR, Young WG, Bloom FE, Belichenko PV, Celio MR. Comparative cytoarchitectonic atlas of the C57BL/6 and 129/SV mouse brains. Amsterdam: Elsevier; 2000. [Google Scholar]
- Huang J, Hara Y, Speth RC, Iadecola C, Pickel VM. Angiotensin II subtype 1 (AT1) receptors in the rat sensory vagal complex: subcellular localization and association with endogenous angiotensin. Neurosci. 2003;122:21–36. doi: 10.1016/s0306-4522(03)00606-7. [DOI] [PubMed] [Google Scholar]
- Hundahl CA, Hannibal J, Fahrenkrug J, Dewilde S, Hay-Schmidt A. Neuroglobin expression in the rat suprachiasmatic nucleus: colocalization, innervation, and response to light. J Comp Neurol. 2010;518:1556–1569. doi: 10.1002/cne.22290. [DOI] [PubMed] [Google Scholar]
- Justice NJ, Yuan ZF, Sawchenko PE, Vale W. Type 1 corticotropin-releasing factor receptor expression reported in BAC transgenic mice: implications for reconciling ligand-receptor mismatch in the central corticotropin-releasing factor system. J Comp Neurol. 2008;511:479–496. doi: 10.1002/cne.21848. [DOI] [PMC free article] [PubMed] [Google Scholar]
- Kaufling J, Veinante P, Pawlowski SA, Freund-Mercier MJ, Barrot M. Afferents to the GABAergic tail of the ventral tegmental area in the rat. J Comp Neurol. 2009;513:597–621. doi: 10.1002/cne.21983. [DOI] [PubMed] [Google Scholar]
- Kazama K, Anrather J, Zhou P, Girouard H, Frys K, Milner TA, Iadecola C. Angiotensin II impairs neurovascular coupling in neocortex through NADPH oxidase-derived radicals. Circ Res. 2004;95:1019–1026. doi: 10.1161/01.RES.0000148637.85595.c5. [DOI] [PubMed] [Google Scholar]
- Lazarenko RM, Milner TA, Depuy SD, Stornetta RL, West GH, Kievits JA, Bayliss DA, Guyenet PG. Acid sensitivity and ultrastructure of the retrotrapezoid nucleus in Phox2b-EGFP transgenic mice. J Comp Neurol. 2009;517:69–86. doi: 10.1002/cne.22136. [DOI] [PMC free article] [PubMed] [Google Scholar]
- Lenkei Z, Corvol P, Llorens-Cortes C. Comparative expression of vasopressin and angiotensin type-1 receptor mRNA in rat hypothalamic nuclei: a double in situ hybridization study. Brain Res Mol Brain Res. 1995a;34:135–142. doi: 10.1016/0169-328x(95)00160-t. [DOI] [PubMed] [Google Scholar]
- Lenkei Z, Corvol P, Llorens-Cortes C. The angiotensin receptor subtype AT1A predominates in rat forebrain areas involved in blood pressure, body fluid homeostasis and neuroendocrine control. Brain Res Mol Brain Res. 1995b;30:53–60. doi: 10.1016/0169-328x(94)00272-g. [DOI] [PubMed] [Google Scholar]
- Lenkei Z, Palkovits M, Corvol P, Llorens-Cortes C. Expression of angiotensin type-1 (AT1) and type-2 (AT2) receptor mRNAs in the adult rat brain: a functional neuroanatomical review. Front Neuroendocrinol. 1997;18:383–439. doi: 10.1006/frne.1997.0155. [DOI] [PubMed] [Google Scholar]
- Levendusky MC, Basle J, Chang S, Mandalaywala NV, Voigt JM, Dearborn RE., Jr Expression and regulation of vitamin D3 upregulated protein 1 (VDUP1) is conserved in mammalian and insect brain. J Comp Neurol. 2009;517:581–600. doi: 10.1002/cne.22195. [DOI] [PubMed] [Google Scholar]
- Li YW, Guyenet PG, Bayliss DA. Voltage-dependent calcium currents in bulbospinal neurons of neonatal rat rostral ventrolateral medulla: Modulation by a2-adrenergic receptors. J Neurophysiol. 1998;79:583–594. doi: 10.1152/jn.1998.79.2.583. [DOI] [PubMed] [Google Scholar]
- McKinley MJ, Albiston AL, Allen AM, Mathai ML, May CN, McAllen RM, Oldfield BJ, Mendelsohn FA, Chai SY. The brain renin-angiotensin system: location and physiological roles. Int J Biochem Cell Biol. 2003;35:901–918. doi: 10.1016/s1357-2725(02)00306-0. [DOI] [PubMed] [Google Scholar]
- Milner TA, Thompson LI, Wang G, Kievits JA, Martin E, Zhou P, McEwen BS, Pfaff DW, Waters EM. Distribution of estrogen receptor beta containing cells in the brains of bacterial artificial chromosome transgenic mice. Brain Res. 2010;1351:74–96. doi: 10.1016/j.brainres.2010.06.038. [DOI] [PMC free article] [PubMed] [Google Scholar]
- Milner TA, Waters EM, Robinson DC, Pierce JP. Degenerating processes identified by electron microscpic immunocytochemical methods. In: Manfredi G, Kawamata H, editors. Neurodegeneration, Methods and Protocols. New York: Springer; 2011. pp. 23–59. [DOI] [PubMed] [Google Scholar]
- Miyoshi M, Miyano K, Moriyama N, Taniguchi M, Watanabe T. Angiotensin type 1 receptor antagonist inhibits lipopolysaccharide-induced stimulation of rat microglial cells by suppressing nuclear factor kappaB and activator protein-1 activation. Eur J Neurosci. 2008;27:343–351. doi: 10.1111/j.1460-9568.2007.06014.x. [DOI] [PubMed] [Google Scholar]
- Morrison SF, Nakamura K. Central neural pathways for thermoregulation. Front Biosci. 2011;16:74–104. doi: 10.2741/3677. [DOI] [PMC free article] [PubMed] [Google Scholar]
- Noack HJ, Lewis DA. Antibodies directed against tyrosine hydroxylase differentially recognize noradrenergic axons in monkey neocortex. Brain Res. 1989;500:313–324. doi: 10.1016/0006-8993(89)90327-2. [DOI] [PubMed] [Google Scholar]
- O'Callaghan EL, Bassi JK, Porrello ER, Delbridge LM, Thomas WG, Allen AM. Regulation of angiotensinogen by angiotensin II in mouse primary astrocyte cultures. J Neurochem. 2011;119:18–26. doi: 10.1111/j.1471-4159.2011.07406.x. [DOI] [PubMed] [Google Scholar]
- Peters A, Palay SL, Webster Hd. The fine structure of the nervous system. 3. New York: Oxford University Press; 1991. [Google Scholar]
- Pierce JP, Kievits J, Graustein B, Speth RC, Iadecola C, Milner TA. Sex differences in the subcellular distribution of angiotensin type 1 receptors and NADPH oxidase subunits in the dendrites of C1 neurons in the rat rostral ventrolateral medulla. Neuroscience. 2009;163:329–338. doi: 10.1016/j.neuroscience.2009.06.006. [DOI] [PMC free article] [PubMed] [Google Scholar]
- Pierce JP, Kurucz O, Milner TA. The morphometry of a peptidergic transmitter system before and after seizure. I. Dynorphin B-like immunoreactivity in the hippocampal mossy fiber system. Hippocampus. 1999;9:255–276. doi: 10.1002/(SICI)1098-1063(1999)9:3<255::AID-HIPO6>3.0.CO;2-S. [DOI] [PubMed] [Google Scholar]
- Pyner S, Coote JH. Identification of an efferent projection from the paraventricular nucleus of the hypothalamus terminating close to spinally projecting rostral ventrolateral medullary neurons. Neurosci. 1898;88:949–957. doi: 10.1016/s0306-4522(98)00255-3. [DOI] [PubMed] [Google Scholar]
- Ramer MS. Anatomical and functional characterization of neuropil in the gracile fasciculus. J Comp Neurol. 2008;510:283–296. doi: 10.1002/cne.21785. [DOI] [PubMed] [Google Scholar]
- Rowe BP, Grove KL, Saylor DL, Speth RC. Angiotensin II receptor subtypes in the rat brain. Eur J Pharmacol. 1990;186:339–342. doi: 10.1016/0014-2999(90)90457-h. [DOI] [PubMed] [Google Scholar]
- Saavedra JM, Sanchez-Lemus E, Benicky J. Blockade of brain angiotensin II AT1 receptors ameliorates stress, anxiety, brain inflammation and ischemia: Therapeutic implications. Psychoneuroendocrinology. 2011;36:1–18. doi: 10.1016/j.psyneuen.2010.10.001. [DOI] [PMC free article] [PubMed] [Google Scholar]
- Sawchenko PE, Brown ER, Chan RK, Ericsson A, Li HY, Roland BL, Kovacs KJ. The paraventricular nucleus of the hypothalamus and the functional neuroanatomy of visceromotor responses to stress. Prog Brain Res. 1996;107:201–222. doi: 10.1016/s0079-6123(08)61866-x. [DOI] [PubMed] [Google Scholar]
- Scala G, Corona M, Langella E, Maruccio L. Microvasculature of the buffalo (Bubalus bubalis) choroid plexuses: structural, histochemical, and immunocytochemical study. Microsc Res Tech. 2011;74:67–75. doi: 10.1002/jemt.20875. [DOI] [PubMed] [Google Scholar]
- Sierra A, Gottfried-Blackmore A, Milner TA, McEwen BS, Bulloch K. Steroid hormone receptor expression and function in microglia. Glia. 2008;56:659–674. doi: 10.1002/glia.20644. [DOI] [PubMed] [Google Scholar]
- Sinnayah P, Lindley TE, Staber PD, Davidson BL, Cassell MD, Davisson RL. Targeted viral delivery of cre recombinase induces conditional gene deletion in cardiovascular circuits of the mouse brain. Physiol Genomics. 2004;18:25–32. doi: 10.1152/physiolgenomics.00048.2004. [DOI] [PubMed] [Google Scholar]
- Tsutsumi K, Saavedra JM. Characterization and development of angiotensin II receptor subtypes (AT1 and AT2) in rat brain. Am J Physiol. 1991;261:R209–R216. doi: 10.1152/ajpregu.1991.261.1.R209. [DOI] [PubMed] [Google Scholar]
- Turner CD, Bagnara JT. General Endocrinology. Philadelphia: W.B. Saunders; 1971. [Google Scholar]
- Volkmann K, Chen YY, Harris MP, Wullimann MF, Koster RW. The zebrafish cerebellar upper rhombic lip generates tegmental hindbrain nuclei by long-distance migration in an evolutionary conserved manner. J Comp Neurol. 2010;518:2794–2817. doi: 10.1002/cne.22364. [DOI] [PubMed] [Google Scholar]
- von Bohlen und HO, Albrecht D. Angiotensin II inhibits long-term potentiation within the lateral nucleus of the amygdala through AT1 receptors. Peptides. 1998;19:1031–1036. doi: 10.1016/s0196-9781(98)00044-8. [DOI] [PubMed] [Google Scholar]
- Wang G, Anrather J, Glass MJ, Tarsitano MJ, Zhou P, Frys KA, Pickel VM, Iadecola C. Nox2, Ca2+, and protein kinase C play a role in angiotensin II-induced free radical production in nucleus tractus solitarius. Hypertension. 2006a;48:482–489. doi: 10.1161/01.HYP.0000236647.55200.07. [DOI] [PubMed] [Google Scholar]
- Wang G, Anrather J, Huang J, Speth RC, Pickel VM, Iadecola C. NADPH oxidase contributes to angiotensin II signaling in the nucleus tractus solitarius. J Neurosci. 2004;24:5516–5524. doi: 10.1523/JNEUROSCI.1176-04.2004. [DOI] [PMC free article] [PubMed] [Google Scholar]
- Wang G, Drake CT, Rozenblit M, Zhou P, Alves SE, Herrick SP, Hayashi S, Warrier S, Iadecola C, Milner TA. Evidence that estrogen directly and indirectly modulates C1 adrenergic bulbospinal neurons in the rostral ventrolateral medulla. Brain Res. 2006b;1094:163–178. doi: 10.1016/j.brainres.2006.03.089. [DOI] [PubMed] [Google Scholar]
- Wang G, Milner TA, Speth RC, Gore AC, Wu D, Iadecola C, Pierce JP. Sex differences in angiotensin signaling in bulbospinal neurons in the rat rostral ventrolateral medulla. Am J Physiol Heart Circ Physiol. 2008;295:R1149–R1157. doi: 10.1152/ajpregu.90485.2008. [DOI] [PMC free article] [PubMed] [Google Scholar]
- Wayner MJ, Armstrong DL, Polan-Curtain JL, Denny JB. Role of angiotensin II and AT1 receptors in hippocampal LTP. Pharmacol Biochem Behav. 1993;45:455–464. doi: 10.1016/0091-3057(93)90265-u. [DOI] [PubMed] [Google Scholar]
- Wosik K, Cayrol R, Dodelet-Devillers A, Berthelet F, Bernard M, Moumdjian R, Bouthillier A, Reudelhuber TL, Prat A. Angiotensin II controls occludin function and is required for blood brain barrier maintenance: relevance to multiple sclerosis. J Neurosci. 2007;27:9032–9042. doi: 10.1523/JNEUROSCI.2088-07.2007. [DOI] [PMC free article] [PubMed] [Google Scholar]
- Wright JW, Miller-Wing AV, Shaffer MJ, Higginson C, Wright DE, Hanesworth JM, Harding JW. Angiotensin II(3-8) (ANG IV) hippocampal binding: Potential role in the facilitation of memory. Brain Res Bull. 1993;32:497–502. doi: 10.1016/0361-9230(93)90297-o. [DOI] [PubMed] [Google Scholar]
- Wyse B, Sernia C. Growth hormone regulates AT-1a angiotensin receptors in astrocytes. Endocrinology. 1997;138:4176–4180. doi: 10.1210/endo.138.10.5430. [DOI] [PubMed] [Google Scholar]
- Zelezna B, Rydzewski B, Lu D, Olson JA, Shiverick KT, Tang W, Sumners C, Raizada MK. Angiotensin-II induction of plasminogen activator inhibitor-1 gene expression in astroglial cells of normotensive and spontaneously hypertensive rat brain. Mol Endocrinol. 1992;6:2009–2017. doi: 10.1210/mend.6.12.1491687. [DOI] [PubMed] [Google Scholar]
- Zimmerman MC, Lazartigues E, Sharma RV, Davisson RL. Hypertension caused by angiotensin II infusion involves increased superoxide production in the central nervous system. Circ Res. 2004;95:210–216. doi: 10.1161/01.RES.0000135483.12297.e4. [DOI] [PubMed] [Google Scholar]


