

Abstract
Tissues from bony fish were screened with anti-mouse leptin antibodies to detect the presence of the fat-regulating hormone in fishes. Low molecular-weight (16 kDa) immunoreactive bands were detected in blood, brain, heart and liver of green sunfish (Lepomis cyanellus), bluegill sunfish (Lepomis macrochirus), largemouth bass (Micropterus salmoides), white crappie (Pomonix annularis), channel catfish (Ictalurus punctatus), and rainbow trout (Oncorhynchus mykiss). To further verify that we had identified leptin, the response of fish “leptin” was measured in fed and fasted green sunfish. Fed sunfish had approximately threefold higher concentration of leptin in blood than did fasted sunfish (fed vs. fasted; 0.599 ± 0.03 μg/μl vs. 0.196 ± 0.04 μg/μl; P > F = 0.0001), which is consistent with mammalian models of leptin function. Brain leptin concentration is also positively correlated with percent body fat in white crappie and bluegill. Based upon electrophoretic mobility, immunoreactivity, response to fasting, and correlation with adiposity, we believe we have the first evidence for leptin expression in an ectotherm.
Leptin, derived from the Greek word leptos meaning thin, is a 16 kDa circulating hormone produced by the ob gene (Zhang et al., ’94). Leptin serves to regulate adiposity, appetite, and metabolism; mice that cannot synthesize leptin (ob/ob) are morbidly obese (Campfield et al., ’95; Pelleymounter et al., ’95; Halaas et al., ’97). Leptin is translated in white adipose tissue and secreted into the blood stream. After crossing the blood brain barrier (BBB), presumably by a soluble transporter (Banks et al., ’96), leptin binds to the OB-RL receptor in the hypothalamus (Tartaglia et al., ’95; Chen et al., ’96). The receptor then activates JAK/STAT pathways, which result in alterations in energy expenditure and appetite. To date leptin has only been characterized in endotherms, and the evolution of its function has been largely ignored. This report represents the first characterization of leptin in ectotherms.
As mammalian adipose depots increase so do their serum leptin levels (Frederich et al., ’95; Maffei et al., ’95; Considine et al., ’96). Leptin then transverses the BBB, presumably by a soluble transporter (Banks et al., ’96), binds to OB-RL in the hypothalamus (Tartaglia et al., ’95; Chen et al., ’96), and inhibits appetite (Stephens et al., ’95; Wang et al., ’97). This pathway results in a reduction of food intake and an increase in metabolism. As the organism’s adipose depots begin to diminish, serum leptin levels fall and appetite returns (Stephens et al., ’95; and Wang et al., ’97). Thus leptin serves as an “adipostat” in mammals. Furthermore, in mammals, leptin levels are positively correlated with body fat and both can be predictably manipulated with diet changes (Maffei et al., ’95; Ahren et al., ’97). If leptin has a similar function in fish, leptin levels also should be positively correlated with percent body fat. Currently fish must be sacrificed in order to determine total body fat. A fish-specific leptin antibody may enable nondestructive estimation of total body fat, similar to the technique used in humans (Maffei et al., ’95; Ahren et al., ’97). In addition, characterization of leptin in fishes would have implications for studies that seek to understand metabolic rate, reproductive maturity, energy storage and allocation, migration, and cold acclimation.
We present data that indicate leptin to be present in blood from largemouth bass (Micropterus salmoides), green sunfish (Lepomis cyanellus), bluegill (Lepomis macrochirus), white crappie (Pomoxis annularis), channel catfish (Ictalurus punctatus), and rainbow trout (Oncorhynchus mykiss ). These data also suggest that leptin concentrations decrease with starvation. Therefore, leptin may also serve as a marker for adiposity in fishes, as in mammals.
MATERIALS AND METHODS
Fish
Largemouth bass (M. salmoides), green sunfish (L. cyanellus), and white crappie (P. annularis) were purchased from Fender’s Fish Hatchery and Llama Farm in Baltic, Ohio. Bluegill (L. macrochirus) were collected from ponds located at University of Akron’s nature preserve in Bath township; channel catfish (I. punctatus) tissue samples were donated by Jeff Silverstein (USDA Agricultural Research Foundation, Stoneville, Missouri); and trout (O. mykiss) tissue samples were the kind gift of Jörgen Jensen (Department of Zoophysiology, University of Göteborg, Sweden). All fish were adults (2 years of age) and, with the exception of the catfish and trout, were housed at the University of Akron’s Biology Animal Resource facility according to NIH animal care guidelines. Fish were kept in 100-gallon temperature-controlled (20°C) recirculating tanks (one species per tank) and fed once daily. Room lights were on a 12:12 cycle, and all fish were sacrificed between 9:00–10:00 AM. Ammonia and temperature were checked daily and water was changed weekly.
Food restriction’s effects on leptin in Lepomis cyanellus
Fourteen green sunfish were divided into two groups of seven and kept at room temperature. One group was fed commercial pellets to satiation daily at 11:00 AM and the other group was fasted for 2 weeks. Following 2 weeks of feeding or fasting, five fish from each group were sacrificed by overdose of MS222 (3-Aminobenzoic acid ethyl-ester) followed by spinal transection. Weight and total length were recorded. Blood was drawn by cardiac puncture using a heparinized syringe. PMSF (phenylmethylsulfonyl flouride; 2 μl of 25 μg/μl in isopropanol) was added immediately to blood after it was drawn to inhibit proteolysis; a few microliters were removed to estimate hematocrit and the remainder of the samples were then frozen in liquid nitrogen and stored at –70°C. The following tissues were harvested: brain, heart, muscle, liver, and intestinal adipose. Harvested tissues were immediately frozen with liquid nitrogen and stored at –70°C for later use. The blood and tissues were subjected to Western blot analysis. The remaining two sunfish in each group were kept on the feeding regimen for another 2 weeks; only brains were harvested from these fish.
SDS-PAGE
Tissue homogenates (10% w/v) were made with 10 mM HEPES pH 7.4 using ground glass homogenizers. Immediately following homogenization 2 μl PMSF was added. Protein was estimated by bicinchoninic acid (BCA) protein assay (Smith et al., ’85). To prepare samples for SDS-PAGE, 4× sample loading buffer [final concentration 7.5% v/v glycerol, 62 mM Tris, 2.5 mM Na2EDTA, 1% (w/v) SDS, 0.05% (w/v) bromophenol blue, 100 mM DTT (dithiothreitol)], protein, and distilled water were combined to a constant volume of sample per lane. Before loading, samples were boiled for 10 min at 100°C, frozen in liquid nitrogen, and boiled again for 10 min at 100°C. Gels were run at 290 volts for 10 min before loading (which heated them to approximately 40°C). Samples were separated on a 10–20% tris-glycine gradient gel with a 4% stacker at 290 volts for 5 hr. All buffers and gel systems used were those of Laemmli (Laemmli, ’70). Gels were stained with Coomassie brilliant blue R250 overnight and then destained (100 ml Acetic Acid, 100 ml Methanol, 800 ml dH2O) overnight.
Immunoblot
Proteins were transferred to PVDF (polyvinyli-denedifloridine) membrane with a semi-dry electro blotter. The blot was blocked in 5% (w/v) Carnation nonfat dry milk in 1× phosphate buffered saline (PBS: 137 mM NaCl, 2.7 mM KCl, 4.3 mM Na2HPO4 · 7H2O, 1.4 mM KH2PO4) overnight at 4°C while shaking. Following blocking the blot was briefly rinsed with 1× PBS, then incubated in 10 mL of primary antibody diluted to 1:500 with 1× PBS (overnight at 4°C while shaking). The primary antibody was rabbit anti-mouse leptin polyclonal antibody, (Chemicon Inc., Temecula, CA). Following incubation the membrane was washed once for 10 min in 1× PBS and incubated with secondary antibody (goat anti-rabbit IgG; peroxidase conjugate 1:10,000 concentration; Pierce, Rockford, IL), for 2.5 hr at room temperature while shaking. After final incubation the blot was washed once with 1× PBS for 10 min, developed with a chemiluminescent substrate (Pierce), and exposed to film.
Digital densitometry
Images were captured with the GDS7600 Gel Documentation System (Ultra Violet Products, Upland, CA). Standard curves of recombinant mouse leptin (Pepro Tech, Rockey Hill, NJ) ranging from 750 ng to 125ng were included on each blot. Blots were digitally imaged with the digital densitometer and quantified with Sigma Gel software (Jandel Scientific, San Rafel, CA). Integrated area for each band in the standard curve was plotted against its known leptin concentration and linear regression was performed. R2 values for the standard curves were always between 0.9 and 1.0. The putative leptin bands in the unknown sample were treated as described previously. The amount of leptin was determined from the integrated area by use of the standard curve. Since we often obtained a doublet band around 16 kDa, we were conservative and only integrated the top band of the doublet, as done by other researchers quantifying leptin in humans (Caro et al., ’96).
Fat extraction
Fat extraction was conducted using the Soxtec System HT2 Extraction Unit (Tecator, Högänan, Sweden). Fish carcasses were dried in a drying oven at 50°C to a constant weight. The fish were then weighed and ground in a coffee mill. A portion of each ground fish was placed in an extraction thimble and left to dry overnight to ensure evaporation of any water absorbed during grinding. The following day the thimbles were weighed, then extracted for 1 hr with petroleum-ether heated to 65°C. After 1 hr the petroleum ether was changed and samples extracted for another hour. Following extraction thimbles were dried overnight at 50°C and the following day they were weighed.
Statistical analysis
All results were expressed as mean ± standard error. Data from fat extraction, percent hematocrit, weight, total length, and leptin concentrations were analyzed by MANOVA. Statistical significance was defined as P > F ≤ 0.05 (Wilk’s Lambda). To test the correlation between leptin concentrations and percent body fat, linear regressions were performed on the data.
RESULTS
Leptin expression
Western blot analysis of tissues from green sunfish (L. cyanellus), largemouth bass (M. salmoides), bluegill (L. macrochirus), and white crappie (P. annularis) tissues revealed that leptin is expressed in heart, liver, brain, and blood (representative blots in Fig. 1A, B). Blood from C57BL/ 6 male mice (Jackson Labs, Bar Harbor, ME) was also blotted as a control. Leptin from mouse blood resolved at the same location as leptin from the assayed fish species (Fig. 2). The signal from brain tissues also indicated the presence of leptin, which was invariant in mobility across species (Fig. 3). Leptin from brain homogenates of all fish species assayed (green sunfish, largemouth bass, bluegill, white crappie, channel catfish, rainbow trout) and C57BL/6 male mouse migrated similarly (Fig. 3).
Fig. 1.

Electrophoresis and immunoblotting of Lepomis cyanellus tissue homogenates. Left panel: 10–20% Tris-glycine gradient gel. Lane 1 = mouse leptin, 0.5 μg; lane 2 = blood; lane 3 = heart; lane 4 = brain; lane 5 = liver; lane 6 = muscle; lane 7 = fat (100 μg protein/lane, lanes 2–7). Right panel: Immunoblot of gel with leptin antibody. Lane assignments as in left panel.
Fig. 2.

Immunoblot of blood taken from C57BL/6 male mouse using leptin antibody. Lane 1 = 0.5 μg mouse leptin; lane 2 = 0.25 μg mouse leptin; lane 3 = 0.05 μg mouse leptin; lanes 4–7 = mouse blood (100 μg protein/lane).
Fig. 3.
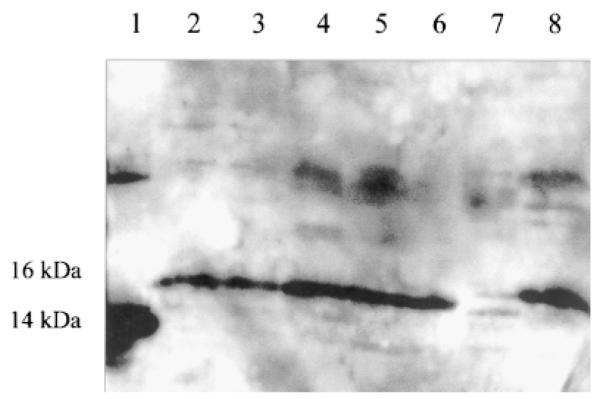
Immunoblot of brain from all assayed fish species using leptin antibody. Lane 1 = mouse leptin (0.5 μg); lane 2 = green sunfish; lane 3 = bluegill; lane 4 = largemouth bass; lane 5 = catfish; lane 6 = white crappie; lane 7 = trout; lane 8 = mouse brain (100 μg protein/lane).
Food restriction’s effects on leptin
Following 14 days of food restriction blood leptin levels in the green sunfish were significantly different between fed and fasted groups, with the fed group having threefold the concentration of leptin in comparison to the fasted individuals. Overall percent body fat was higher in the fed group when compared to the nonfed group, but the difference was not significant. Furthermore, the weight of the fed group was greater than that of the nonfed group although not significantly (Table 1).
TABLE 1.
Response to leptin to fasting in green sunfish1
| Green sunfish | Fed | Nonfed | Wilk’s lambda prob > F |
|---|---|---|---|
| Weight (g) | 49.18 ± 8.23 | 37.73 ± 4.48 | 0.0952 |
| Total length (cm) | 13.95 ± 0.29 | 13.45 ± 0.26 | 0.2511 |
| Blood leptin (μg/ml) | 0.599 ± 0.03 | 0.196 ± 0.04 | 0.0001* |
| % Hematocrit | 32.71 ± 8.51 | 29.95 ± 4.47 | 0.3209 |
| % Body fat | 13.33 ± 1.08 | 12.71 ± 2.62 | 0.6739 |
| All variables | 0.0985 |
Each group consisted of four individuals.
Statistically significant difference.
Correlation between leptin concentration and percent body fat
Linear regression indicates that a correlation exists between brain leptin concentrations and percent body fat in bluegill sunfish and white crappie (Fig. 4). A significant correlation was found (r2 = 0.43; P < 0.00018), although no significant relationship exists between blood leptin and percent body fat (r2 = 0.0196, data not shown).
Fig. 4.
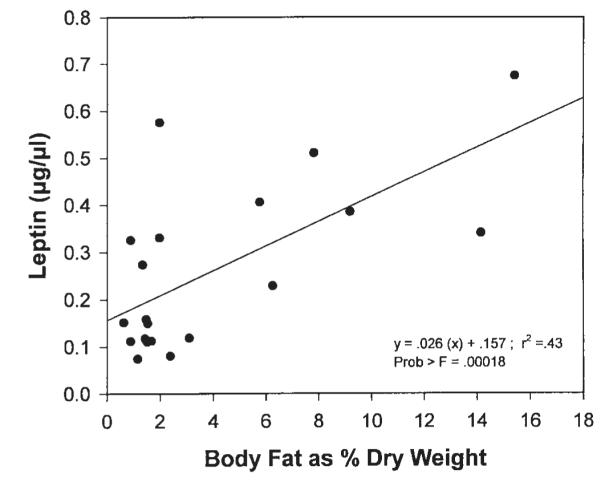
Brain leptin concentration of bluegill (Lepomis macrochirus, 10 fish) and white crappie (Pomoxis annularis, 10 fish) plotted against percent of dry weight that is extracted lipid.
DISCUSSION
In 1994 leptin was discovered in mice (Zhang et al., ’94). Leptin was initially studied in mammals until recently, when leptin was characterized from chicken liver (Taouis et al., ’98). Now data exist for leptin’s wide distribution among species. The data presented here are the first to suggest that leptin is expressed in fish and are also the first evidence for leptin’s expression in ectotherms.
Characterization of leptin in fish
Is the anti-mammalian leptin antibody truly detecting leptin in fish tissues? Immunoreactive bands migrated higher than the recombinant leptin standard, which migrates at 14 kDa. Mammalian leptin’s molecular weight is 16 kDa (Zhang et al., ’94). Leptin from C57BL/6 male mouse blood also migrates higher than the purified leptin standard (Fig. 2) and identically with the fish leptin signal (Fig. 3). This apparent difference in molecular weight could be due to any of three factors. The first is that purified leptin is migrating anomolously when compared to leptin in blood. Indeed, purified proteins can migrate differently than proteins in a complex mixture (Sidell et al., ’97). The two bands could also be isoforms of leptin. Recently a 19-kDa isoform of leptin has been identified in extracts of rat stomach (Bado et al., ’98), establishing that leptin isoforms exist. Finally, the observation could be due to post-translational modification of fish leptin. Mammalian leptin is not thought to be post-translationally modified (Giese et al., ’96). However, a different polyclonal antibody, also against mouse leptin [National Hormone and Pituitary Program (NHPP), UCLA Medical Center, CA] resulted in a banding pattern for leptin (in homogenates) that migrated more closely to recombinant mouse leptin (data not shown). Further characterization of fish leptin is necessary to resolve which of these hypotheses are most likely.
Is leptin expressed in the brain?
Northern blot analysis demonstrate leptin’s message to be specifically expressed in white adipose tissue, although it is detected in the placenta at small levels (Zhang et al., ’94). In chickens however, leptin is expressed primarily in the liver (Taouis et al., ’98). Therefore, in early vertebrates leptin’s original site of production may have been liver. We routinely detect a faint signal in fish liver, (along with heart and blood) but the most intensive signal is in brain. A large leptin signal in the brains of these fish species can be explained by one of two hypotheses. First, fish may indeed produce leptin in the brain. Many neuropeptides that regulate appetite are synthesized in the brain including Neuropeptide Y (NPY), Galanin, Orexin A and B, and Peptide YY (White and Kershaw, ’90; and Kalra et al., ’91). We do not favor this hypothesis; if leptin functions as a feedback mechanism in fat regulation, it is difficult to surmise how it would serve as an indicator for fat stores if it is being synthesized far from the site of fat production (the brain).
A second possibility is that the leptin signal in brain is concentrated by its receptor (Tartaglia et al., ’95). When leptin is bound to its receptor in the brain it may be protected from proteolysis during tissue extraction and homogenization. When brain samples are prepared for SDS-PAGE, leptin dissociates from its receptor, resulting in a larger signal in comparison to other samples. In other tissues leptin is not protected from proteolysis, because there are little or no functional receptors in comparison to brain. Therefore, leptin is subjected to proteolysis, is not concentrated, and a smaller signal results.
We suggest the larger concentrations of leptin observed in the brain are a result of receptor protection rather than leptin synthesis in the brain. Zhang et al. (’94) reported that there is no leptin mRNA in mouse brain; without the mRNA leptin protein is obviously not synthesized. Our data show immunoreactive bands in mouse brain, which appear to have similar concentrations and migrate similarly to the bands in fish brain (Fig 3). We believe these data suggest that the large concentration of leptin in fish brains is due to protection by its receptor and are not a result of leptin’s synthesis in the brain.
Fish express leptin (?)
Without sequence data we cannot unequivocally state that fish express leptin; however the pre-ponderance of data support such a statement. The immunoreactive band is approximately the correct size for leptin (Zhang et al., ’94). The protein reacts with two independently produced polyclonal antibodies directed against recombinant mouse leptin and the immunoreactive banding pattern is similar to western blots for mammalian leptin (Caro et al., ’96). Homogenates from male mouse brains run adjacent to fish samples display immunoreactive bands (leptin) that resolve in the same location (Fig. 3). Experiments at the organismal level also lend support to the existence of leptin in fish. If the immunoreactive band is leptin, and if leptin serves a similar function in fish that it does in mammals, a correlation should exist between percent body fat and leptin (Maffei et al., ’95). In mammals, leptin levels are positively correlated with body fat and both can be predictably manipulated with diet changes. Green sunfish fasted for 14 days (Table 1) did have a lower mean percent body fat (12.71 ± 2.62%) when compared to the fed group (13.33 ± 1.08%), however the difference was not significant (P = 0.683). Fasted fish also weighed less than fed, although the difference is not significant (P = 0.095). In the field, fish are exposed to prolonged periods of natural food deprivation, which is due to fluctuations in food supply and migration patterns brought about by seasonal change (Stanek, ’73). During these periods fish primarily utilize stored energy reserves in the form of white glycolytic muscle, which comprises approximately 40–60% of their bodies (Bahuguna and Rawat, ’94). Glycolytic muscle, which is primarily used for quick bursts of speed, can be metabolized without jeopardizing the animal because it comprises such a large portion of the organism. Thus, fasted green sunfish may be mobilizing white muscle to offset the effects of starvation, rather than exclusively fat. This could explain the differences found in total weight and not percent body fat.
Blood leptin concentrations (Table 1) were significantly higher in fed (0.599 ± 0.03 μg/μl) versus fasted (0.196 ± 0.04 μg/μl) groups (P = 0.0001). Regression analysis of the green sunfish data showed no correlation to exist between blood leptin concentrations and percent body fat (r2 = 0.0196; data not shown). However, when brain leptin concentrations of 10 bluegill (L. macrochirus) and 10 white crappie (P. annularis) were plotted against percent body fat (Fig. 4), a significant positive correlation resulted (r2 = 0.43, P < 0.00018). The amount of native leptin within blood (much lower signals than brain) may be at the lower limits of detection on the immunoblots, therefore resulting in high variance. Alternatively, protection by the leptin receptor in the brain may contribute to a correlation with percent body fat. Receptor protection serves to increase apparent brain leptin titer, thereby bringing native leptin levels within the detection limits of the assay. These data demonstrate the need for the development of an antibody directed toward fish leptin. A fish-specific leptin antibody would provide increased signal strength in blood and thus act as an effective detector. With the fish-specific antibody we can evaluate whether a predictive relationship between leptin titer and percent body fat exists in fish, and what error may be associated with that relationship.
When lean rats are fasted, circulating leptin decreases 3.2-fold in response to the stressor (Hardie et al., ’96); thus our results are consistent with a leptin signal. An alternate possibility is that protein levels fall in general during starvation, and that we would see a similar decrease regardless of the protein we examined. Hematocrit is a reasonable indicator of hemoglobin levels and hematocrits in the fed group (32.71 ± 8.51%) when compared to the fasted group (29.95 ± 4.47%) were not significantly different (P = 0.320). We know then, that not all protein concentrations change as a result of fasting, and no obvious change in total protein concentration was evident among fed and fasted groups (i.e., the same volume of homogenized tissue or blood was loaded in fed and fasted groups, and no obvious difference between groups was evident in either total protein staining per lane nor in total protein concentration, assayed by BCA).
Until now studies of leptin and its physiological functions have been confined to endotherms (primarily mammals). Here we demonstrate for the first time leptin’s expression in ectotherms and more specifically fish. Data that support this assertion include: (1) mammalian anti-leptin antibodies recognize a band of the appropriate size for leptin (16 kDa) in blood, liver, heart, and brain of fish; (2) leptin blots give a similar immunoreactive pattern in fish tissues and in mammalian tissues; (3) leptin in mouse blood migrates identically to the immunoreactive band in fish tissues; (4) concentrations of the immunoreactive band (leptin) are three times as high in a fed group than in a nonfed group of green sunfish; and (5) a positive correlation was found to exist between the immunoreactive band (leptin) in brain and percent body fat in bluegill and white crappie. Present studies are aimed at developing a fishspecific leptin antibody and at cloning a fish leptin cDNA. The antibody would be useful in further characterizing the function(s) of leptin in fish, including leptin’s effects on fat storage, sexual maturation, and metabolic rate. The cloned cDNA will be used for comparative sequence analysis and expression studies.
ACKNOWLEDGMENTS
The authors gratefully acknowledge Robert Andrew, Valentina Dobre, C. Shawn DuVall, Deidra Tschantz, and Irene Wolf for assistance in fish maintenance. Dr. Jeff Silverstein and Dr. Jörgen Jensen kindly provided tissue samples. Dr. A.F. Parlow and the National Hormone Pituitary program provided some recombinant leptin and antileptin antibodies. This manuscript was improved by the comments of anonymous reviewers. The work was supported by Ohio Sea Grant 735489 and Faculty Research Projects grants (Univ. Akron) to R.L.L.
Grant sponsor: Ohio Sea Grant; Grant number: 735489; Grant sponsor: University of Akron.
LITERATURE CITED
- Ahren B, Larsson H, Wilhemsson C, Nasman B, Olsson T. Regulation of circulating leptin in humans. Endocr. 1997;7:1–8. doi: 10.1007/BF02778056. [DOI] [PubMed] [Google Scholar]
- Bado A, Levasseur S, Attoub S, Kermorgant S, Laigneau JP, Bortoluzzi MN, Moizo L, Lehy T, Guerre Millo M, Marchand-Brustel YE, Lewin MJM. The stomach is a source of leptin. Nature. 1998;394:790–793. doi: 10.1038/29547. [DOI] [PubMed] [Google Scholar]
- Banks WA, Kastin AJ, Huang W, Jaspan JB, Maness LM. Leptin enters the brain by a saturable system independent of insulin. Peptides. 1996;17:305–311. doi: 10.1016/0196-9781(96)00025-3. [DOI] [PubMed] [Google Scholar]
- Bahuguna SN, Rawat A. Starvation effects on the biochemical parameters, viz, lipid, protein, carbohydrate of a hillstream fish Barilius bendelisis (HAM) in relation to light and dark captivity. J Anim Morphol Physiol. 1994;41:107–111. [Google Scholar]
- Campfield LA, Smith FJ, Guisez Y, Devos R, Burn P. Recombinant mouse OB protein: evidence for a peripheral signal linking adiposity and central neural networks. Science. 1995;269:546–549. doi: 10.1126/science.7624778. [DOI] [PubMed] [Google Scholar]
- Chen H, Charlat O, Tartaglia LA, Woolf EA, Weng X, Ellis SJ, Lakey ND, Cullpepper J, Moore KJ, Breitbart RE, Duyk GM, Tepper RI, Morgenstern JP. Evidence that the diabetes gene encodes the leptin receptor: identification of a mutation in the leptin receptor gene in db/db mice. Cell. 1996;84:491–495. doi: 10.1016/s0092-8674(00)81294-5. [DOI] [PubMed] [Google Scholar]
- Considine RV, Sinha MK, Heiman ML, Kriauciunas A, Stephens TW, Nyce MR, Ohannessian JP, Marco CC, McKee LJ, Bauer TL, Caro JF. Serum immunoreactive leptin concentrations in normal weight and obese humans. N Engl J Med. 1996;334:292–295. doi: 10.1056/NEJM199602013340503. [DOI] [PubMed] [Google Scholar]
- Frederich RC, Lollmann B, Hamann A, Napolitano-Rosen A, Kahn BB, Lowell BB, Flier JS. Expression of ob mRNA and it encoded protein in rodents. Impact of nutrition and obesity. J Clin Invest. 1995;96:1658–1663. doi: 10.1172/JCI118206. [DOI] [PMC free article] [PubMed] [Google Scholar]
- Giese K, Fantl WJ, Vitt C, Stephans JC, Cousens L, Wachowicz M, Williams LT. Reduction of food intake and weight gain by the ob protein requires specific secondary structure and is reversible. Molecular Med. 1996;2:50–58. [PMC free article] [PubMed] [Google Scholar]
- Halaas JL, Cohen SL, Maffei M, Lallone RL, Freidman JM. Physiological response to long-term peripheral and central leptin infusion in lean and obese mice. Nat Med. 1997;1:1155–1161. doi: 10.1073/pnas.94.16.8878. [DOI] [PMC free article] [PubMed] [Google Scholar]
- Hardie LJ, Rayner DV, Holmes S, Trayhurn P. Circulating leptin levels are modulated by fasting, cold exposure, and insulin administration in lean but not zucker (fa/fa) rats as measured by ELISA. Biochem Biophys Res Commun. 1996;223:660–665. doi: 10.1006/bbrc.1996.0951. [DOI] [PubMed] [Google Scholar]
- Kalra SP, Dube MG, Sahu A, Phelps CP, Kalra PS. Neuropeptide Y secretion increases in the paraventricular nucleus in association with increased appetite for food. Proc Natl Acad Sci USA. 1991;88:10931–10935. doi: 10.1073/pnas.88.23.10931. [DOI] [PMC free article] [PubMed] [Google Scholar]
- Laemmli R. Cleavage of structural proteins during the assembly of the head of the bacteriophage T4. Nature. 1970;227:690–685. doi: 10.1038/227680a0. [DOI] [PubMed] [Google Scholar]
- Maffei M, Halaas J, Ravussin E, Pratley RE, Lee GH, Zhang Y, Fei H, Kim S, Lallone R, Ranganathan S, Kern PA, Friedman JM. Leptin levels in human and rodent: measurements of plasma leptin and ob RNA in obese and weight-reduced subjects. Nat Med. 1995;1:1155–1161. doi: 10.1038/nm1195-1155. [DOI] [PubMed] [Google Scholar]
- Pelleymounter MA, Cullen MJ, Baker MB, Hecht R, Winters D, Boone T, Collins F. Effects of the obese gene product on body weight regulation in ob/ob mice. Science. 1995;269:540–543. doi: 10.1126/science.7624776. [DOI] [PubMed] [Google Scholar]
- Sidell BD, Vayda ME, Small DJ, Moylan TJ, Londraville RL, Yuan ML, Rodnick KJ, Eppley ZA, Costello L. Variable expression of myoglobin among the hemoglobinless antarctic icefishes. Proc Natl Acad Sci USA. 1997;94:3420–3424. doi: 10.1073/pnas.94.7.3420. [DOI] [PMC free article] [PubMed] [Google Scholar]
- Smith PK, Krohn RI, Hermanson GT, Mallia AK, Gartner FH, Provenzano MD, Fujimoto EK, Goeke NM, Olson BJ, Klenk DC. Measurement of protein using bicinchoninic acid. Anal Biochem. 1985;150:76–85. doi: 10.1016/0003-2697(85)90442-7. [DOI] [PubMed] [Google Scholar]
- Stanek E. Observations of food and feeding of cod (Gadus morhua L.) in laboratory, Newfoundland, and Nova Scotia waters. Pr Morsk Inst Ryb Gdanyi. 1973;17:7–26. (A) [Google Scholar]
- Stephens TW, Basinski M, Bristow PK, Bue-Vallesky JM, Burgett SG, Craft L, Hale J, Hoffman J, Hsiung HM, Kriauciunas A. The role of neuropeptide Y in the antiobesity action of the obese gene product. Nature. 1995;377:530–532. doi: 10.1038/377530a0. [DOI] [PubMed] [Google Scholar]
- Taous M, Chen JW, Daviaud C, Cupont J, Derouet M, Simon J. Cloning the chicken leptin gene. Gene. 1998;208:239–242. doi: 10.1016/s0378-1119(97)00670-7. [DOI] [PubMed] [Google Scholar]
- Tartaglia LA, Demdski M, Weng X, Deng N, Culpepper J, Devos R, Richards GJ, Campfield LA, Clark FT, Deeds J, Muri C, Sanke S, Moriarty A, Moore KJ, Smutko JS, Mays GG, Woolf EA, Monroe CA, Tepper RI. Identification and expression cloning of a leptin receptor, OB-R. Cell. 1995;83:1263–1271. doi: 10.1016/0092-8674(95)90151-5. [DOI] [PubMed] [Google Scholar]
- Wang Q, Bing C, Al-Barazanji K, Mossakowaska DE, Wang XM, McBay DL, Neville WA, Taddayon M, Pickavance L, Dryden S, Thomas ME, McHale MT, Gloyer IS, Wilson S, Buckinghame R, Arch JR, Trayhurn P, Williams G. Interactions between leptin and hypothalamic neuropeptide Y neurons in the control of food intake and energy homeostasis in the rat. Diabetes. 1997;46:335–341. doi: 10.2337/diab.46.3.335. [DOI] [PubMed] [Google Scholar]
- White JD, Kershaw M. Increased hypothalamic neuropeptide Y expression following food deprivation. Mol Cell Neurosci. 1990;1:41–48. doi: 10.1016/1044-7431(90)90040-b. [DOI] [PubMed] [Google Scholar]
- Zhang Y, Proenca R, Maffei M, Barone M, Leopold L, Friedman JM. Positional cloning of the mouse obese gene and its human homologue. Nature. 1994;372:425–432. doi: 10.1038/372425a0. [DOI] [PubMed] [Google Scholar]