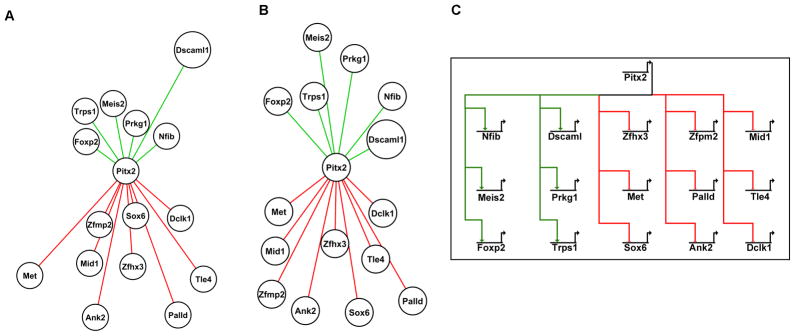
Figure 2. Pitx2 Target Genes Visualized with Cytoscape and Biotapestry.
Individual target genes are represented by a white circle with Pitx2 as the core regulator. Lines colored red represent targets of Pitx2 and lines colored green represent targets of activation by Pitx2. The distance of the gene from Pitx2 represents the strength of their respective relationship. (A) Representation of target gene relationship based on the sum of evolutionary conserved binding sites from Table 2. Genes with greater number of binding sites are mapped closer to Pitx2; genes with fewer binding sites are further away. (B) Representation of target gene relationship based on the fold changes observed by microarray analysis. The greater the fold change the closer the gene is mapped to Pitx2. It appears that Pitx2 acts as a repressor for the majority of our target genes. (C) BioTapestry was used to generate a model of the Pitx2 regulatory network in the limb. Red links represent genes repressed by Pitx2, while green links represent genes activated by Pitx2. The mechanism of activation or repression is not shown.

