

Abstract
The basic circuitry of auditory, visual, somatosensory and other cortical areas is highly stereotyped (Douglas and Martin, 2004). However, it remains unclear whether this anatomical stereotypy implies functional homogeneity, or whether instead different cortical areas are specialized to process the diverse sensory inputs they receive. Here we have used a two alternative forced choice task to assess modality-specific differences in the ability of rats to exploit precise neuronal timing. We delivered pairs of electrical pulses directly to different areas of cortex to determine the minimum timing differences subjects could detect. By stimulating the cortex directly, we isolated differences due to cortical circuitry rather than to sensory transduction and subcortical processing. Surprisingly, the minimum detectable timing differences varied over more than an order of magnitude, ranging from 1 ms in barrel cortex to 15 ms in visual cortex. Furthermore, these modality-specific differences depended upon sensory experience: although animals subjected to whisker clipping initially showed an impaired ability to exploit fine timing in barrel cortical stimulation, behavioral training partially rescued this deficit. Our results suggest that different cortical areas are adapted to the specific structure of the input signals they process, and that precise spike timing may play a more important role for some cortical areas than for others.
Introduction
The architecture of sensory neocortex is remarkably stereotyped. Neurons are distributed across six layers. Within each layer sit specific types of excitatory and inhibitory neurons, distinguishable by size, morphology and connectivity. The consistency of neocortical architecture has led to the hypothesis that the neocortex consists of a basic repeating unit—a canonical circuit—which performs similar computations, regardless of the inputs it processes (Douglas and Martin, 2004).
Despite the striking similarities, careful analysis also reveals differences in the architecture among areas, such as differences in the thickness and composition of each layer, and differences in the organization of local circuits and projections (Neafsey et al., 1986; Ohki et al., 2005; Shepherd and Svoboda, 2005; Oviedo et al., 2010). However, assessing the functional impact of such differences on computation and sensory processing poses an experimental challenge: signals from different sensory modalities are subject to markedly different preprocessing before reaching cortex, potentially confounding the interpretation of any apparent differences in cortical function. For example, for sound localization the auditory system exploits stimulus-timing cues in the submillisecond range (Jeffress, 1948; Brand et al., 2002), far more precise than any cues used in vision. However, these submicrosecond timing differences are extracted by highly specialized subcortical structures, and so cannot be used to draw inferences about any difference in the auditory versus visual cortex.
To bypass confounds due to sensory transduction and subcortical processing, we have previously developed a strategy based on direct cortical stimulation (Yang et al., 2008; see also Houweling and Brecht, 2008; Huber et al., 2008). We used this strategy to probe the ability of rats to use precisely timed neural activity in auditory cortex to guide behavior. We found that rats could be trained to interpret precisely timed cortical activity, even pulses delivered only three milliseconds apart (Yang et al., 2008).
To what extent does this exquisite sensitivity to precise timing reflect a specialization of the auditory cortex? On the one hand, auditory cues can take precedence over visual cues in perception tasks which require fine temporal resolution (Shams et al., 2000), suggesting that organisms are predisposed to value estimates of timing based on audition as more reliable than on vision. On the other hand, the stereotypy of cortical circuitry suggests that all areas might be wired so as to be equally capable of exploiting precisely timed activity. Indeed, neurons in the visual cortex can lock to stimuli with millisecond precision (Bair and Koch, 1996; Buracas et al., 1998)—comparable to the auditory cortex (Heil, 1997; DeWeese et al., 2003)—indicating that fine stimulus timing is preserved in both modalities.
To determine whether fine timing in the visual cortex could also guide behavior, we used the cortical stimulation paradigm previously developed (Yang et al., 2008) and found that the minimum detectable timing difference for visual cortex is much longer than that of auditory cortex. We further investigated the barrel cortex, and found that the minimum difference of barrel cortex is even shorter than auditory cortex. And with sensory deprivation by whisker trimming, we found that the ability to exploit fine timing in the barrel cortex is experience-dependent.
Materials and Methods
Surgery.
All procedures were approved by the Cold Spring Harbor Laboratory Animal Committee. Animals were anesthetized with an intraperitoneal injection of a mixture of ketamine (60 mg/kg) and medetomidine (0.51 mg/kg). Wounds were infiltrated with lidocaine.
During the surgery, a craniotomy and a duratomy were performed. For visual cortex animals, stimulation electrodes were implanted 6.0 and 7.1 mm posterior to bregma and 4.0 mm left from the midline. For barrel cortex animals, electrodes were implanted 1.5 and 2.6 mm posterior to bregma and 5.6 mm left from the midline. The electrodes were implanted at depths ranging from 0.7 to 1.1 mm. After surgery, animals were left to recover for several days before resuming water deprivation.
Electrical stimulation.
Stimulation electrodes were made of polyimide-coated nichrome wires (H.P. Reid), and were gold plated so that the impedance ranged from 300 to 350 kΩ at 1 kHz.
Each electrical stimulus consisted of a train of 5 biphasic 4-volt voltage pulses at 50 Hz (RP2, Real-time processor, Tucker-Davis Technologies) which were passed through a 1:2.2 transformer (SP-21, Triad Magnetics). We used a skull screw on the contralateral temporal bone as ground. The impedance from the electrode to the ground ranged from 400K to 1 m. The diameter of the stimulated area was estimated to be ≤75 μm.
Behavior.
Animals were water deprived under a protocol approved by the Cold Spring Harbor Laboratory Animal Committee.
Adult male Long–Evans rats (250–350 g) were trained to discriminate differences in the timing of electrical pulses delivered directly to the cortex implanted with two stimulation electrodes (Fig. 1A). For simultaneous stimulations of the two electrodes, animals had to go to the left port to get the water reward; for sequential stimulations with an interstimulus interval (ISI), animals had to go right to get reward. The only cue available to guide behavior was the relative timing of the activity elicited in the two stimulated populations. Animals were trained for 1–2 sessions each day. Each session contained 200–400 trials.
Figure 1.
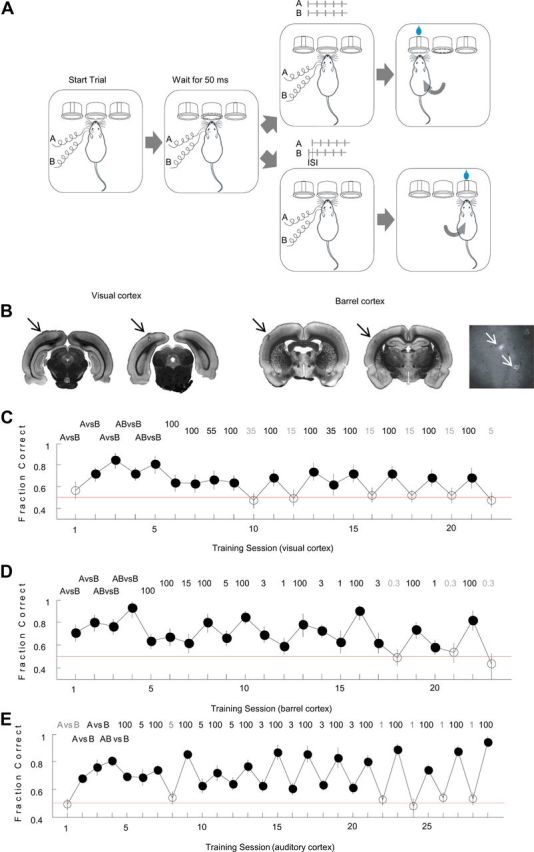
A, Experimental paradigm. Rats were implanted with two electrodes placed 1.1 mm apart, and trained to discriminate different cortical stimulation patterns. Stimuli consisted of trains of 5 pulses delivered either simultaneously (AB) or sequentially (A-ISI-B) through the two intracortical electrodes, stimulation frequency 50 Hz. Animals initiated trials by poking into a center port, which elicited a stimulus after a 50 ms delay. They were rewarded for selecting the correct reward port. B, Brain slices showing rostral (left) and caudal (right) electrode positions in visual and barrel cortices. Arrows point to the electrode positions. Cytochrome oxidase (CO) staining was used for barrel cortex. Far right panel shows CO staining of flattened barrel cortex. Arrows point to the electrode positions. C, Training history of a representative visually implanted rat. The performance on successive training sessions is plotted in chronological order. Number on top indicates ISI (ms) of the training session. Error bars indicate binomial proportion confidence interval for a 95% confidence level. Filled circles, Sessions in which the animal performed significantly above chance. Empty circles, Sessions in which performance was at chance level. D, Training history of a representative barrel cortex-implanted rat. E, Training history of a representative auditory-cortex-implanted rat (from Yang et al., 2008).
Histology.
We marked the electrode position by passing 0.9 mA DC current for 10 s through the stimulating electrodes. Then we immediately perfused the animal with 4% paraformaldehyde. We sliced the brain 24 h after perfusion (Fig. 1B). For some barrel cortex-implanted animals, we did cytochrome oxidase staining (Land and Simons, 1985) to mark the barrels (Fig. 1B, bottom right).
Sensory deprivation.
We obtained pregnant rats of embryonic day 14 (E14)–E16. We observed the pregnant rats closely. Immediately after they gave birth, we trimmed the whiskers of the pups, within 12 h after birth. All whiskers were trimmed on one side, including the identified whiskers from A–E rows (arcs 1–5 of 8), and the Greek whiskers. Whiskers were trimmed every 24 h until adulthood [postnatal day 0 (P0)∼P60].
Before P12, rat pups were held in place by hand, and whiskers where trimmed without anesthesia. After P12, animals were anesthetized with 2% isoflurane before whisker trimming, and were insensible during the procedure.
Curve fitting and statistics.
We fitted the mean best performances of different groups of rats with a cumulative Weibull Function (Wichmann and Hill, 2001): performance = 0.5 + (a − 0.5) * (1 − exp (−(ISI/b)c)). Parameter a is the asymptotic performance. For the task AB versus B, ISI is infinite. For fitting, we used 5000 as ISI for AB versus B.
We fitted the learning curve with Weibull Function: performance = 0.5 + (a − 0.5) * (1 − exp(−session/tau)). Parameter a is the asymptote performance, and tau is the time constant. In Figures 2B and 3D, we plotted the fitted curves using average asympotote performance of all 3 or 2 groups, respectively.
Figure 2.
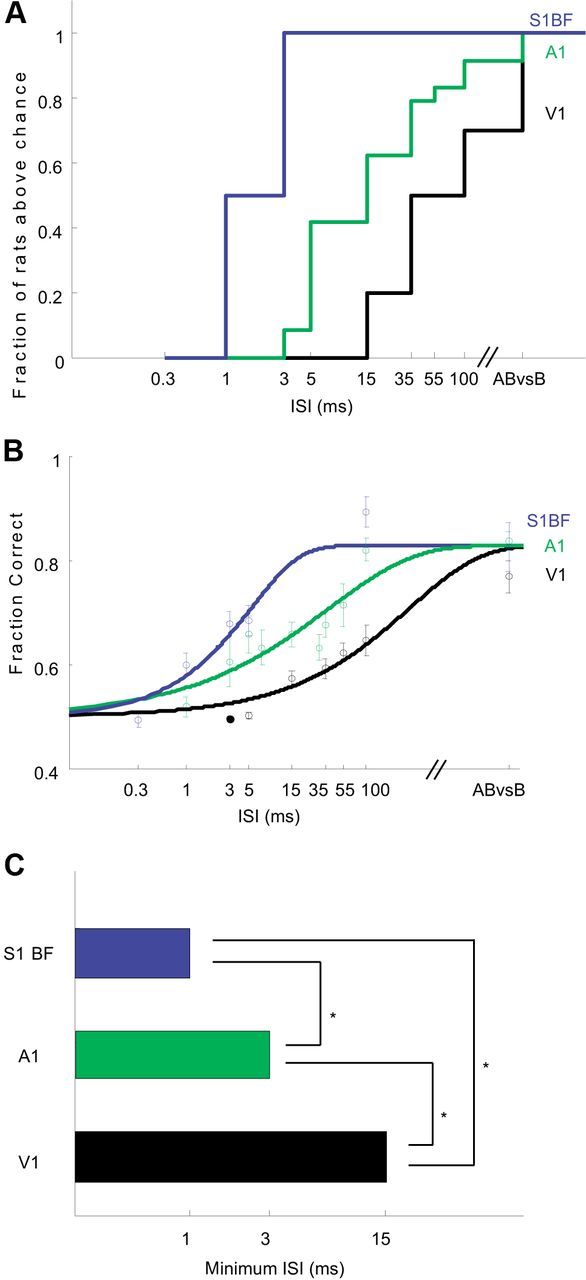
Different cortical areas differ in their ability to detect fine timing. A, Cumulative histogram showing fraction of animals able to discriminate each ISI for auditory (N = 26), visual (N = 10) and barrel (N = 6) cortex stimulation. The barrel cortex is most sensitive to fine temporal differences, followed by auditory cortex, followed by visual cortex. Auditory data reanalyzed from reference (Yang et al., 2008). B, The mean best performances as a function of ISI for different groups of rats recapitulates the sequence barrel>auditory>visual. Data were fit using cumulative Weibull Function (Wichmann and Hill, 2001; see Materials and Methods). C, Minimum detectable ISI for different cortices. Significance at 5% level by Fisher exact test.
Figure 3.

Sensory deprivation impairs the ability of barrel cortex to exploit fine neural timing. A, Sensory deprivation paradigm. Facial whiskers were trimmed unilaterally every 24 h from P0 to P60. Stimulation electrodes were later implanted in the contralateral barrel cortex (experimental group) or ipsilateral barrel cortex (control group 1) and nondeprived barrel cortex (control group 2). Control groups 1 and 2 did not show any difference in performance (p = 0.6, two-way ANOVA) and, therefore, were grouped together for analysis. B, Training history of a representative sensory deprived rat. C, Cumulative histogram showing fraction of barrel cortex-implanted control and sensory deprived animals able to perform each timing task. D, The mean best performances of control and sensory deprived rats.
We used confidence intervals for the error bars of the performance of each session. We computed the significance for each session assuming a binomial distribution, the null hypothesis being equal probability of obtaining correct trial and incorrect trial. We set the threshold for significance at p = 0.01. For each session, p < 0.01 means that by chance the probability of obtaining this performance or better was <1%.
Results
We delivered pairs of electrical pulses directly to different areas of cortex to determine the minimum timing differences subjects could detect. We first compared stimulation in visual cortex to previous results (Yang et al., 2008) for stimulation in auditory cortex. We then tested stimulation of the barrel cortex. Finally, we compared stimulation of barrel cortex in sensory-deprived animals with stimulation of untreated controls.
Visual cortex cannot discriminate short timing differences
The training history of a representative subject is shown in Figure 1C. Following implantation, the subject was trained first on a simple microstimulation task with no timing component, in which the subject was required to discriminate simultaneous stimulation of both electrodes from stimulation of just one (AB vs B). We then introduced a timing component, requiring that the subject discriminate between simultaneous and sequential stimulation (AB vs B-ISI-A). We systematically varied the ISI, beginning with ISI = 100 ms, and then gradually reducing the ISI on subsequent sessions until the animal could no longer perform significantly above chance (p < 0.01, red line at 0.5). In this example, the subject could discriminate stimuli separated by ISI = 100 and 35 ms, but not could not discriminate ISI = 15 or shorter even after multiple sessions. Across the population, of the 10 subjects that learned the stimulation task in visual cortex which involved no timing component (AB vs B), the majority (7 of 10) could discriminate ISI = 100. However, only a minority (2 of 6) could discriminate ISI = 15 ms, and no subject (0 of 7) could discriminate ISI = 5 ms (Fig. 2A). For the auditory cortex, however, most rats were able to perform short timing tasks down to 5 ms (11 of 13 for ISI = 35 ms, 6 of 8 for 15 ms, 5 of 7 for 7 ms, 10 of 15 for 5 ms), 2 animals (of 7) could even perform above chance for ISI = 3 ms (an example is shown in Fig. 1E, data from Yang et al., 2008). Thus the minimum discriminable ISI in this paradigm for visual cortex is between 5 and 15 ms, considerably longer than the minimum (between 1 and 3 ms) under comparable conditions for auditory cortex (Fig. 2A–C).
Barrel cortex can read out timing information as short as 1 ms
Given the marked differences in the ability of rats to exploit fine timing information from auditory versus visual cortex, we wondered whether one of these areas was somehow anomalous. We therefore repeated these experiments in a third primary sensory area, the primary barrel cortex, which processes information from whiskers (Simons, 1978). As before, we first trained subjects on a task (AB vs B) without a timing component, and then introduced different ISIs. Timing thresholds in barrel cortex were markedly shorter than in visual cortex. All (6 of 6) subjects could discriminate ISIs as short as 3 ms. Surprisingly, 3 of 6 subjects could discriminate ISI = 1 ms, surpassing even the most sensitive of the auditory cortex-implanted animals. Only upon further reduction of the ISI to 0.3 ms did performance in all barrel implanted animals fall to chance levels (an example is shown in Fig. 1D; see also Fig. 2A–C). Performance on the initial task (AB vs B), which did not require a timing discrimination, was indistinguishable across visual, auditory and barrel cortex-implanted animals (mean performance: Student's t test, p > 0.1 for any two comparisons, Fig. 2B). Even when the analysis was limited to those visual cortex-implanted animals (N = 3) for which performance on the nontemporal (AB vs B) task was better than the average of the barrel cortex-implanted animals, performance on the temporal tasks was dramatically impaired, indicating that that the temporal deficits observed in the visual cortex-implanted animals were specific to timing and did not reflect a generalized inability to respond to intracortical stimulation. In the short timing tasks, the fraction of rats able to perform 5 ms, 3 ms and 1 ms tasks was significantly higher for barrel cortex-implanted animals compared with auditory cortex-implanted animals (Fisher's exact test, p < 0.02, Fig. 2A) and visual cortex-implanted animals (Fisher's exact test, on 5 ms task only, p = 0.0001, Fig. 2A). Moreover, the different performances among areas appeared to reflect limitations of different cortical areas rather than differences in learning: if a subject failed to discriminate a particular ISI above chance on the first or second session, performance rarely improved upon further training (e.g., in Fig. 1C, the subject failed to discriminate ISI = 15 ms even after 4 training sessions, whereas it learned ISI = 100 and 55 ms in the first session, and 35 ms in the second). Thus barrel cortex-implanted animals outperformed both auditory and visual cortex-implanted animals in their ability to exploit finely timed neural activity, indicating that the ability to exploit fine timing information varies greatly among areas.
Sensory deprivation causes deficits in exploiting fine timing information
How do these differences among different areas arise? The temporal statistics of auditory, visual and somatosensory stimuli may be quite different, raising the possibility that the differential processing we observed might arise as an experience-dependent adaptation to the different stimulus ensembles. We therefore tested whether these differences are innate, or whether disruption of sensory stimulus statistics during development could affect the ability of different areas to exploit fine timing. We focused on the barrel cortex, reasoning that because the barrel cortex-implanted subjects achieved the best performance, this area might be the most sensitive to disruption. We used a sensory deprivation paradigm—complete unilateral whisker trimming from birth to adulthood—which has previously been shown to disrupt the normal development of barrel cortex circuitry (Simons and Land, 1987; Fox, 1992; Fig. 3A). In test animals we implanted stimulation electrodes in the barrel cortex contralateral to the deprived whiskers. We also implanted a control group with electrodes in the ipsilateral barrel cortex; since inputs from the whiskers project exclusively to the contralateral cortex (Hall and Lindholm, 1974; Welker, 1976), this group controls for nonspecific effects arising from deprivation.
Contralateral whisker deprivation had no effect on subjects' ability to perform the microstimulation task which involved no timing component (AB vs B), suggesting that the organization of the barrel cortex was not grossly disrupted (mean performance comparison between barrel cortex-implanted control and sensory deprived animals: p = 0.57, Student's t test; Fig. 3D). For the finer temporal discriminations, sensory deprivation led to deficits. Only 4 of 8 deprived animals could discriminate ISI = 3 ms (vs 9 of 9 control subjects, p = 0.0095, Fisher's exact test, Fig. 3C), and none could discriminate ISI = 1 ms. Performance was also impaired (Fig. 3D; p = 7*10−9, two-way ANOVA between deprived and control group with repeated measures on ISIs). Thus the ability to exploit fine spike timing depends partly on appropriate prior sensory experience.
The behavioral deficit can be partly rescued by training
Further analysis revealed a striking difference in the rate of learning in control vs deprived subjects. Control subjects learned the timing tasks more quickly, typically reaching asymptotic performance within the first two or three sessions, whereas in deprived subjects performance improved gradually with training over as many as a dozen sessions (Fig. 4A,C). To compare the learning rate of the two groups, we fit an exponential function to the learning curve of each animal (see Materials and Methods). Learning rates were significantly slower in the deprived subjects for both the 100 ms (tau = 2.2 vs 9.6 sessions; Student's t test, p = 0.0028, Fig. 4B) and 5 ms (tau = 3.1 vs 13.9 sessions; p = 0.0004) tasks. Learning in the visual and auditory cortex-implanted animals was also fast (tau = 1.3 and 1.5, 100 ms task; Student's t test for each two groups, p > 0.1, Fig. 4C) indicating that the slow learning was the result of deprivation per se and not simply due to the impaired ability to learn fine timing. Analysis of the number of sessions needed to achieve above-chance performance gave similar results for 100 and 5 ms tasks (p = 0.0098 and 0.0004, respectively), but not for AB vs B task (p = 0.19), suggesting that the ability to detect cortical stimulation per se (as opposed to timing differences) was unaffected. Thus although sensory deprivation initially impaired the ability of animals to exploit fine timing information, this impairment could be at least partially overcome by training.
Figure 4.
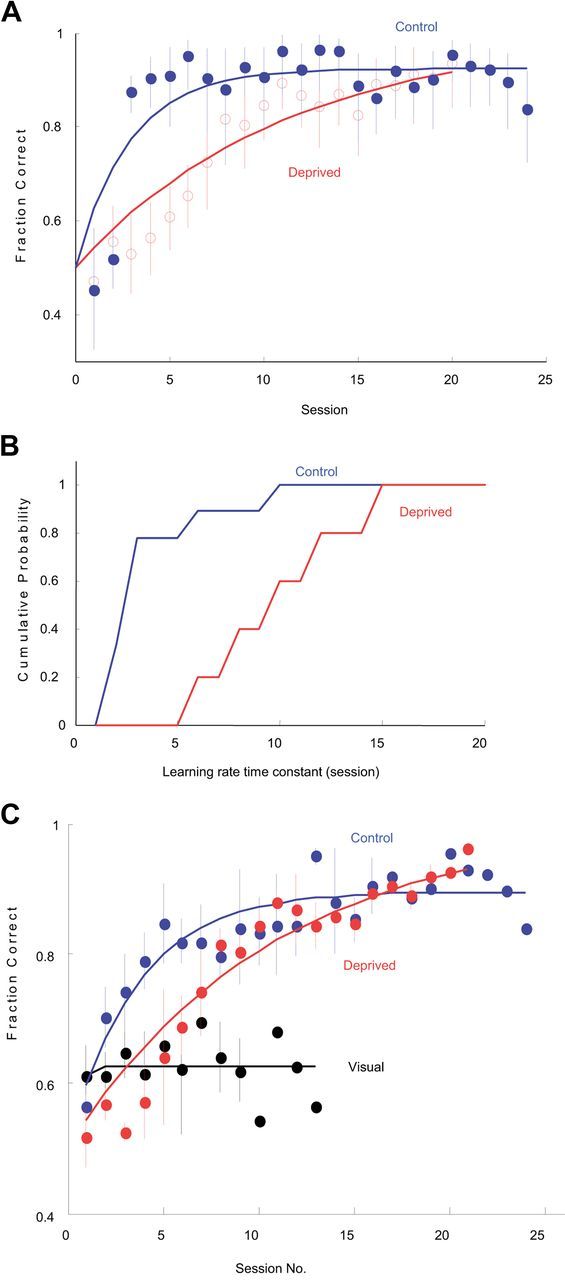
Impairment in fine timing discrimination of sensory deprived animals was partially rescued by training. A, Training history on ISI = 100 ms task of a barrel cortex control animal (blue) and a barrel cortex sensory deprived animal (red). Each closed or open point indicates one training session. Data were fit with an exponential function (see Materials and Methods). B, Cumulative histogram showing comparison of learning rates on the ISI = 100 ms task for control (blue) and sensory deprived (red) animals. C, Median performance of barrel cortex control, sensory deprived, and visual cortex-implanted animals at 100 ms across days. In normal animals (as opposed to sensory deprived animals), extensive training led to very little increase in performance. As is shown, visual cortex-implanted animals showed no improvement even after 2 weeks of training.
Discussion
We have shown that different sensory cortices differ in their ability to exploit fine timing. These differences may in part reflect adaptations to the temporal statistics of the stimuli encountered in each modality: although it is difficult to compare typical auditory, somatosensory and visual stimulus ensembles rigorously, we have the intuition that audition and whisker sensation (Ahissar and Arieli, 2001) are “faster” modalities. These differences also raise the intriguing possibility that the importance of spiking timing in the neural code may vary with cortical region; in this view, visual cortex may be less disposed to make use of a “timing code” than other sensory cortices.
Although we have demonstrated behaviorally relevant differences among cortical areas, our results suggest a refinement rather than an invalidation of the idea that the stereotypy of cortical circuitry implies commonality in the computations these areas perform. Many “canonical” electrical circuits are designed to include a few convenient free parameters which can be adjusted as needed. A bandpass filter for example, might include knobs which control the low- and high-pass cutoffs. We suggest that although the canonical cortical circuit may perform the same basic computation across areas, our experiments have uncovered a “knob” which is twiddled in a use-dependent way to tune each area to the statistics of the spike trains it receives. Presumably the setting of this knob reflects a tradeoff between temporal sensitivity and other considerations, such as the ability to integrate over longer times or across many neurons. Our findings provide a foundation for understanding how different cortical areas adjust their function to suit their inputs.
Footnotes
This research was supported by grants from the Swartz Foundation, the National Institutes of Health, and the Marie Robertson Fund.
References
- Ahissar E, Arieli A. Figuring space by time. Neuron. 2001;32:185–201. doi: 10.1016/s0896-6273(01)00466-4. [DOI] [PubMed] [Google Scholar]
- Bair W, Koch C. Temporal precision of spike trains in extrastriate cortex of the behaving macaque monkey. Neural Comput. 1996;8:1185–1202. doi: 10.1162/neco.1996.8.6.1185. [DOI] [PubMed] [Google Scholar]
- Brand A, Behrend O, Marquardt T, McAlpine D, Grothe B. Precise inhibition is essential for microsecond interaural time difference coding. Nature. 2002;417:543–547. doi: 10.1038/417543a. [DOI] [PubMed] [Google Scholar]
- Buracas GT, Zador AM, DeWeese MR, Albright TD. Efficient discrimination of temporal patterns by motion-sensitive neurons in primate visual cortex. Neuron. 1998;20:959–969. doi: 10.1016/s0896-6273(00)80477-8. [DOI] [PubMed] [Google Scholar]
- DeWeese MR, Wehr M, Zador AM. Binary spiking in auditory cortex. J Neurosci. 2003;23:7940–7949. doi: 10.1523/JNEUROSCI.23-21-07940.2003. [DOI] [PMC free article] [PubMed] [Google Scholar]
- Douglas RJ, Martin KA. Neuronal circuits of the neocortex. Annu Rev Neurosci. 2004;27:419–451. doi: 10.1146/annurev.neuro.27.070203.144152. [DOI] [PubMed] [Google Scholar]
- Fox K. A critical period for experience-dependent synaptic plasticity in rat barrel cortex. J Neurosci. 1992;12:1826–1838. doi: 10.1523/JNEUROSCI.12-05-01826.1992. [DOI] [PMC free article] [PubMed] [Google Scholar]
- Hall R, Lindholm E. Organization of motor and somatosensory neocortex in the albino rat. Brain Res. 1974;66:23–28. [Google Scholar]
- Heil P. Auditory cortical onset responses revisited. I. First-spike timing. J Neurophysiol. 1997;77:2616–2641. doi: 10.1152/jn.1997.77.5.2616. [DOI] [PubMed] [Google Scholar]
- Houweling AR, Brecht M. Behavioural report of single neuron stimulation in somatosensory cortex. Nature. 2008;451:65–68. doi: 10.1038/nature06447. [DOI] [PubMed] [Google Scholar]
- Huber D, Petreanu L, Ghitani N, Ranade S, Hromádka T, Mainen Z, Svoboda K. Sparse optical microstimulation in barrel cortex drives learned behaviour in freely moving mice. Nature. 2008;451:61–64. doi: 10.1038/nature06445. [DOI] [PMC free article] [PubMed] [Google Scholar]
- Jeffress LA. A place theory of sound localization. J Comp Physiol Psychol. 1948;41:35–39. doi: 10.1037/h0061495. [DOI] [PubMed] [Google Scholar]
- Land PW, Simons DJ. Cytochrome oxidase staining in the rat SmI barrel cortex. J Comp Neurol. 1985;238:225–235. doi: 10.1002/cne.902380209. [DOI] [PubMed] [Google Scholar]
- Neafsey EJ, Bold EL, Haas G, Hurley-Gius KM, Quirk G, Sievert CF, Terreberry RR. The organization of the rat motor cortex: a microstimulation mapping study. Brain Res. 1986;396:77–96. doi: 10.1016/s0006-8993(86)80191-3. [DOI] [PubMed] [Google Scholar]
- Ohki K, Chung S, Ch'ng YH, Kara P, Reid RC. Functional imaging with cellular resolution reveals precise micro-architecture in visual cortex. Nature. 2005;433:597–603. doi: 10.1038/nature03274. [DOI] [PubMed] [Google Scholar]
- Oviedo HV, Bureau I, Svoboda K, Zador AM. The functional asymmetry of auditory cortex is reflected in the organization of local cortical circuits. Nat Neurosci. 2010;13:1413–1420. doi: 10.1038/nn.2659. [DOI] [PMC free article] [PubMed] [Google Scholar]
- Shams L, Kamitani Y, Shimojo S. Illusions. What you see is what you hear. Nature. 2000;408:788. doi: 10.1038/35048669. [DOI] [PubMed] [Google Scholar]
- Shepherd GM, Svoboda K. Laminar and columnar organization of ascending excitatory projections to layer 2/3 pyramidal neurons in rat barrel cortex. J Neurosci. 2005;25:5670–5679. doi: 10.1523/JNEUROSCI.1173-05.2005. [DOI] [PMC free article] [PubMed] [Google Scholar]
- Simons DJ. Response properties of vibrissa units in rat SI somatosensory neocortex. J Neurophysiol. 1978;41:798–820. doi: 10.1152/jn.1978.41.3.798. [DOI] [PubMed] [Google Scholar]
- Simons DJ, Land PW. Early experience of tactile stimulation influences organization of somatic sensory cortex. Nature. 1987;326:694–697. doi: 10.1038/326694a0. [DOI] [PubMed] [Google Scholar]
- Welker C. Receptive fields of barrels in the somatosensory neocortex of the rat. J Comp Neurol. 1976;166:173–189. doi: 10.1002/cne.901660205. [DOI] [PubMed] [Google Scholar]
- Wichmann FA, Hill NJ. The psychometric function: I. Fitting, sampling, and goodness of fit. Percept Psychophys. 2001;63:1293–1313. doi: 10.3758/bf03194544. [DOI] [PubMed] [Google Scholar]
- Yang Y, DeWeese MR, Otazu GH, Zador AM. Millisecond-scale differences in neural activity in auditory cortex can drive decisions. Nat Neurosci. 2008;11:1262–1263. doi: 10.1038/nn.2211. [DOI] [PMC free article] [PubMed] [Google Scholar]