

Abstract
Biocompatible and biodegradable peptide hydrogels are drawing increasing attention as prospective materials for human soft tissue repair and replacement. To improve the rather unfavorable mechanical properties of our pure peptide hydrogels, in this work we examined the possibility of creating a double hydrogel network. This network was created by means of the co-assembly of mutually attractive but self-repulsive oligopeptides within an already existing fibrous network formed by the charged, biocompatible polysaccharides chitosan, alginate, and chondroitin. Using dynamic oscillatory rheology experiments, it was found that the co-assembly of the peptides within the existing polysaccharide network resulted in a less stiff material as compared to the pure peptide networks (the elastic modulus G′ decreased from 90 kPa to 10 kPa). However, these composite oligopeptide-polysaccharide hydrogels were characterized by a greater resistance to deformation (the yield strain γ grew from 4 % to 100 %). Small-angle neutron scattering (SANS) was used to study the 2D cross-sectional shapes of the fibers, their dimensional characteristics and the mesh sizes of the fibrous networks. Differences in material structures found with SANS experiments confirmed rheology data showing that incorporation of the peptides dramatically changed the morphology of the polysaccharide network. The resulting fibers were structurally very similar to those forming the pure peptide networks, but formedless stiff gels because of their markedly greater mesh sizes. Together, these findings suggest an approach for the development of highly deformation-resistant biomaterials.
Keywords: oligopeptide, polysaccharide, hydrogel, rheology, mechanical strength, small-angle neutron scattering (SANS), cross-section analysis, mesh size
Introduction
Self-assembling peptide hydrogels have become increasingly popular materials for tissue engineering,1,2 drug delivery3,4 and cell culture applications.5 Flexibility of peptide sequence design and relative ease of synthesis make peptide hydrogels highly tunable, both chemically and mechanically. Tunability of the peptide building blocks allows for substantial manipulation of bulk material properties. Despite the versatility of peptide hydrogels, these materials remain mechanically weak. Promising methods involving cross-linking by enzymatic oxidation,6 electrostatic interactions,7 interplay between hydrophilic and hydrophobic interactions,8 and disulfide bonds9 have been used to significantly increase elastic moduli.
In this paper we draw upon another approach commonly used in materials research in order to modify the material properties of peptide hydrogels, by incorporating the fibers of other biopolymers into the peptide fiber network. By designing this composite network, we hoped to create a material with new and/or possibly improved visoelastic properties. Recently, Hosseinkhani et al. created a scaffold combining a peptide amphiphile with a collagen sponge in order to examine the release of growth factor and the formation of bone in the peptide-collagen scaffolds in vitro and in vivo.10 Increased strength and sustained release of growth factor, over a period of several weeks, demonstrates some of the promise of hybrid biomimetic scaffolds for drug delivery as well as for tissue engineering purposes.
Here, we propose to design novel biomaterials assembled based upon our earlier approach which involves electrostatic interactions.11 The polysaccharide portion of the material was assembled from chitosan, alginate and chondroitin. Previously, we found that the combination of these three polysaccharides resulted in a strong, flexible network formed through the electrostatic interactions of positively charged chitosan with negatively charged alginate and/or chondroitin.11 The peptide hydrogel portion of the material was comprised of one positively charged oligopeptide and one negatively charged oligopeptide. Based on the discovery that peptides with alternating charged/neutral sequence patterns could self-assemble into hydrogels,12 we previously developed a modular approach to the engineering of peptide-based hydrogels.13,14,15 Our general design separates positively and negatively charged amino acids into different peptide chains. As a result of the electrostatic repulsions inherent within each peptide module, spontaneous hydrogelation due to slight pH, temperature and ionic strength changes are avoided. When mixed, the two oppositely charged oligopeptides co-assemble into a hydrodel in phosphate buffered saline (PBS). The polysaccharide networks were premade and then mixed with the oligopeptide pair in solution so that the polysaccharide fibers could interact and form a network with the oligopeptide pair. Properties of the polysaccharide and peptide fibrous networks were examined as separate materials and mixed together. We hypothesized that since every component in this material is charged, interaction between polysaccharides and oligopeptides is highly likely, thereby increasing the total number of electrostatic interactions in this system and creating a material with new viscoelastic properties.
This study is focused on correlating the structures of separate oligopeptide and polysaccharide networks as well as composite oligopeptide-polysaccharide networks at the nanoscale level to their bulk viscoelastic properties. To this end, dynamic oscillatory rheology experiments probing the mechanical strength, dynamic network characteristics as well as the brittleness of each material were performed. These experiments were followed by the analysis of structural characteristics of the fibrous networks under study as well as the individual fiber dimensional characteristics using small angle neutron scattering (SANS).
Materials and Methods
Peptide design and synthesis
Oppositely charged peptide modules have been designed in accordance with an earlier approach13 whereby these co-assemble into a hydrogel when mixed due to electrostatic attractions. Both sequences are palindromic, and the N-, C- termini of each peptide module are acetylated (Acetyl-) and amidated (-amide), respectively, to block terminal charges. The positive sequence contains alternating positively charged (lysine, K) and neutral (tryptophan, W; and alanine, A) amino acids, while the negative sequence contains alternating negatively charged (glutamate, E) and neutral (tryptophan, W; and alanine, A):
Positive sequence: Acetyl-K-W-K-A-K-A-K-A-K-W-K-amide (KWK)
Negative sequence: Acetyl-E-W-E-A-E-A-E-A-E-W-E-amide (EWE)
Oligopeptides were synthesized on Rink-amide MBHA resin by means of a CEM microwave synthesizer using Fmoc solid-phase peptide synthesis.16 All amino acids and reagents were dissolved in 100 % dimethylformamide (DMF). The crude peptides were cleaved by a TFA/TIS/H2O (95/2.5/2.5) cocktail for 2 × 2 hours and the side chain protecting groups were removed at the same time. TFA was removed by rotary evaporation under reduced pressure, and then the crude peptides were precipitated and washed twice by cold ethyl ether.
The crude peptides were dissolved in water and lyophilized before purification. Preparative reverse-phase HPLC method was used to purify the crude peptides. In the purification of KWK, solvent A was 0.1 % mass fraction HCl in water and solvent B was 0.1 % mass fraction HCl in MeOH; in the EWE purification, solvent A was 20 mmol/L NH4HCO3 in water (pH 7.0), solvent B was 20 mmol/L NH4HCO3 (pH 7.0) in MeOH/water (8:2). Chromatographic method of peptide purification: 0–40 % B in 0–60 min, 40–100 % B in 60–90 min with linear gradient for each segment was performed. The purity of KWK and EWE was verified by reverse-phase HPLC analysis (see, Supporting Information). The solvents used were the same as for the preparative HPLC run. Molecular weights of KWK and EWE were verified by ESI-MS in positive and negative modes, respectively (see, Supporting Information).
Purified peptides were dissolved in phosphate-buffered saline at pH 7.4. Concentrations of the individual peptide solutions (16 mmol/L or 32 mmol/L) were determined on the basis of the molar absorptivity of tryptophan at 280 nm (ε280 = 5690 M−1 cm−1).17 All hydrogel measurements were conducted at a final concentration of 8 mmol/L of each peptide.
Materials used to prepare polysaccharide networks
Low molecular weight chitosan (50 to 190 kDa, Sigma-Aldrich), alginic acid sodium salt (350 to 450 kDa, Acros Organics), bovine chondroitin sulfate sodium salt (~20 kDa, Pfaltz & Bauer), hydrochloric acid (HCl, VWR) and ammonium hydroxide (NH4OH, Mallinckrodt Baker) were used as purchased.
Dynamic Rheometry
Sample Preparation
Five different samples were prepared and were labeled by their components (C = chitosan, A = alginate, D = chondroitin, P = peptides): chitosan+alginate hydrogel (CA), chitosan + alginate + chondroitin hydrogel (CAD), peptide hydrogel (P), chitosan + alginate + peptide hydrogel (CAP), and chitosan + alginate + chondroitin + peptide hydrogel (CADP). Stock solutions of chitosan, alginate and chondroitin were made in phosphate buffered saline (PBS) at 1.5 % mass fraction. Chitosan solution also required the addition of 1 % mass fraction HCl in H2O to dissolve. Stock solutions of both peptides were made in PBS at pH 7.4 at 4.54 % mass fraction (32 mmol/L). All sample preparation procedures and measurements were performed at 25 °C and the final pH for all samples was 7.4.
To prepare the CA network, stock solutions of chitosan and alginate were diluted to 0.5 % mass fraction by PBS, and equal volumes (1:1), 200 μL of each diluted solution were mixed together by simultaneous pipetting through a Y-shaped connector into the sealed cell of the rheometer. The measurements of gelation kinetics started immediately after mixing.
To prepare the CAD network, stock solutions of chitosan and alginate were diluted to 0.7 % mass fraction by PBS, and after mixing of 143 μL 0.7 % mass fraction chitosan with 143 μL 0.7 % mass fraction alginate in the rheometer cell through Y-shaped connector, the mixture was allowed to equilibrate for 2 hours (time necessary to build up of CA network estimated from the rheology experiments for CA network). Then 114 μL of chondroitin solution diluted to 0.28 % mass fraction (to get 7:1 chitosan/alginate to chondroitin weight ratio) was added to the mixture, immediately followed by rheological monitoring of the incorporation of chondroitin into the CA network resulting in the formation of CAD network.
To prepare the P network, stock solutions of individual KWK and EWE peptides were diluted to 2.27 % mass fraction (16 mmol/L) with PBS buffer at pH 7.4. Diluted solutions of the peptide modules were centrifuged separately for 10 min at 8,000 rpm, and 200 μL of each KWK and EWE peptides were mixed through Y-shaped connector in the sealed cell of rheometer, immediately followed by monitoring of the gelation process resulting in the P network.
The procedure for CAP network preparation was similar to the steps used for CAD networks described above. Stock solutions of chitosan and alginate were diluted to 1 % mass fraction, and 100 μL of each solution were mixed together in the sealed cell of the rheometer using a Y-shaped connector. After 2 hrs of equilibration (necessary to mature the CA network), pH of the network was measured and adjusted to 7.4 by addition of very small volumes (several μL) of concentrated NH4OH solution. Then, 100 μL of each 4.54 % mass fraction (32 mmol/L) KWK and EWE peptides solution were mixed with the matured chitosan/alginate network. Rheological measurements of gelation kinetics were started immediately.
To prepare the CADP network, stock solutions of chitosan and alginate were diluted to 1.33 % mass fraction by PBS and 75 μL of each solution were mixed in the sealed cell of the rheometer using a Y-shaped connector. The resulting mixture was equilibrated for 2 hrs (to get mature CA network), then 50 μL of chondroitin solution diluted to 0.64 % mass fraction by PBS was added, and the sample was equilibrated for another 10–12 hrs (time necessary for maturation of CAD network estimated from the rheology experiments for CAD network). Then, 100 μL of each 4.54 % mass fraction (32 mmol/L) KWK and EWE peptides solution were mixed with the matured chitosan+alginate+chondroitin network. Rheological measurements of gelation kinetics were started immediately.
In all samples final concentrations for components in each sample were (in % mass fraction): chitosan (0.25 %), alginate (0.25 %), chondroitin (0.076 %), two peptide modules together (2.25 % or 16 mmol/L). During the equilibration procedures, mixtures in the sealed cell were covered with parafilm to prevent sample drying.
Rheological Measurements
Dynamic rheological measurements were performed using a NOVA Rheometer (REOLOGICA Instruments, Inc., Sweden) featuring a null balance system which allows for nano-torque and nano-strain measurement control and analysis. The instrument is also equipped with a sealed-cell geometry which prevents dehydration of the water-based samples during prolonged measurements. In addition, to exclude possible dehydration of the sample at 25 °C, a simple in-house designed system was used to humidify the incoming air used for the sealed-cell. Rheological characterizations of the samples were performed using a 25 mm diameter cone-and-plate steel geometry. Time-sweep measurements were conducted at 0.2 % strain amplitude and 1 rad/s angular frequency. The data points were taken once every 180 s after two integrations with 5 s delay time, between the start of application of the respective stress and the start of data acquisition for calculations. This delay is necessary for equilibration of the plate before the torque measurement. After the time-sweep measurements, frequency-sweep measurements were conducted at the respective temperatures with 0.2 % strain amplitude, while the frequency was varied from 0.01 to 100 rad/s in a log mode with 18 data points per frequency decade. In the frequency-sweep experiment, the number of integration cycles, Nc, was varied from 1 to 500. The greater number of integration cycles corresponds to higher frequency values. Nc ≈ 1 + 500 × (ωi/ωmax), where ωi is the angular frequency of the i-th measurement, ωmax is the maximum angular frequency, and here ωmax = 100 rad/s. The delay time between the start of application of the respective frequency and stress and the start of data acquisition for calculations was varied from 65 s to 5 s, in reciprocal proportion to the frequency. After the frequency-sweep measurements and before the strain-sweep measurements, a time-sweep of 3 hr was performed on the gel at 0.2 % strain amplitude, 1 rad/s frequency to confirm that the gel remains undisturbed by the frequency-sweep (see, Supporting Information). Strain-sweep measurements were then performed with a single integration cycle at 1 rad/s frequency, within the range of strain amplitudes from 0.1 % to 100 % in a log mode with 23 data points per decade.
Small-Angle Neutron Scattering (SANS)
Sample Preparation
The conditions and procedures for the preparation of the networks for SANS studies were described in the details above for the dynamic rheology. All samples were made inside titanium cells with 1-mm path length and quartz windows 30 mm in diameter, which are routinely used for SANS measurements at the National Institute of Standards and Technology (NIST) Center for Neutron Research (NCNR). For the mixed oligopeptide-polysaccharide networks, the preparation steps and time for equilibration of the intermediate mixtures before the addition of 3rd and/or 4th component were exactly the same as described above for rheological experiments. Since no kinetic measurements were performed using SANS, all samples were prepared at least 72 hrs before the measurements (time necessary to make CAP and/or CADP networks was estimated from the rheology experiments).
SANS Structural Analysis
Structures of the networks were investigated using the 30 m SANS instrument (NG-7) at NIST.18 Monochromatic neutrons at λ = 6 Å with a wavelength spread (Δλ/λ) of 0.14 were detected on a 64 cm × 64 cm two-dimensional detector. Data on SANS intensity were collected with a Q-range from 0.001 Å−1 to 0.4 Å−1 at 25°C. Q is the scattering vector and is related to the wavelength λ and the scattering angle θ by
| (1) |
The instrument has pinhole geometry. Scattering intensities were normalized using direct beam transmission measurements and were reduced according to published protocols.19,20 Processing of the data was performed using IGOR 6.2/IRENA software21 to obtain characteristics at the levels of fiber building and packing. To estimate the density of the cross-linking networks in the samples, the Debye-Bueche model22 was used in the following form
| (2) |
where Lc is the correlation length. The correlation length of a network is a measure of the spatial extent of the cross-linking regions and reflects the average mesh size. A larger correlation length value correlates with a larger average mesh size.23
Mass-fractal dimensions were estimated using the fractal model (Dr. A. Allen, NIST) implemented in IRENA and described in detail within the program. Fractal analysis is often used to analyze materials that have a repetitive unit, an elementary “building brick” which is appropriate for our oligopeptide/polysaccharide systems. Fractal analysis is done in the high-Q region of the I(Q) vs. Q plot. This region corresponds to a range of distances smaller than the size of the scattering objects so that the scattered neutrons are probing the local structure of the hydrogel network. The fractal dimension (d) in mass-fractal analysis is a number ranging from 1 to 3, and defines the structural characteristics of the “building brick.” For instance, d is 1 in the case of stiff rod-like repetitive units; d is 2 for the Gaussian-coil-shaped structures, and d is 5/3 for the swollen Gaussian-coils in a good solvent, whereas a value of 2 or greater corresponds to a degree of branching.24 Scattering from a mass-fractal is given as
| (3) |
where d is the slope of the LogI(Q) vs. LogQ plot (in the Supplemental information) and B is the prefactor indicative of dimensional characteristics of a repetitive unit reflecting its degree of swollenness.
The networks under study are formed of fibers with one dimension (length) much longer than the other two (cross-sectional dimensions), and the length of the fibers exceeded the resolution limit (Qmin) of the scattering data (in our case Qmin ~ 0.001 Å−1 which means that the maximum length we can reliably characterize is ~ 2000 Å). Therefore, we analyzed the scattering data in terms of the cross-sectional dimensions of the scattering particles using standard approach of multiplication of I(Q) by Q, thereby essentially removing the information about the length of the scattering particles.25
We used a simulated annealing algorithm which follows the common approach used for 3D dummy atom shape restoration of the scattering particle.26 However, we implemented the algorithm in a purpose-written program that is described elsewhere,27 to model the 2D cross-sectional shape of the fibers under study. In all these calculations, the dummy atoms were arranged on a flat grid of 50 × 100 close-packed dummy atoms. The size of each atom was 5 Å. The program calculated the pair distance or vector length distribution function, Pc(r), for the model cross-section composed of the dummy atoms. Pc(r) is the distribution of distances between area elements in the cross section, weighted by the scattering density at each radial value, r. The Fourier transformation of Pc(r) yields the model scattering profile for cross-section QImod(Q). In the optimization procedure, the program minimized the discrepancy between the model scattering data Imod(Q) and the experimental scattering data Iexp(Q).27 After optimization, values for zero-angle scattering intensity Ic(0), the area of the cross-section Sc, maximum cross-sectional dimension Dmax, and the radius of gyration of the cross-section Rc, were determined from Pc(r); Dmax was the r value at which Pc(r) goes to 0. The zeroth and the second moments of Pc(r) yield Ic(0) and Rc values, respectively. The radius of gyration of the cross-section Rc was the contrast-weighted mean distance of all area elements from the center of scattering density. The program also outputs the model cross-sections as atomic coordinate files in the Protein Data Bank format which allowed their pictorial presentation. Corrections for scaling and incoherent background were applied to the model scattering profile so it could be compared directly with experimental scattering data.27
We have also explored three-dimensional morphology of mixed oligopeptide-polysaccharide hydrogels using the program SAXSMorph.28 2D slices of the hydrogel bulks created by SAXSMorph were then analyzed using the NIH image analysis program ImageJ (see, Supporting Information).29
Results and Discussion
Mechanical Properties of Mixed Oligopeptide-polysaccharide Hydrogels
Time-sweep rheological monitoring of the gelation kinetics of CA (Figure 1(A)) showed that pairing of positively charged chitosan and negatively charged alginate resulted in a very weak material with an elastic modulus G′ value of only ~ 100 Pa. While the viscous modulus G″ was lower than G′, the value of the phase angle δ was still only around 30°, which is indicative of a weak hydrogel network. The frequency spectrum (Figure 1(B)) suggests that the CA hydrogel is rather mobile showing strong growth in G′ at higher frequencies due to relaxation, with an evident maximum of G″ at frequencies around 20 rad/sec. At the same time, the fibrous network formed by the CA did not show the signs of break, up to 100 % strain (γ) (Figure 1(C)). Addition of chrondroitin to CA resulted in the incorporation of chondroitin into the already formed CA network. This is evident from further slow growth in the G′ value, which within ~8–10 hours plateaued at ~ 400 Pa (Figure 2(A)). The resulting CAD hydrogel was characterized by a smaller phase angle as compared to CA (δ ~ 9°). However, the frequency spectrum of CAD was very similar to that of CA and is also characteristic of a mobile gel where G′ is growing at higher frequencies due to relaxation, and a maximum G″ observed around 90 rad/sec (Figure 2(B)). Unlike CA, in strain-sweep experiments CAD demonstrated apparent shear-thinning properties (cf. Figure 1(C) and Figure 2(C)). Yet, CAD was very elastic and retained a low phase angle value (δ ~ 12°) up to γ ~ 100 % (Figure 2(C)).
Figure 1.

Dynamic oscillatory rheological characterization of polysaccharide network CA (chitosan + alginate). (A) Time-sweep monitoring of gelation kinetics; plateau G′ ~ 100 Pa; final δ ~ 30°. (B) Frequency-sweep after viscoelastic modulus reached plateau, max G″ at ω ~ 20 rad/sec. (C) Strain-sweep performed after frequency-sweep and 3 hrs of equilibrating time sweep (see, Materials and Methods). Elastic modulus G′ (open circles); viscous modulus G″ (solid circles); shear modulus G (triangles).
Figure 2.
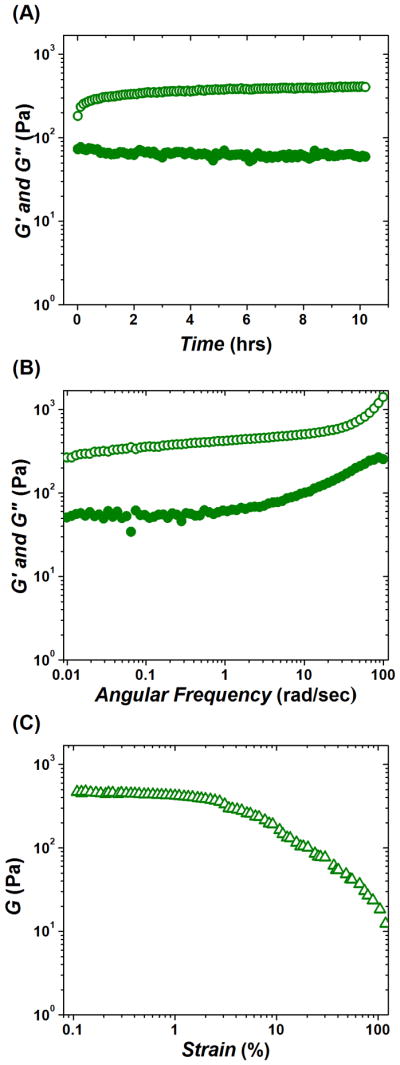
Dynamic oscillatory rheological characterization of polysaccharide network CAD (chitosan + alginate + chondroitin); chondroitin added 3 hrs after mixing of chitosan and alginate. (A) Time-sweep monitoring of gelation kinetics after addition of chondroitin to CAD network; plateau G′ ~ 400 Pa; final δ ~ 9°. (B) Frequency-sweep after viscoelastic modulus reached plateau, max G″ at ω ~ 90 rad/sec. (C) Strain-sweep performed after frequency-sweep and 3 hrs of equilibrating time-sweep (see, Materials and Methods). Elastic modulus G′ (open circles); viscous modulus G″ (solid circles); shear modulus G (triangles).
Gelation of the peptide pair KWK+EWE continued for ~ 48 hours after mixing and resulted in a fairly stiff hydrogel P with a plateau G′ ~ 90 kPa (Figure 3(A)). As opposed to both polysaccharide networks CA and CAD, peptide hydrogel P formed a very stable, solid-like material. The observed log G′(ω) and G″(ω) profiles showed a small dependence on the frequency within the studied range from 0.01 rad/sec to 100 rad/sec. This result confirms the formation of a solid-like hydrogel network with little or no mobility at time scales up to t = 2π/ω ~ 600 sec, i.e., up to the longest measurement duration (Figure 3(B)). Also unlike CA and CAD, P was more brittle (yields at γ ~3–4 %) and completely broke into a very inhomogeneous mass above γ ~ 6 % (Figure 3(C)).
Figure 3.
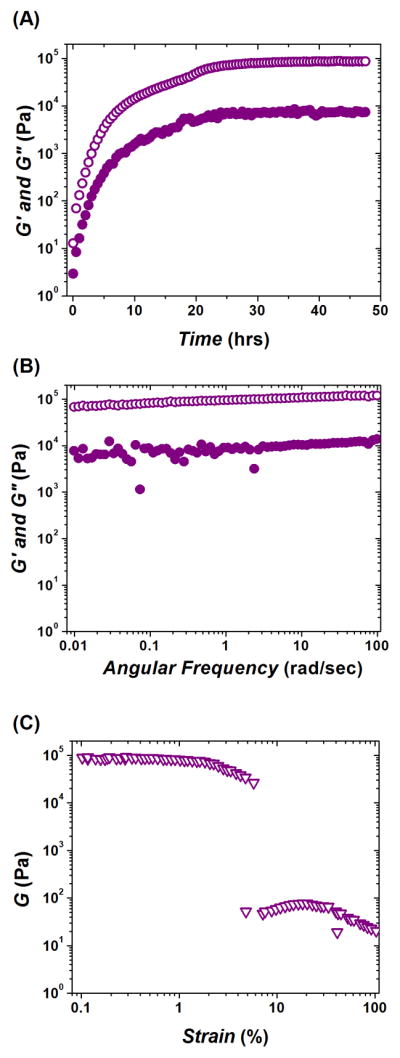
Dynamic oscillatory rheological characterization of peptide hydrogel P (formed by mixing two oppositely charged undecapeptides KWK and EWE). (A) Time-sweep monitoring of gelation kinetics; plateau G′ ~ 90 kPa. (B) Frequency-sweep after viscoelastic modulus reached plateau. (C) Strain-sweep performed after frequency-sweep and 3 hrs of equilibrating time-sweep (see, Materials and Methods); yield strain value γ ~ 3–4 %; complete break of hydrogel at γ ~ 6 %. Elastic modulus G′ (open circles); viscous modulus G″ (solid circles); shear modulus G (triangles).
In order to incorporate the oligopeptide fibers into the polysaccharide networks, we conducted the gelation process by mixing individual peptide modules KWK and EWE with an already existing CA network. Interaction of charged peptides with the CA network is evident from the observed growth in the viscoelastic moduli, which in 72 hrs after adding of KWK and EWE results in a plateau G′ ~ 10 kPa (Figure 4(A)). The resulting composite CAP gel was significantly less stiff as compared to the pure peptide network P (cf. Figure 3(A)), and showed a slightly high phase angle, δ ~ 17°. However, mutually attractive KWK and EWE incorporated into the CA gel markedly stabilized the assembled CAP network. The frequency sweep (Figure 4(B)) was characteristic of a stable, solid-like material. Similarly to the P gel (cf. Figure 3(B)), CAP showed little mobility up to 600 sec. Unlike the P gel, the presence of CA fibers within the peptide hydrogel network improved the strain resistance of CAP (Figure 4(C)) and made it virtually unbreakable. Even at the highest strain value (γ ~ 100 %), δ still remained around 25–30° (< 45°).
Figure 4.
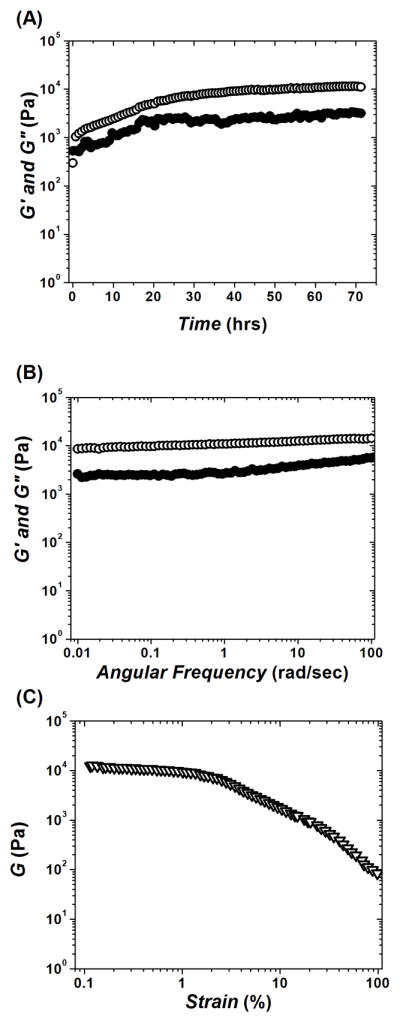
Dynamic oscillatory rheological characterization of mixed hydrogel CAP (formed by incorporation of two oppositely charged undecapeptides KWK and EWE into existing CA network). (A) Time-sweep monitoring of gelation kinetics; plateau G′ ~ 10 kPa; final δ ~ 17°. (B) Frequency-sweep after viscoelastic modulus reached plateau. (C) Strain-sweep performed after frequency-sweep and 3 hrs of equilibrating time-sweep (see, Materials and Methods); retaining δ ~ 25–30° even at strain values γ ~ 100 %. Elastic modulus G′ (open circles); viscous modulus G″ (solid circles); shear modulus G (triangles).
The elastic behavior in the composite oligopeptide-polysaccharide hydrogels became even more evident when oppositely charged KWK and EWE peptides co-assembled within the already matured CAD network. After 72 hrs of gelation, the resulting CADP hydrogel reached the same plateau value of elastic modulus (G′ ~ 10 kPa) as was observed in the case of CAP hydrogel (cf. Figure 5(A) and Figure 4(A)). However, unlike CAP, CADP demonstrated more profound solid-like behavior characterized by a rather low phase angle, δ ~ 5°. The frequency sweep for CADP was similar to that of P and CAP (cf. Figure 5(B), Figure 3(B), and Figure 4(B)) and points to the formation of a very stable, immobile hydrogel. Also, the presence of polysaccharides in CADP hydrogel improved the resistance of CADP to deformation. The strain sweep (similar to P) became non-linear at γ ~3–4 %, however, CADP was much less brittle and broke only around γ ~20 % (cf. Figure 5(C) and Figure 4(C)). At the same time, CADP showed somewhat greater brittleness as compared to CAP.
Figure 5.

Dynamic oscillatory rheological characterization of mixed hydrogel CADP (formed by incorporation of two oppositely charged undecapeptides KWK and EWE into existing CAD network). (A) Time-sweep monitoring of gelation kinetics; plateau G′ ~ 10 kPa; final δ ~ 17°. (B) Frequency-sweep after viscoelastic modulus reached plateau. (C) Strain-sweep performed after frequency-sweep and 3 hrs of equilibrating time-sweep (see, Materials and Methods); yield value γ ~ 3–4 %; complete break of hydrogel at γ ~ 6 %. Elastic modulus G′ (open circles); viscous modulus G″ (solid circles); shear modulus G (triangles).
In summary, the above observations show that incorporation of peptides into the already existing fibrous networks of polysaccharides results in less stiff hydrogels (characterized by lower elastic moduli) as compared to the pure peptide network. On the other hand, the oligopeptide-polysaccharide composite hydrogels CAP and CADP exhibit much greater resistance to deformation. CAP hydrogels are virtually unbreakable up to ~ 100 % strain and are far less brittle as compared to the stiffer peptide hydrogel P. The difference in mechanical properties detected for the oligopeptide-polysaccharide composite hydrogels CAP and CADP as compared to the peptide hydrogel P could be explained by the interactions of oligopeptides with polysaccharides. Indeed, it has been shown that oligopeptides are capable of forming complexes with polysaccharides.30,31 Such complexation with polysaccharides could efficiently interfere with the attraction of oppositely charged KWK and EWE and hinder their co-assembly and packing into the fibers. This interference could lead to much less stiff CAP and CADP hydrogels as compared to P.
Structural Analysis of Mixed Oligopeptide-polysaccharide Hydrogels Using SANS
The analysis of structural characteristics of the hydrogels using SANS was employed to explore the relationships between the structural characteristics of the fibrous networks at the nanoscale level and the mechanical properties of bulk material formed by such networks.
In the SANS experiments, all five hydrogel networks, CA, CAD, P, CAP and CADP, showed an increased scattering intensity consistent with the formation of large assemblies (Figure 6). It can be seen in Figure 6 that the composite oligopeptide-polysaccharide hydrogels CAP and CADP (as well as the pure peptide hydrogel P) show much greater scattering intensities as compared to pure polysaccharide networks CA and CAD. Since the scattering intensity profile I(Q) vs Q reflects the mass and/or volume of the scattering assemblies, this points to the formation of denser, higher scattering aggregates for P, CAP, and CADP consistent with greater stiffness of these hydrogels observed in dynamic rheology experiments (see, Table 1, and also cf. Figure 1–Figure 5). One might expect that in addition to the density of the fibrous network, the morphology of the individual fiber and its cross-section also influences the material characteristics of bulk networks. Therefore, using a 2D dummy atom modeling routine,27 we have restored the cross-sectional shapes of the fibers constituting the networks under study with the best fit of scattering data (χ2 < 1.5). We have also derived the associated pair-wise distance distribution functions of the cross-sections, Pc(r). From the Pc(r) function, the important dimensional parameters of the fiber cross-section were derived such as the maximum cross-sectional dimensions of the fiber, Dmax, and the radius of gyration of the cross-section, Rc (Table 1).
Figure 6.

SANS scattering profiles I(Q) vs. Q for polysaccharide and mixed oligopeptide-polysaccharide networks: CA (chitosan + alginate), red; CAD (CA + chondroitin), green; P (KWK + EWE), purple; CAP (CA + P), black; CADP (CAD + P), blue. Guinier plots for rod-like particles, lnQ*I(Q) vs. Q2, are shown in the inset, and the linearity in this region indicates the formation of elongated fibers in all systems. Color code on inset corresponds to the main figure. Statistical error bars correspond to one standard deviation and represent error in the scattering intensity estimation. Error bars are large at the instrument configuration overlap region but are smaller than the plotting symbols at low Q.
Table 1.
Dimensional characteristics of the hydrogel networks and structural data of the individual fibers from SANS data analysis, and their elastic moduli from dynamic rheometry experiments.
| Hydrogels | Dmax (Å) | Rc (Å) | Lc (Å) | d | B | G′ (Pa) |
|---|---|---|---|---|---|---|
| CA (chitosan + alginate) | 445 | 152.7 | 150 | 3.0 ± 0.2 | 5.2×10⁻⁴ | 100 |
| CAD (CA + chondroitin) | 495 | 170.2 | 155 | 2.7 ± 0.1 | 3.7×10⁻⁴ | 400 |
| P (L-KW(KA)3KWK + L-EW(EA)3EWE) | 160 | 40.6 | 60 | 1.6 ± 0.2 | 4.1×10⁻³ | 90,000 |
| CAP (CA + P) | 100 | 25.7 | 98 | 1.7 ± 0.2 | 4.4×10⁻³ | 10,000 |
| CADP (CAD + P) | 145 | 39.0 | 104 | 1.9 ± 0.2 | 4.0×10⁻³ | 10,000 |
Dmax is the maximum dimension of the fiber cross-section in Å; Rc is the radius of gyration of the cross-section of the individual fiber in Å; Lc is the correlation length reflecting the mesh size of the network, i.e., the averaged distance between the individual fibers in the network in Å; d is the mass-fractal dimension defining the repetitive unit of the fiber (its “building brick”); B is the mass-fractal power-law prefactor describing the dimensional characteristics of the repetitive unit; and G′ is the elastic modulus of the networks in Pa.
It can be seen from the fiber cross-sections in Figure 7 that the addition of chondroitin (D) to the polysaccharide CA network leads to the incorporation of D into the fiber structure. As a result, the cross-section of the resulting fiber of CAD is bigger and thicker. As compared to CA, the maximum dimension of CAD, Dmax, increased from 445 Å to 495 Å, and the radius of gyration of the cross-section Rc grew from ~153 Å to ~170Å (Table 1). Incorporation of D into the CA fiber structure is also evident from the changes observed in the Pc(r) function of the cross-section (Figure 8(A)). Here, the addition of D results in a significant increase in contributions from the higher vector lengths scales ~400 Å. This is consistent with the formation of bigger and thicker fibers evident from the growth in Dmax and Rc when CA is transformed to CAD. One might suggest that this increase in thickness is translated into the greater stiffness of the CAD network as compared to the CA network (G′ of CAD is 4-fold larger than G′ of CA; see Table 1, also cf. Figure 1 and Figure 2).
Figure 7.

Pictorial description of the 2D shapes of a fiber cross-section in polysaccharide and composite oligopeptide-polysaccharide networks. The addition of chondroitin D to CA (chitosan + alginate, red) leads to much bigger and thicker fiber CAD (CA + chondroitin, green); while the addition of the peptides P (KWK + EWE, purple) to the above polysaccharide networks with the formation of CAP (CA + P, black) or CADP (CAD + P, blue) completely disrupts the structures of polysaccharides and results in the fibers with the cross-section very similar to the pure peptide network P.
Figure 8.

Changes in the pair-wise distance distribution functions Pc(r) of the fiber cross-section observed during the formation of polysaccharide and composite oligopeptide-polysaccharide networks. (A) Transformation of the Pc(r) for the CA (chitosan + alginate, red) network after the addition of chondroitin D resulting in the formation of the intricate CAD (CA + chondroitin, green) network. (B) Pc(r) as function of the pure peptide hydrogel P (purple) characterizing the asymmetrical flattened cross-section of the individual fiber. (C) Cross-section Pc(r) of the fibers assembled in the mixed oligopeptide-polysaccharide hydrogels CAP (CA + P, black) and CADP (CAD + P, blue) after disruption of the fibers of CA and CAD also characteristic for the asymmetrical flattened cross-section of the individual fiber.
The individual fiber of the pure peptide hydrogel P, co-assembled from KWK and EWE peptide modules, has a much smaller cross-section (Figure 7) with a Pc(r) pattern characteristic of highly asymmetrical flattened shapes (Figure 8(B)). Accordingly, the Dmax and Rc values of the P hydrogel are significantly lower as compared to CA and/or CAD networks (Table 1). However, despite smaller dimensional characteristics, the stiffness of the pure peptide hydrogel P is more than ~200-fold greater as compared to pure polysaccharide networks CA and CAD (Table 1, cf. Figure 1–Figure 3).
In this context, the cross-section dimensional parameters of the individual fiber are by no means the only determinants of the mechanical properties for the bulk fibrous networks. A definitive role is also played by the parameters characterizing the network density, packing and compactness of the fiber, which reflects its rigidity. SANS analysis allows us to reliably determine the correlation length of the network Lc or its mesh size, which is an extremely sensitive measure of the network density and, thus, of its strength. Even a moderate difference in the correlation length might have significant repercussions on the bulk material properties. For the materials described here, P is characterized by a more than 2-fold smaller correlation length Lc as compared to CA and/or CAD (Table 1). This large difference in Lc results in a much denser, solid network, which explains the profound strengthening in the elastic modulus G′ of the P hydrogel (Table 1, cf. Figure 1–Figure 3). Another factor contributing to bulk material properties is the mass-fractal dimension d, which describes the structure of the repetitive unit (“building brick”) of the fiber and the packing of such “building bricks” within the fiber. Mass-fractal analysis shows that the pure polysaccharide networks, CA and CAD, are assembled from randomly-branched building bricks (d values from 2.7 to 3.0, Table 1). These materials are characterized by a much greater degree of swollenness as opposed to the Gaussian-coil building bricks (d ~ 1.6, Table 1) characteristic for the pure peptide hydrogel P. Evidently, the fibers of P are assembled from more tightly packed repetitive units than the CA and/or CAD, which may be why they are characterized by much greater elastic modulus values (Table 1). Based on the above analysis, when comparing such structurally dissimilar networks—pure polysaccharides vs. pure peptides—the correlation lengths of the networks as well as the packing and compactness of the fibers define the mechanical strength of the bulk material to a far greater degree than the dimensional characteristics of the individual fiber.
In the same vein, one could analyze the formation of the composite oligopeptide-polysaccharide networks CAP and/or CADP. As seen from Figure 7 and Figure 8(C), addition of the peptide component P (KWK and EWE modules) to the matured polysaccharide networks, results in complete disruption of the intricate structural characteristics of CA and CAD. 2D shapes of the cross-sections (Figure 7) and Pc(r) functions of CAP and CADP (Figure 8(C)) have a distinctive asymmetrical, flattened shape and are very similar to those observed for the pure peptide hydrogel P. This observation confirms the above conclusion made on the basis of dynamic rheology data that during the co-assembly, whereby the charged peptide modules interact with the CA and/or CAD networks. Despite evident structural similarity of the fiber cross-sections of the P, CAP, and CADP networks, the correlation length Lc of the composite oligopeptide-polysaccharide hydrogels is significantly greater than in the case of the pure peptide hydrogel P (Table 1). Therefore, the mechanical strength of the composite oligopeptide-polysaccharide hydrogels is significantly lower as compared to the pure peptide network P (Table 1, Figure 3–Figure 5).
To summarize, the observed high scattering intensity is indicative of the interaction between polysaccharides and/or peptides, resulting in the formation of the fibrous networks. Addition of the oligopeptides to the polysaccharide hydrogels induces complete disruption of the initial polysaccharide fibrous networks. New oligopeptide-polysaccharide hydrogels are assembled and at the level of the individual fiber, such composite networks are structurally similar to the pure peptide hydrogel. Significantly greater mesh sizes of these composite networks leads to much less stiff material as compared to the pure peptide hydrogel. SANS analysis corroborates the suggestion made above on the basis of the rheology data that the weaker fibrous network of the composite oligopeptide-polysaccharide hydrogel is formed due to the complexation between peptide modules and sugar moieties, thus precluding the assembly of stronger, mutually reinforcing networks.
Conclusions
It is quite reasonable to expect that attempts to create biomaterials needed for human tissue engineering would be based on similar chemical composition of, e.g., cartilage, tendons, or ligaments which are formed from proteins and polysaccharides (glycosaminoglycans). In the present paper, we aimed to prepare composite hydrogels in which the fibrous peptide networks were combined with the fibers assembled from long, charged polysaccharide structures. In this way, our materials would mimic the chemical and/or structural composition of protein/polysaccharide composite-based human soft tissues. The pure polysaccharide networks (CA and CAD) were very weak materials with low elastic moduli, however, with significant resistance to deformation. Incorporation of the polysaccharides into the oligopeptide hydrogel also resulted in materials (CAP and CADP) with very high resistance to deformation (strain values from 20 % to 100 %), far less brittle compared to the pure peptide hydrogel P. However, the propensity of the oligopeptides to form complexes with the polysaccharides may be responsible for the significant loss of stiffness of the composite material as compared to the pure peptide hydrogel. 2D shapes of the individual fiber cross-sections, changes in the dimensional characteristics of the fiber, and the mesh size of the network illustrate the aforementioned interaction between the peptides and sugars. These results also explain the weakening of the composite oligopeptide-polysaccharide material. Our results suggest a novel approach for creating highly deformation-resistant biomaterials. Ways to increase material strength for the purpose of human tissue engineering will be a subject of our continued efforts.
Supplementary Material
Acknowledgments
Acknowledgments/Disclaimer. Financial support provided by the Maryland Technology Development Corporation (TEDCO) and the NIH (EB004416) is gratefully acknowledged. The identification of commercial products does not imply endorsement by the National Institute of Standards and Technology nor does it imply that these are the best for the purpose. This work is based upon activities supported in part by the National Science Foundation under Agreement No. DMR-0944772.
Footnotes
Supporting Information Available. Analytical HPLC and ESI-MS spectra of the peptides; IRENA estimations and fits for SANS data on polysaccharide networks and mixed oligopeptide-polysaccharide hydrogels; rheological data on gels stability; and SAXMorph analysis of the morphology of hydrogels.
References
- 1.Jayawarna V, Richardson SM, Hirst AR, Hodson NW, Saiani A, Gough JE, Ulijn RV. Acta Biomaterialia. 2009;5:934–943. doi: 10.1016/j.actbio.2009.01.006. [DOI] [PubMed] [Google Scholar]
- 2.Jung JP, Gasiorowski JZ, Collier JH. Peptide Science. 2010;94:49–59. doi: 10.1002/bip.21326. [DOI] [PMC free article] [PubMed] [Google Scholar]
- 3.Branco MC, Pochan DJ, Wagner NJ, Schneider JP. Biomaterials. 2009;30:1339–1347. doi: 10.1016/j.biomaterials.2008.11.019. [DOI] [PMC free article] [PubMed] [Google Scholar]
- 4.Silva GA, Czeisler C, Niece KL, Beniash E, Harrington DA, Kessler JA, Stupp SI. Science. 2004;303:1352–1355. doi: 10.1126/science.1093783. [DOI] [PubMed] [Google Scholar]
- 5.Kisiday JD, Kopesky PW, Evans CH, Grodzinsky AJ, McIlwraith CW, Frisbie DDJ. Orthopaedic Research. 2008;26:322–331. doi: 10.1002/jor.20508. [DOI] [PubMed] [Google Scholar]
- 6.Bakota EL, Aulisa L, Galler KM, Hartgerink JD. Biomacromolecules. 2011;12:82–87. doi: 10.1021/bm1010195. [DOI] [PubMed] [Google Scholar]
- 7.Taraban MB, Ramachandran S, Gryczynski I, Gryczynski Z, Trewhella J, Yu YB. Soft Matter. 2011;7:2624–2631. doi: 10.1039/C0SM00919A. [DOI] [PMC free article] [PubMed] [Google Scholar]
- 8.Dong H, Paramonov SE, Aulisa L, Bakota EL, Hartgerink JDJ. Am Chem Soc. 2007;129:12468–12472. doi: 10.1021/ja072536r. [DOI] [PubMed] [Google Scholar]
- 9.Aulisa L, Dong H, Hartgerink JD. Biomacromolecules. 2009;10:2694–2698. doi: 10.1021/bm900634x. [DOI] [PubMed] [Google Scholar]
- 10.Hosseinkhani H, Hosseinkhani M, Tian F, Kobayashi H, Tabata Y. Tissue Eng. 2007;13:11–19. doi: 10.1089/ten.2006.0120. [DOI] [PubMed] [Google Scholar]
- 11.Hyland LL, Taraban MB, Hammouda B, Yu YB. Biopolymers. 2011 doi: 10.1002/bip.21687. (published online on June 22, 2011) [DOI] [PMC free article] [PubMed] [Google Scholar]
- 12.Zhang S, Holmes T, Lockshin C, Rich A. Proc Natl Acad Sci U S A. 1993;90:3334–3338. doi: 10.1073/pnas.90.8.3334. [DOI] [PMC free article] [PubMed] [Google Scholar]
- 13.Ramachandran S, Tseng Y, Yu YB. Biomacromolecules. 2005;6:1316–1321. doi: 10.1021/bm049284w. [DOI] [PMC free article] [PubMed] [Google Scholar]
- 14.Ramachandran S, Flynn PF, Tseng Y, Yu YB. Chem Mater. 2005;17:6583–6588. [Google Scholar]
- 15.Ramachandran S, Trewhella J, Tseng Y, Yu YB. Chem Mater. 2006;18:6157–6162. [Google Scholar]
- 16.Chan WC, White PD. Fmoc Solid Phase Peptide Synthesis: A Practical Approach. Oxford University Press; New York: 2000. pp. 1–75. [Google Scholar]
- 17.Gill SC, von Hippel PH. Anal Biochem. 1989;182:319–326. doi: 10.1016/0003-2697(89)90602-7. [DOI] [PubMed] [Google Scholar]
- 18.Glinka CJ, Barker JG, Hammouda B, Krueger S, Moyer JJ, Orts WJJ. Appl Crystallogr. 1998;31:430–445. [Google Scholar]
- 19.Kline SRJ. Appl Chrystallogr. 2006;39:895–900. [Google Scholar]
- 20.Whitten A, Trewhella J. Small-Angle Scattering and Neutron Contrast Variation. In: Lee JW, Foote RS, editors. Micro and Nano Technologies in Bioanalysis. Humana; 2009. pp. 307–322. [Google Scholar]
- 21.Ilavsky J, Jemian PJ. Appl Crystallogr. 2009;42:347–353. [Google Scholar]
- 22.Debye P, Bueche AMJ. Appl Phys. 1949;20:518–525. [Google Scholar]
- 23.Soni VK, Stein RS. Macromolecules. 1990;23:5257–5265. [Google Scholar]
- 24.de Gennes PG. Scaling Concepts in Polymer Physics. Cornell University Press; 1979. [Google Scholar]
- 25.Glatter O, Kratky O, editors. Small Angle X-Ray Scattering. Academic Press; London: 1982. [Google Scholar]
- 26.Svergun DI. Biophys J. 1999;76:2879–2886. doi: 10.1016/S0006-3495(99)77443-6. [DOI] [PMC free article] [PubMed] [Google Scholar]
- 27.Whitten AE, Jeffries CM, Harris SP, Trewhella J. Proc Natl Acad Sci USA. 2008;105:18360–18365. doi: 10.1073/pnas.0808903105. [DOI] [PMC free article] [PubMed] [Google Scholar]
- 28.Ingham B, Li H, Allen EL, Toney MFJ. Appl Cryst. 2011;44:221–224. [Google Scholar]
- 29.Abramoff MD, Magelhaes PJ, Ram SJ. Biophotonics International. 2004;11:36–42. [Google Scholar]
- 30.Bysrický S, Malovíková A, Sticzay T. Carbohydr Polym. 1991;15:299–308. [Google Scholar]
- 31.Paradossi G, Chiessi E, Malovíková A. Biopolymers. 1999;50:201–209. doi: 10.1002/(SICI)1097-0282(199908)50:2<201::AID-BIP9>3.0.CO;2-Y. [DOI] [PubMed] [Google Scholar]
Associated Data
This section collects any data citations, data availability statements, or supplementary materials included in this article.